Abstract
To obtain both high ionization and high deposition rate, a modified global model for a continuous high-power DC magnetron sputtering (C-HPMS) is established by considering the continuous generation of the hot electrons and the high temperature caused by continuous high-power discharge. The results show that the plasma density is on the order of 1019 m−3 for power densities of only 183 W cm−2 (Al) and 117 W cm−2 (Cu). The ionization rate exceeds 90% of high-power impulse magnetron sputtering (HiPIMS) (peak power density of 564 W cm−2) for a DC power density of 180 W cm−2, and the total diffusion fluxes of the two targets are 26 (Al) and 30 (Cu) times that of conventional HiPIMS, leading to very high deposition rates. The work provides a theoretical basis for the realization of C-HPMS and gives an enlightenment to the development of deposition equipment for continuous high-power discharges.
Export citation and abstract BibTeX RIS

Original content from this work may be used under the terms of the Creative Commons Attribution 4.0 licence. Any further distribution of this work must maintain attribution to the author(s) and the title of the work, journal citation and DOI.
1. Introduction
As a surface deposition technique, magnetron sputtering has been widely used in many fields [1] but increasing industrial demands [2] require equipment that is capable of producing films with higher densities and adhesion strength. Compared to neutral atoms, ions have better controllability [3] as the energy and angle can be regulated by an electromagnetic field and consequently, the film structure and properties can be optimized more easily [4–6]. Therefore, it is essential to improve the plasma ionization efficiency in the instruments, for example, by means of high-power impulse magnetron sputtering (HiPIMS) [7, 8]. By introducing high-power pulses with a duty ratio of 0.5%–1.5% to the cathode, HiPIMS can generate high-intensity discharges and highly ionized plasmas. However, the instantaneous high intensity discharge tends to be unstable [3] and arcing occurs frequently, especially in reactive atmosphere. Although the problems can be mitigated by controlling the power and feedback, it is difficult to eliminate them totally. Meanwhile, owing to ion back-attraction [8, 9] and short pulse duration, the deposition rate of HiPIMS is much less than that of DC magnetron sputtering [8]. To improve the discharge stability and deposition rate, pre-ionizations by direct current (DC) [10], radio frequency [11], and medium frequency [12] are used to obtained more stable discharges, or alternate ionization and deposition are realized to obtain higher deposition rate by high and low pulsing techniques [13], modulated pulsed techniques [10], and deep oscillation pulsed techniques [14, 15]. However, the ionization rate is sacrificed and the improvement in deposition rates is limited [16]. Weakening the magnetic field strength on the target surface to reduce restrained electrons and ions can also improve the deposition rates [17–19] but it results in increased target voltage at the same time.
Compared to pulsed discharges, DC discharges are more stable and high-intensity DC magnetron sputtering is expected to increase the deposition rate. However, continuous high-intensity discharges raise the target temperature rapidly and can cause damage to the cathode [8]. In this work, the ionization and deposition rates of C-HPMS are studied by simulation and compared to HiPIMS to explore the practicality of C-HPMS. The results show that the DC discharge power density can be much lower than that of pulsed discharge for similar plasma density and ionization rate, but the DC deposition rate is nearly an order of magnitude larger than that of HiPIMS. Our results provide the theoretical basis for the realization of highly ionized and continuous high-power DC discharges.
2. Modeling and methods
In order to accurately calculate the evolution process of each particle in the discharge process and ionization rates of the sputtered materials, a C-HPMS global model is established based on the HiPIMS global model [20]. The simulation domain is the ionization region which is a circular semi-cylinder with the same diameter as the width of the etching ring on the target [21], as shown in figure A1.
In the Ar/Al discharge, the basic particles include cold electrons (e), hot electrons (eH), ground state atoms (Ar and Al), energetic atoms (ArH), metastable atoms (Arm), and ions (Ar+, Al+ and Al2+). The particle equilibrium equations are established based on the particle behavior. By adjusting the fitting parameters (Hall parameter ωτ: the ratio of Hall current to discharge current, which is usually between 8 and 30 [22] in a pulsed discharge), the calculated current Icalc (A) is the same as the actual current, indicating that the model reflects the real physical situation [21]. The influence of spatial inhomogeneity of the magnetic field is indirectly included in the Hall parameters. In the HiPIMS global model, fast overflow of hot electrons and space temperature increase are generally ignored due to the short time of the discharge pulse [20, 21, 23]. However, in the C-HPMS, the fast overflow of the hot electrons must be taken into account. In addition, the increased temperature prevents the inward diffusion of the background gas particles from the outside, which cannot be ignored, too.
In the HiPIMS global model, the hot electron equilibrium equation is described as equation (1) [21]:

where  (m−3) means the density of hot electron in discharge region.
  (m3) represent the total volume of discharge region. UD (V) is the pulse voltage, USH = UD−UIR (V) is the sheath voltage and UIR (V) is the presheath voltage. QH (W m−3) represents the energy loss in inelastic collisions between hot electrons and atoms [24]. The generation of hot electron is the secondary electron current mainly produced by sputtering of Ar+ and Al2+ and consumption is cooling of ionization collisions. The ionization collision frequency is related to the electron temperature and the relationship is evaluated experimentally [25].
In C-HPMS discharge (duration is 100%), the difference between the generation and the ionization of hot electrons will be amplified and accumulated with the discharge time. Consequently, the consumption of hot electrons is assumed to include two processes: overflow out of the ionization region and ionization collisions [21]. The latter is considered in the HiPIMS global model and so overflow of hot electrons should be added to the DC model. Accordingly, the hot electron equilibrium equation is expressed as equation (2):
The overflow flux is:

where R (m) is the half width of race track and  (V) is the temperature of hot electrons. The energy distribution function of the secondary electrons is assumed to be Maxwellian with temperature
  [26].
[26].  (m2 s−1) is the Bohm diffusion coefficient of electrons, as shown in equation (4)

B(T) represents the transverse magnetic field of the target surface. The overflow flux and diffusion coefficient of hot electrons can be derived from the electron movement [27]. However, owing to the energy difference between cold and hot electrons [25], the Hall parameter ( ) of hot electrons should be multiplied by a parameter:
  where
where  (V) and
  (V) represent the electron temperature of cold and hot electrons, respectively.
  (V) can be calculated by the energy balance equation. Since hot electrons are converted from secondary electrons which are accelerated by the sheath voltage, the hot electron temperature
  (V) is approximately 1/3 of the sheath voltage
  (V) [21] due to energy loss of collisions [28].
The cathode is assumed to have sufficient cooling capacity and the target does not melt or evaporate. Consequently, the effect of heat is mainly on the average velocity of the two particles Ar and Arm (the average temperature or velocity of the other particles are considered in the pulsed model). The particle fluxes ( and
and  ) of Ar and Arm and average thermal velocity (
 ) are:


and

where  (m−3) and
  (m−3) are the densities of Ar atoms in and outside the ionization region, respectively. Considering the ionization region temperature, the average velocity of neutral Ar moving outward from the ionization region is:

where  (K) is the temperature of the ionization region. The diffusion fluxes of Ar atoms become:

and

where the temperature of Ar entering the ionization region is 300 K and the temperature of the ionization region is calculated by the three-dimensional heat transfer field model for different power.
To verify the effects of hot electron accumulation and temperature rise on the discharge process, the Ar/Al discharge is simulated by four different models: (1) pulsed global model, (2) temperature modified model, (3) hot electron modified model, and (4) both hot electron and temperature modified models. Generally, the DC discharge becomes stable at about 300 and so 2000 μs is used to ensure that the discharge is stable so that the model can be fitted with the calculated current. The current and voltage used for fitting are obtained by experiments in which the Al target with dimensions of 121 mm × 294 mm × 12 mm is used in the DC discharge, discharge power is 5 kW, 10 kW, 15 kW, and 20 kW, respectively, and working pressure is 0.8 Pa.
The current evolution obtained by simulation and experiments versus discharge time is shown in figure 1. The current calculated by the original pulsed global model cannot converge in 2000 μs and continues to increase exponentially. At this time, the density of hot electrons is on the order of 1018 m−3, which is more than 10 times that of cold electrons, as shown in figure 1(a). After temperature modification, the evolution of the discharge current changes from being exponential to logarithmic within 2000 μs and the discharge process is close to equilibrium as shown in figure 1(b), indicating that temperature modification is indeed helpful to balance the discharge balance. However, it is not the key because extending the simulation time and adjusting the Hall parameter still cannot match the calculated and actual currents. Figure 1(c) shows that the discharge current reaches a stable state at about 1000 μs after some fluctuations and the numerical value is consistent with the actual current indicating the critical effect of hot electrons in the balance. After modifying the temperature and hot electrons, the discharge current converges rapidly before 300 μs and the fitted result is optimal as shown in figure 1(d). The convergence time is further shortened by increasing the power, revealing that the modified global model has a better convergence.

Figure 1. Actual and calculated currents: (a) pulsed global model, (b) temperature modified model, (c) hot electrons modified model, and (d) hot electron and temperature modified model.
Download figure:
Standard image High-resolution imageThe temperature increase affects plasma diffusion, ion sputtering, and collisions. Both the hot electron and temperature modified models are implemented to analyze the 20 kW DC discharge of the Al target. It is assumed that the temperature in the ionization region is 300–2000 K with an interval of 50 K. The evolution of the particle density and ionization with temperature is derived and presented in figure 2. For neutral atoms, the total Ar atom density decreases with increasing temperature because the Ar supplement from the outside to the ionization region decreases and Arm overflow increases. Meanwhile, the density of metal particles (Al and Al+) decreases because the high temperature increases the average free path of the particles to weaken sputtering and ionization. However, the ionization rate of metal increases by more than 10% as the temperature goes up from 300 to 2000 K. Owing to the high temperature in C-HPMS, the gas is rarefied before the target, resulting in that the collision occurs mostly between electrons and metal atom whose first ionization energy is much lower than that of the gas neutrals. Thus, the energy loss decreases, leading to an increase of the average electron temperature Te (V).
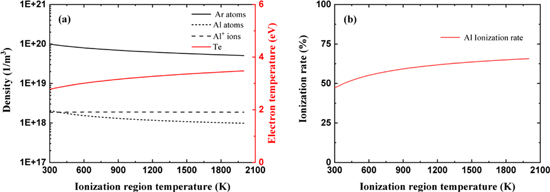
Figure 2. (a) Particle densities and (b) metal ionization rates versus temperature.
Download figure:
Standard image High-resolution image3. Results and discussion
According to the voltage-current expression of magnetron sputtering by Westwood [29]:

where J  is the current density, β' is the gas constant of the discharge system, V (V) is the voltage, and
  (V) is the ignition voltage, the voltage–current relationship of the abnormal magnetron glow system is quadratic. Therefore, the high-power discharge V–I curve can be obtained by the low-power discharge characteristics [30] obtained by experiments involving Cu and Al targets with a transverse magnetic field intensity on the target surface about 40 mT. The discharge race track width is 5 cm and the length of the race track is 51 cm. Thus the race track area is about 255 cm2. The input power is 1 kW, 5 kW, 10 kW, 15 kW, 20 kW, 25 kW, and 30 kW, respectively (provided by AE Ascent 60 K), and the working pressure is 0.8 Pa as shown in table 1. The high-power discharge V–I curves shown in figure 3 are obtained from the fitting of the table 1 data and the high-power voltage/current data shown in table 2 are obtained from the fitting of the curves in figure 3 at an interval of 5 kW.
Table 1. Low-power voltage–current characteristics.
| 1 | 476 | 2.1 | 457 | 2.2 |
| 5 | 563 | 8.9 | 544 | 9.1 |
| 10 | 600 | 16.7 | 599 | 16.7 |
| 15 | 626 | 24.0 | 631 | 23.8 |
| 20 | 649 | 30.8 | 649 | 30.8 |
| 25 | 671 | 37.3 | 665 | 37.7 |
| 30 | 693 | 43.3 | 676 | 44.5 |

Figure 3. Voltage-current characteristics of (a) Al and (b) Cu DC discharges.
Download figure:
Standard image High-resolution image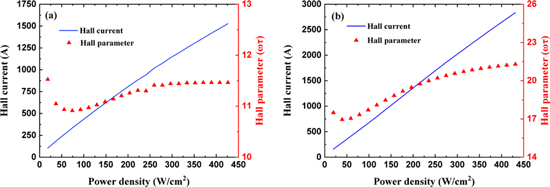
Figure 4. Hall currents and parameters versus power densities in the discharges of (a) Al and (b) Cu.
Download figure:
Standard image High-resolution imageTable 2. High-power voltage-current characteristics.
| 35 | 705.8 | 49.6 | 697.2 | 50.2 |
| 40 | 719.8 | 55.6 | 708.0 | 56.5 |
| 45 | 732.8 | 61.5 | 720.0 | 62.5 |
| 50 | 745.0 | 67.2 | 731.0 | 68.4 |
| 55 | 756.2 | 72.8 | 742.2 | 74.1 |
| 60 | 767.0 | 78.3 | 751.0 | 79.9 |
| 65 | 777.2 | 83.8 | 760.2 | 85.5 |
| 70 | 786.8 | 89.0 | 769.2 | 91.0 |
| 75 | 796.0 | 94.3 | 777.2 | 96.5 |
| 80 | 805.0 | 99.5 | 784.3 | 102.0 |
| 85 | 813.4 | 104.6 | 792.9 | 107.2 |
Using the parameters in table 2, the high-power DC discharges of Al and Cu can be simulated with both the hot electron and temperature modified global models. Figure 4 shows the calculation results including the evolution of the Hall current and Hall parameter versus discharge power [22, 31]. The Hall current generated by the cyclotron motion of electrons on the target surface represents the discharge intensity of the planar cathode. It increases almost linearly with discharge power on both the Al target and Cu target. The Cu target shows a larger slope than the Al target, indicating that the discharge intensity increases faster. The Hall parameter of both targets fluctuates when the power is small and then increases gradually and stabilizes. The stabilized Hall parameter of the Al target is about 11.5 and that of Cu is over 20 when the power density is 400 W cm−2, demonstrating that the Cu discharge is more intense. The sputtering yields of Al and Cu and particle energies calculated by SRIM [32] are shown in table 3. Cu has a larger sputtering yield than Al. The first ionization energy of Cu is 7.4 eV suggesting that Cu can be easily ionized and so the Cu discharge is strong. Although the first ionization energy of Al is smaller (5.8 eV), the sputtering yield of Al is less than that of Cu. Under the high power conditions, the metal discharge is dominant in the plasma [33] and the intensity of Al is less than that of Cu.
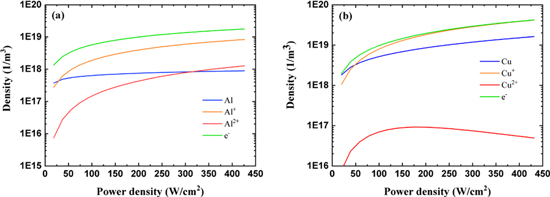
Figure 5. Typical particle densities in (a) Al and (b) Cu discharges versus power densities.
Download figure:
Standard image High-resolution imageTable 3. Sputtering parameters and ionization energies of Al and Cu calculated by SRIM.
| Al | 5.7(I) | 700 | 0.88(Ar → Al) | 10.6(Ar → Al) |
| 18.2(II) | 1.21(Al+ → Al) | 15.2(Al+ → Al) | ||
| Cu | 7.5(I) | 700 | 3.08(Ar → Cu) | 19.5(Ar → Cu) |
| 19.6(II) | 2.25(Cu+ → Cu) | 12.4(Cu+ → Cu) |
The densities of the typical particles in the plasmas of the Al and Cu discharges as a function of power are calculated and presented in figure 5. The electron density increases with discharge power and the plasma densities of Al and Cu are on the order of 1019 m−3 for power densities of 183 and 117 W cm−2. The density of Al atoms shows a small increase when the power density is low and maintains at 1018 m−3 when the power density exceeds 50 W cm−2, whereas the densities of Al+ and Al2+ increase continuously with power density. This phenomenon is mainly caused by the small sputtering yield and small ionization energy, inducing the increased sputtering atoms produced by higher power can be further ionized completely. Different from Al, both the densities of Cu and Cu+ continue to increase rapidly with increase power but that of Cu2+ changes relatively slowly up to the maximum before declining. As the power density goes up, more Cu atoms are sputtered and most of them are ionized because of the small first ionization energy of Cu. However, the large amount of first ionization arises from enhanced collisions between neutral atoms and electrons in the discharge causing the electrons to cool [23, 34]. The ionization energy of Cu+ to Cu2+ is higher and therefore, it is almost impossible for the electron energy to reach the condition of divalent ionization resulting in a smaller Cu2+ density. The density curve of Cu+ in figure 5(b) is almost coincidental with the electron density curve when the power density is large, suggesting that Cu+ ions are the dominant cations in the Cu discharge and sputtering is mainly self-sustained.
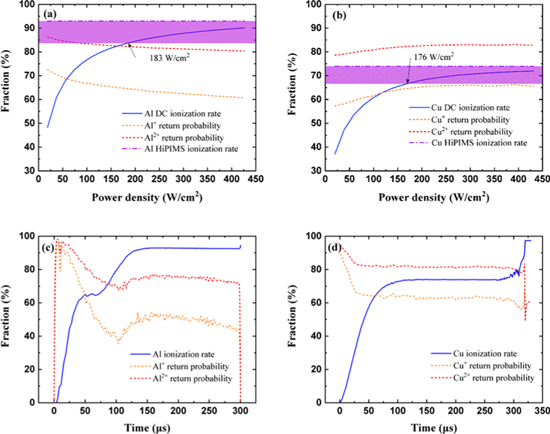
Figure 6. Ionization rate α and metal ion return probability β of (a) Al and (b) Cu versus power densities in the DC mode; (c) Al and (d) Cu versus discharge time in the HiPIMS mode.
Download figure:
Standard image High-resolution imageFigure 6 shows the ionization rates of metal sputtering in the ionization region calculated by the particle densities. Here, α represents the metal ionization rate and β stands for the probability of ions returning to the target. The metal ionization rate increases logarithmically with discharge power density. The ionization rate of Al exceeds 90% when the power density is 400 W cm−2 but that of Cu is only about 70%. For comparison, HiPIMS with a pulse width of 300 μs and peak power density of 564 W cm−2 are simulated by the pulsed global model as shown in figures 6(c) and (d). After stabilization of the HiPIMS discharge, the ionization rates of Al and Cu are 91.9% and 74.6%, respectively. Considering the instability of HiPIMS, DC and HiPIMS are assumed to have the same ionization levels when the difference is less than 10%, as shown by the purple region in figures 6(a) and (b). When the ionization rates of Al and Cu in the high-power DC discharges reach 90% of that of the HiPIMS discharge, the power densities are only 183 W cm−2 and 176 W cm−2, respectively, indicating that the power density required by C-HPMS is much less than that of HiPIMS for similar metal ionization rates. Due to the temperature increase of C-HPMS, the gas is rarefied and the proportion of metal atoms increases, resulting in a larger ionization collision probability of metal atoms. Besides, according to figures 6(a) and (b), the higher the power density, the slower the growth rate of the ionization rate. Thus, the ionization of C-HPMS can catch up that of HiPIMS with the increase of power density. With increasing discharge power densities, the probability of ion returning for Al+ decreases slowly but that of Cu+ increases initially, reaches a maximum, and then stabilizes. The increase in the probability of ion returning is smaller than that of the ionization rate, demonstrating that more ions diffuse outward from the ionization region. Therefore, it can be concluded that the effects of discharge power on deposition rate are positive.

Figure 7. Metal ion total diffusion flux ratio of DC discharges with different power densities to HiPIMS with the peak power density of 564 W cm−2.
Download figure:
Standard image High-resolution imageThe total diffusion fluxes of the metal ions at the edge of the ionization region are used to determine the deposition rates. The ratio of the deposition rates for different DC power to the HiPIMS (peak power is 564 W cm−2) discharge is obtained by simulation and shown in figure 7 This ratio increases rapidly with discharge power densities. For the DC discharge at 183 W cm−2 (Al) and 176 W cm−2 (Cu), the metal ionization rate of DC is close to that of HiPIMS. The total diffusion fluxes of Al and Cu are 26 and 30 times those of HiPIMS, respectively, and increase rapidly as the power density is increased. The results indicate that not only the DC discharge can provide highly ionized plasmas like HiPIMS with a smaller power density, but also the deposition rates of DC discharge are one order of magnitude higher than those of HiPIMS because of the longer duration.
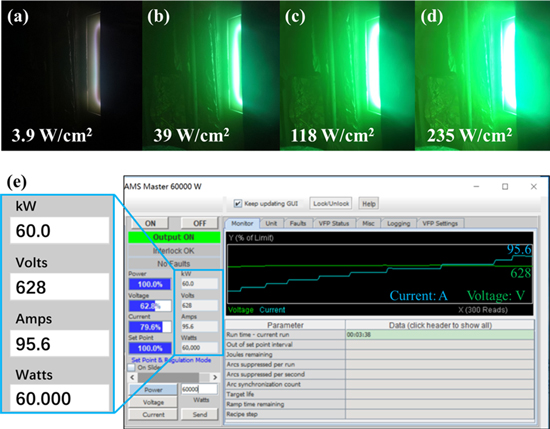
Figure 8. Glow pictures of Cu DC discharge experiments under (a) 3.9 W cm−2, (b) 39 W cm−2, (c) 118 W cm−2 and (d) 235 W cm−2. (e) I–V parameters: the blue line and the green line stand for the current and the voltage, respectively.
Download figure:
Standard image High-resolution imageA Cu target is used to carry out the C-HPMS by a homemade cathode under a powerful cooling, the glow pictures and I–V parameters are presented in figure 8. The glow becomes brighter significantly with increasing of the power. The maximum power density can reach 235 W cm−2 supplied by a high-power AE device, under which the glow is bright green indicating a stable and strong metal discharge. All the data reveals the feasibility to develop a long duration high-power glow discharge to obtain the high ionization and rapid deposition simultaneously.
4. Conclusion
Based on the pulsed global model for HiPIMS, a C-HPMS global model that incorporates the effects of hot electron accumulation and temperature rise is established. The model adds overflow of hot electrons and overflow of gas atoms at the high temperature. According to the voltage–current characteristics obtained from the low-power V–I data, the plasma discharges are simulated using Al and Cu as examples. The results show that similar plasma densities and ionization rates can be obtained by DC discharges but the power density of 183 W cm−2 (Al) and 176 W cm−2 (Cu) are smaller than that of HiPIMS (peak power is 564 W cm−2). Metals such as Al with smaller sputtering yields and ionization energy show weaker discharge intensity but higher ionization rates than those with larger sputtering yields and ionization energies such as Cu. The C-HPMS increases the effective sputtering time, resulting in the deposition rates of metal ions increased by more than 10 times. The results described in this paper provide the theoretical basis for the realization of high ionization and rapid deposition of coatings and insights into the development of deposition equipment for C-HPMS.
Acknowledgments
This work was financially supported by Guangdong Science and Technology Research Grants (No. 2015B090927003), Shenzhen Science and Technology Research Grants (JCYJ20150828093127698 and JCYJ20170306165240649), Hong Kong Innovation and Technology Fund (ITF) (No. ITS/452/17FP), Postdoctoral Innovative Talent Support Program (No. BX20190001), as well as Guangdong—Hong Kong Technology Cooperation Funding Scheme (TCFS) (GHP/085/18SZ).
Appendix
The schematic of the particle equilibrium reactions in the ionization region is shown in figure A1. The simulation area is approximately a semicircle. The subscripts are defined as follows: diff (diffusion), ex (excitation), Dex (de-excitation), iz (ionization), P (Penning ionization), chexc (charge exchange), coll (collision), recom (recombination), sput (sputtering) and modification of the hot electrons and temperature is highlighted in red in the figure.

Figure A1. Schematic diagram of modification of the C-HPMS global model.
Download figure:
Standard image High-resolution imageTable A1. Parameters in the global model.

|
Hall parameter (fitting parameter) | |
| B | Average magnetic field at the ionization region boundary | mT |
| ID | Experiment discharge current | A |
| UD | Experiment discharge voltage | V |

|
Secondary electron current, | A |
| USH | Sheath voltage. | V |
| Icalc | Simulated discharge current | A |
| P | Pressure | Pa |
| T | Gas temperature | K |
| RIR | The radius of the ionization region | M |
| ST | The contact area of the ionization region with the target | m2 |
| SIR | Ionization region superficial area | m2 |
| VIR | Ionization region volume | m3 |
| k | Reaction coefficient | m3 s−1 |
| γ | The secondary electron emission coefficient | |
| Y | Sputtering yield | |
| Te | Electron temperature | eV |
| n | Number density | m−3 |
| α | Ionization rate | |
| β | Ion return probability | |
| β' | Magnetic control system gas constant |
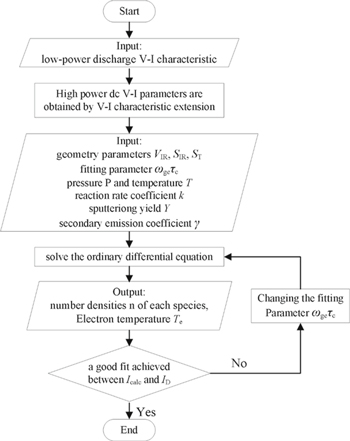
The particle density is described by considering the generation and loss of each particle. Based on the model described in our previous work [30], the model is modified by hot electron accumulation and vacuum chamber temperature increase and is calculated according to process shown in figure A2. Table A1 presents the parameters in the global model, in which n (m−3) is the density, m (kg) is the mass, and Γ (m−2 s−1) is the flux of the corresponding species. k is the reaction coefficient that can be calculated from table A2.
Table A2. Rate coefficients of the Ar/Cu and Ar/Al plasmas.
|

|
15.76 | [20] |
|

|
15.76 | [2, 23] |

|

|
11.56 | [20] |
|

|
11.56 | [2, 23] |

|

|
[27] | |

|

|
−11.56 | [20] |
|

|
4.2 | [20] |
|

|
4.2 | [35] |
|
|
7.68 | [36] |

|
 (Te > 36 eV) (Te > 36 eV) |
19.57 | [36] |

|

|
[37] | |

|
|
−4.46 | [38] |

|

|
[39] | |
|

|
5.57 | [21] |

|

|
18.17 | [21] |

|

|
[20] | |

|

|
−5.6 | [20] |

|
|
[20] |
A.1. Particle balance for Ar and metal species
M stands for metal in the following equations. For the working gas Ar, the rate equation is:
Considering the effect of heat on particle overflow, the diffusion flux of Ar is 
 is the density of Ar outside the ionization region calculated by the Clapper equation.
  is the Ar density calculated by the model. The average velocities of Ar particles in different temperatures regions are
  and
and  respectively.
  is the collision part of the metal and metal ion sputtering flux calculated by
  wherein
 and
and  are the overflow flux of metal and metal ions. uTM is the root-mean-square velocity of metal particle.
  is the collision probability with Ar in the ionization region.
  is the estimated cross-section of Ar-metal collisions based on the hard sphere model, aAr = 1.88 Å, aCu = 1.4 Å and aAl = 2.51 Å are the atomic radii of Ar, Cu and Al.
For Ar+, the rate equation is described as
 is the flux of Ar+ leaving the ionization region. The Bohm speed of Ar+ is defined as
For metastable atom Arm, the rate equation can be written as

Considering the effect of heat on particle overflow, the diffusion flux of Arm is 
 is the Arm density of the ionization region.
For ArH, the rate equation is
The rate equation for metal atoms is
where  represents the diffusion flux of metal atoms that have not collided. It can be expressed by
 and
and  are the fluxes of metal ions leaving the ionization region.
  is
is  times as much as

 and
and  are the sputtering yields of Ar+ and metal ions with target and calculate it in advance through the TRIM software. By fitting, the functional relationship between the discharge voltage and sputtering yield
  is obtained. For Cu ions, the fitting parameters are
  and
and  For Ar+, the fitting parameters are
  and
and  For Al ions, the fitting parameters are
  and
and 
The rate equations for M+ and M2+ can be described as
A.2. Particle balance for electrons
The rate equation for the electrons is
where the electron flux can be expressed as 
 is the Bohm diffusion coefficient of electrons and B is the average magnetic field at the boundary of the cathode sheath. A simplified Poisson equation is used to calculate the potential drop UIR in the ionization region
Introducing the hot electron diffusion effect, the rate equation of the hot electrons is as follows
 is the secondary electron current, UD is the pulse voltage and USH = UD−UIR is the sheath voltage.
  is the secondary electron emission coefficient. In this model,
 and
and  QH represent the energy loss in inelastic collisions between hot electrons and atoms [24]
A.3. Energy balance
Te is obtained by solving the energy balance equation, as equation (A11)
PD = UD × ID is the input power of the DC discharge, and ID and UD are obtained by experiments and volt–current characteristics. Q includes the energy losses by electron impact ionization with neutral atoms (Ar, Arm, ArH, and metal atoms) and energy losses of Penning ionization, plus the energy to de-excitation release as shown in equation (A13)
Figure A2. Flowchart of the C-HPMS global model.
Download figure:
Standard image High-resolution image
The collisional energy loss for each electron–ion pair are described as equation (A14)

The ion return probability β can be expressed as (A15)
and reveals the determined method of the free parameter  where Icalc is the simulated discharge current used to fit the experimental current ID