- Research
- Open access
- Published:
Metrics for network power based on Castells’ Network Theory of Power: a case study on Brazilian elections
Journal of Internet Services and Applications volume 9, Article number: 23 (2018)
Abstract
The identification of power groups that act within the political structure is a tool for citizens and also a challenging research topic as an unstable and complex force of interests system. This paper presents metrics based on sociologist Manuel Castells’ Network Theory of Power that reflect key factors for evaluating power: the imbalance between relationships; the ability to program the rules and protocols of the network; and the ability to serve as a switcher between two or more networks. A case study was developed using a network built on data from Brazilian Elections about electoral donations since 2002. The application of the metrics enabled to highlight some of the corporate and party interests dominant in the Brazilian context. The proposed metrics reflect the main contribution of this work: an approximation between sociology theory and topological analysis of a network. The use of domain knowledge combined with bottom-up strategies can leverage the comprehension of power and influence in political networks.
1 Introduction
Social power is an important concept to understand the actions taken within a particular context. The analysis of how much power one actor has over another is crucial to undercover the interests to which these actions are subordinate. When the agents are members of the government, they have the potential to affect millions of people and shape society. The identification of power groups that act within the political structure is a tool for citizens to face the debate with a critical and informed position. As the world move to a radical concentration of power in the hands of a few oligarchs, the study of its mechanisms is fundamental to activists and social movements to elaborate counter-power initiatives. The political context also offers a challenging and complex scenario for research: balance in relations are always changing; news political agents thrive; old politicians retire; pressure from the citizens can remove a politician from duty; corporations try to manipulate laws or market regulations in their benefit; elections can renew or change completely those who have power positions.
Power is frequently used interchangeably with influence and authority. It is necessary to remember classical sociological definitions to perceive the subtle differences between them: in [1] power is defined as potential influence and authority as a temporary power related to a specific role. Social influence and, more specifically, its propagation through networks, have gathered a lot of attention in computer science over the last years [2–6], leveraged by the amount of data available online. Social influence analysis aims at qualitatively and quantitatively measuring the influence of one person on others. The main problems in the area are (i) how to quantify the influence of each user and (ii) how to identify the so-called power elite - the key decision makers in a network. There are several definitions of influence and methods for calculating influence scores for different empirical purposes [7].
SNA (Social Network Analysis) is a field of research founded on sociology, physics, biology, mathematics, and computer science [8]. Analysts use mathematical models and graph theory to extract knowledge from data-built networks. The construction of the network is an arbitrary abstraction guided by scientists who decide what a node is and how the connections between nodes are made, for example using followers in social media applications [9–11] or co-authored academic papers [12–14]. From the connections, the most important nodes are determined by metrics like PageRank [15], betweenness centrality [16], among many others. In most of the studies, the network structure (or topology) reveals the influence dynamics in a bottom-up approach.
However, there are many possibilities still open, and the present study aims to add to the discussion on the evaluation of power and influence in social networks by applying a top-down approach. The research question is: how can we measure power in a political network using concepts from sociology, more specifically from Manuel Castells’ theory?
Using concepts from Castells’ A Network Theory of Power [17], we developed a set of metrics for evaluating power in a political network. The choice of Castells was motivated by the gap between his works and SNA literature: despite being a major specialist in theorizing our contemporary world as a network society, he is not mentioned as a key player by SNA researchers. Manuel Castells is perhaps the most influential sociologist in the analysis and understanding of contemporary society as a networked society. His trilogy The Information Age: Economy, Society and Culture[18] is a milestone in terms of theorizing the concept of a social network, how this abstraction fits the contemporary world, and the economic and individual implications of this concept. In spite of this, the interface of his work with the area of Social Network Analysis is small, as detailed in [19]. The author highlighted that the silence is reciprocal: Castells neither refers to classic literature from SNA nor is he cited by it as the important network theorist that he is. The gap has a methodological explanation. SNA scientists focused on formal mathematical modeling, computational methods, diagrams and matrices to study networks, thus emphasizing micro-structures and patterns. On the other hand, Castells was concerned about macro-structures that explain the connected society and did not address individual social ties.
Castells considers network theory to be a unifying language between the natural, human and social sciences, in consonance with Barabási [8, 20] and other social networking scientists [6]. But his emphasis is on ontology rather than methodology, and instead of focusing on training mechanics and structural dynamics, he turned to the sociological aspects of the network. While he believes that macroeconomic and social structure conditions the connections between individuals, social network analysis scientists analyze the connections and try to get the macro-structure from them.
The analysis of political processes has become an important part of network analysis and the political-economic analysis performed by Castells opens up the thematic linkages and the discussion of the power of global business, the state and interest groups within political networks [19]. A key aspect of power, according to Castells’ formulation [17], is the policy-making power held by elected politicians.
Thus, using Castells’ concepts, we incorporate and combine previous knowledge of the domain (in our case, political networks) and topology information. It is an attempt to address the challenge of capturing the rich process resulting from an interplay between agents’ behaviour and their dynamic interactions within a political and economic network [21].
To evaluate our strategy, we built a political network that included Brazilian politicians, political parties, and their main campaign donors. We applied the metrics to the network and compared our findings with a list of most influential politicians in Brazil, published every year by a nonpartisan organization.
This article is a substantially extended and reviewed version of [22]. The metrics are redesigned to better encompass concepts from Castell’s theory. In this article, we compare our findings with related work on influence and power that are based on topological properties of the network. We consider a rebuilt version of the network, expanding the data to all elections since 2002, including local governments and defeated candidates. The analysis was conducted over time, revealing the political network dynamics and changes. The results show valuable insights for a critical perspective of the electoral system in Brazil, that can also be applied to other scenario.
Concerning the structure of this article, in Section 2, we review classic sociological concepts for power analysis and summarize Manuel Castells’ theory. Still in the same section, we discuss some works that measure the influence or find the top influential users in social network research. In Section 3, we present the set of metrics and rules for network construction. In Section 4, we describe the process of data gathering, cleaning and analyzing data based on the metrics. In Section 5, we show the results of the analysis of the Brazilian political scenario. Finally, in Section 6, we highlight the limitations of our work and point out potential future work.
2 Background and related work
The power of an individual is broadly discussed in many fields of knowledge, including economy, philosophy, sociology, and psychology. Since our goal is to study power on political and economic social networks, this section focuses on authors who discuss the social aspect of power. Based on the studied authors, we can summarize power as the chance to impose one’s will on someone else within a social context [1, 17, 23–26]. Although shortly defined, power is difficult to measure. Richard Emerson, in his classical Network-Dependence Theory [27] highlighted that it is common for one person to dominate another while being subservient to a third one. Thus, it is questionable to think about a generalized power. To say that a person has power is incomplete unless over whom is also clarified. Thus, power should be a property of a relationship, not an absolute property of an agent. Still to Emerson, it is a relational property that depends on resource exchange and possession and it can be measured by the imbalance when one side is more dependent on the relationship than the other. Actors with multiple potential negotiation partners are perceived as powerful in their network. Relationships of power are deeply unstable and changeable. It leads to a constant clash between multiple forces in a network, and this directs us to the ideas of Castells, discussed briefly in the next section.
2.1 Manuel Castells’ Network Theory of Power
Castells’ theory of network society is essentially about the impact of informationalism on the economy, covering a wide range of issues from the conditions of the informational economy, globalization, industrial organization, changes in work and employment, and the emerging space of flows [18]. It is a political economy-oriented macro-analysis of the tensional relationship between the networks of informational economy and historically-rooted identities. Two key concepts in his framework are network and power and it is important to review the development of these ideas to contextualise our work.
His first statements about network logic appear in The Informational City [28]. He pointed out that new information technologies provided the basis for a change with major impact: spatially based relations of production were about to be substituted by flows of information and power in a much more flexible and connected system of production. This connected society, a progressive capitalist society, allows capital to become stronger by making networks, while the working mass becomes weaker with increasing individualism.
Later, in the concluding section of the first volume of the trilogy The Information Age: Economy, Society and Culture, the network concept was further elaborated and presented as a corollary: “a network is a set of interconnected nodes. A node is the point at which a curve intersects itself. What a node is, concretely speaking, depends on the kind of concrete networks of which we speak” [18]. He mentions concrete networks as examples of his statements: stock exchange markets; political elites in political networks; broadcasting systems; computer-aided communications and social network service providers in the global network of media.
In the second volume of the trilogy, he applied the idea of network to the analysis of the state, following the axiom that if networks have become the most important form of social organization, this must also apply to the state. The network state emanates from the complex networks of power, being manifested in a multilevel and multisector decision-making system based on negotiations [29].
In his book Communication Power, Castells continues the analysis of the network society from a power perspective. He argues that global social networks make use of global digital communication as a fundamental source of power and counter-power in contemporary society. Power is associated with coercion, domination, violence or potential violence, and asymmetry in the relations.
Finally, in his article A Network Theory of Power [17], he details sources and mechanisms of power. He states that the possession and exchange of valuable resources are a power determinant and also emphasizes two fundamental abilities required to gain power in a network: switching and programming. For Castells, power follows the logic of network construction. “In a networked world, the ability to exercise control over others lies in two basic mechanisms: (a) the ability to program or reprogram networks in terms of their goals and protocols; and (b) the ability to connect and secure cooperation between different networks by combining resources while isolating others through strategic competition” [17]. These skills are named as programming and switching, respectively. To understand these concepts, we have to detail what Castells calls network protocols: the standards of communication determine the rules to be accepted once in the network. Once the rules are set, they become compelling for all nodes in the network. The programmers are key actors who decide what are network goals and what protocols members must follow. The process differs from network to network.
Politicians are holders of programming power intrinsically based on their function in society: they define laws, apply military force, and social welfare programs, but they depend on winning the competition to access political office and to accomplish this, they must employ huge amounts of money in electoral campaigns. They must articulate the diversity of interests of campaign donors to maximize their autonomy, but at the same time, raise funds to increase their chances of seizing political power. Once in power, they are the programmers of political processes and policy making. Even then, the clash of forces continues: the judiciary exercises networking power by gate-keeping access to political positions and regulating procedures; political decision relies on media to communicate with the public and get support; media owners are not passive transmitters of political instructions: they distribute biased political programs according to their specific interests as media organizations. This interface between political networks and media networks is an example of switching power. It is the control over the connecting points between various strategic networks. When switchers become aligned in oligarchic domination, the dynamism and initiative of multiple sources of social structure suffocate. This is why the government should not control the media and reciprocally, media owners do not became political leaders. This can be extended to the relationships between religious leaders and media owners, and between politicians and rural corporations. Switching functions, and therefore switchers, play a central role to understanding power making [17].
We can summarize the concepts from Castells’ theory that we use on our metrics in three aspects:
-
nodes are connected by the exchange of resources that are valuable for the network;
-
when a node has the capability to change network rules it is a powerful node;
-
the most crucial ability in a networked society is the ability to bridge two or more different networks.
By reducing the gap between network topology studies and Manuel Castells’ theory, we approximate bottom-up and top-down approaches. We claim that SNA can benefit from this combination of topological features and domain knowledge. In the next section, we review metrics used in SNA literature for influence and power. The gap explained in the beginning of this section is well-illustrated when we move the discussion from macro theory to patterns and formulas.
2.2 Influence analysis background from social network analysis research
A directed network(N) can be defined using its node set and the adjacency weighted matrix. Formally, N = (V,W), where V is the node set and W = [Weightij]n∗n is the adjacency weighted matrix, it is common [2–4] to use Weight(edgeab)/OutWeight(a) or some proportional variation to compute authority of node a over node b, where OutWeight(a) is the sum of edge weights with source on node a. PageRank uses the transition probabilities between nodes in a Markov process and gets the authority rank from the stationary distribution. In [30] the focus is on the relationship between PageRank and social influence. The argument is that the authority (or PageRank) of a node is a collection of its influence on the network. As stated in [31], it is still not well understood what the evaluation models for social influence studies are and the research field is still on its preliminary stages.
The authors’ goal in [32] is to identify top-k influential (or powerful) nodes in a society as a whole. They propose a method for including nodes in the network and gathering data from various data sets, such as top foundations and corporations’ executive boards, all in Denmark. They applied a clustering algorithm to the resulting network based on a weighting scheme to find out the top-k powerful nodes. To validate their approach, they studied the relationship between this cluster and topological metrics like centrality and PageRank. With the same goal, [33] used a model based on a structural diversity assumption: a node is more likely to be influenced if impacted by nodes from different groups of neighbours. Our work differs from all the studies previously described because they do not use domain knowledge and they do not use the sociologists’ theories. All the findings are based on topological features, in a strict bottom-up approach.
We propose to use top-level theory to identify which topological feature should be considered in the calculations and to use domain knowledge explicitly. As an example, similar to our proposed strategy, the authors in [34] use well known social network metrics, like centrality and PageRank, to determine roles each criminal has in a money laundering network. The link between topological metrics and top-level roles was only possible through the cooperation of investigators with field knowledge of laundering methods, an approximation between domain knowledge, and bottom-up metrics. This mixed strategy generated excellent results with real world datasets and is quite similar to the path we follow in this study.
3 Metrics definition
We propose an evaluation of power specific to political networks that is an enhancement of what was proposed in [22]. Degree has generally been extended to correspond to the sum of weights when analyzing weighted networks and labeled node strength, or Wdegree. The modeled network is built from resource exchanges in real world. The amount of money (or other resource traded) is indicated by edge weights and the edge is directed and follow the same direction of the resource flow. Thus, a directed network is constructed. However, the volume of exchanged resources cannot be considered the only indication of the power of a node, as we need to find which is the most powerful part in the deal is and this, according to the selected underlying theory, depends on the complete exchange network of each of the nodes.
The political influence of node a over node b is defined in Eq. (1), where Wedgeab is the volume of resources transferred from a to b, and Windegreeb is the weighted indegree of node b, or the total amount of resources b received from its exchange partners. It means how much partner a is important to b. The bigger the number, the bigger is the influence of a on b decisions.
Symmetrically, bargain indicates how much partner b is important to a. If node a has few exchange alternative, b has negotiation benefits, as defined in Eq. (2), where W outdegreea is the weighted outdegree of node a, or total amount of distributed resources.
Finally, the imbalance in this relation is what defines the power associated with the edge. More potential partners means more power and more dependence means less power. The power acquired by the exchanges from a to b can be defined in Eq. (3).
The closer to zero, more balanced is the relation. Positive values mean the node who sends the resource, a, is more powerful and negative values indicate that the destination node, b, is more powerful. If the inverse relation (poweredgeba) is needed, the result should be multiplied by -1. This calculation reflects all the relations in the exchange network, since the results change for all the surrounding relations if a single edge is changed. The power of node a is the sum of each power relation with all M nodes in a network, as stated in Eq. (4).
To encompass the programming and switching abilities we propose that in an exchange network, switching power can be denoted in two ways: (i) if a node gathers and redistributes resources to other nodes within the same network and (ii) if a node exchanges with various sectors of society. The first is evaluate by the relation between the distributed amount (W outdegree) and the total amount exchanged by the node (W degree). For the second, we need to show how different the exchange partners of a node are and then use top-level domain knowledge, if any. Consider each node has an attribute indicating to which religious or economic sector it belongs. We then add a tuning parameter δ for diversity, meaning the number of different sectors a node has exchanged with and in this way modeling Castell’s switching concept. For programming (or node capacity to define rules and protocols in the network), we use a tuning parameter Ωa. So, finally, Eq. 4 can be adjusted and Power defined in Eq. (5).
4 Gathering and cleaning data from Brazilian elections
Brazil’s multi-party system allows the creation of a new party with 1 million signatures. As a result, as of December 2017, there are almost 40 political parties in Brazil. However, we can distinguish three major parties that remained in power in the last four decades: PT(center-left ideology), PSDB(center-right ideology) and PMDB/MDB(right ideology). Brazil is facing a critical moment: important politicians, since state governors and senators are being prosecuted, facing corruption charges, and eventually going to jail. The investigations show that many campaign donations are in fact bribes or payment for some illegal benefitFootnote 1. Donations from corporations and persons to a party or directly to a candidate were legal until 2014. In 2016 elections, regulation was stricter and corporate donations forbidden and personal donations were limited to ten thousand Brazilian Reais, except for the case of candidates using their own money.
To evaluate these metrics, we built a network based on open data of the Brazilian government extracted from the Supreme Electoral Court [35]. Brazilian law guarantees that all Brazilian citizens have access to any public information unless explicitly classified (Law n° 12,527, 12/18/2011). Candidates to public legislative or executive positions must deliver the report of their expenses as well as income during electoral campaigns, but this raw data is difficult to visualize and analyze. The goal of this case study is to make clear power relations that can be inferred from the campaign donations.
The database contains information on campaign donations since 2002 elections. The data is unstructured in flat (.csv) files. The network has nodes that represent candidates, political parties and donors. These nodes are connected by edges that represent financial transactions (campaign donations) and the weight of the edges is the amount involved in the transaction. Since 2014, resources can be transferred between parties and candidates explicitly. In these cases, two edges were created: one for the original exchange and another for the transfer of resources. As we want to analyze network dynamics over time, each edge and node were created with temporal timestamps.
For the switching δ factor, we use the economic activity information present in the dataset. For each different activity in the related nodes, we add one to δ. For example, a politician with donors from construction industry, retail industry and food industry would have δ equal to three.
For the programming Ω factor, to each political role was assigned an arbitrary value indicating the importance and decision power of each position, as showed in Table 1. The programming factor is temporary: when a candidate wins an election, the programming power is valid during the years of his term (usually 4 years, except for senators, who have 8 years).
Data cleaning removed duplicated nodes and grouped in the same node all the legal committee of the same political party. Data cleaning was particularly challenging and a lot of inconsistencies were detected, for example, candidates and donors without proper identification. The network considers only donations over ten thousand Brazilian Reais.
The result is a network with 103,345 nodes and 128,288 edges, distributed over the last fifteen years. We use Gephi software to generate visualizations and metrics of the network and MySQL combined with Python scripts to perform data cleaning and metrics calculation.
5 Results
For the presentation of our results, we go from general to more detailed information, showing different aspects our metrics can encompass. First, we show general information and evolution of Brazilian electoral campaign financing numbers from 2002 to 2016 and how this political and economic network evolved in time using a few SNA metrics. We also detail the profile of big campaign donors and the economic sectors they represent. Thereafter we evaluate our metrics comparing the top 100 Congressman (Senators and Federal Deputies) with a well-known list published every year by a non-partisan organisation, with good results. After this validation we present top donors and political parties according to our power metric and analyze the relation between power and amount donated and received by them. Finally, we choose two famous Brazilian politicians and go into details of their poweredges, indicating each power relation they have with campaign donors.
5.1 General overview through time
We would like to share some general insights from our data, only possible after the cleaning process and the analysis of elections data along the years.
There has been a significant growth in the amount of money donated to political parties, specially after 2008. This growth can be glimpsed in the network: Table 2 shows the evolution of SNA metrics over the years.
The evolution of the network thorough time is also shown in Figs. 1 and 2. Figure 1 shows the evolution of the network for local elections years and Fig. 2 shows the general elections years. Both figures were created using the Yifan Hu distribution algorithm [36].

Network evolution - local elections

Network evolution - general elections
The financial numbers are big and increasing: considering donation amount since 2002, all the top 50 Brazilian politicians received over 20 million Brazilian Reais (6 million dollars) in direct donations, not considering donations received through their political parties. Many of them appear every four years, renewing their power positions. The amount of money each one received rises dramatically after 2008 as seen in Fig. 3, even considering inflationFootnote 2. Three major political parties (PMDB, PSDB and PT) are highlighted on the chart. New regulations forced numbers down in 2016.
As examples of that growth: Marconi Perillo, the current governor of the state of Goiás, ran in 2002, 2006, 2010 and 2014 elections and received around 9, 13, 29 and 25 million Brazilian Reais (2.7, 3.9, 8.8 and 7.5 million dollars) respectively. Carlos Alberto Richa, another state governor, ran in 2002, 2008, 2010 and 2014 elections and received around 2, 6, 23 and 25 million Brazilian Reais (0.6, 1.8, 6.9 and 7.5 million dollars) respectively. This behaviour is a pattern repeated many times among the top politicians.
The profile of the main donors also changed in time. We selected the top 30 donors each year and grouped them by economic activity. General elections - when senators, deputies, governors and the president are elected - occurred in years 2002, 2006, 2010 and 2014. Local elections - when mayors and city councilmen are elected - occurred in 2004, 2008, 2012 and 2016. There were some differences in the behaviour of the top donors in these two kind of elections. The results seen in Figs. 4 and 5 show that in general elections there was a constant rise in the total amount donated by these heavy donors and also a dramatic rise of influence from food industry. On the other hand, local elections showed a big explosion of the amount donated in 2012, simultaneously with a concentration of political parties as distributors of the money. We do not see corporate investment as dominant in these years as they are in general elections years. Figures 6 and 7 illustrate these findings. One possible interpretation is that the general elections are more attractive to corporations. Other aspect is that political parties use local elections to consolidate their power where they are already strong.

Big contributors total amount - general elections

Big contributors by sector - general elections

Big contributors total amount - local elections

Big contributors by sector - local elections
5.2 Power metrics results
To evaluate the metrics, we consider a list with the top 100 politicians from the National Congress (Senators and Federal Deputies) according to our power metric and compared it with the list generated by DIAP (acronym for Intersindical Parliamentary Assessors Department, in Portuguese) for the years 2015, 2016 and 2017. We identify that 54 of our top politicians were present at DIAP’s 2015 list, 58 at DIAP’s 2016 list and 55 at DIAP’s 2017 list [37]. In [38] the authors ranked Brazilian Congressman using topological metrics and also used DIAP’s list as a target list. Our metrics surpasses their results by 2 times, as they identified 27 percent of DIAP’s list. The complete table comparing our findings with DIAP’s list can be found at https://github.com/LinkedOpenDataUFRJ/JISA_Article_PowerAnalisys.
The power analysis allowed us to extract the most powerful corporate and personal donors in Brazilian scenario. Tables 3 and 4 show the top influences Brazilian politicians are subjected to and the amount of money involved in donationsFootnote 3. We can see the strength of food industry as well as the presence of big construction corporations. As can be observed, the power metric does not have a direct relation to the amount donated. As an example, we can highlight that Distribuidora Coimbra and MRM Construtora Ltda donated much less than Construtora OAS Ltda. but have a greater power measure. Although the names on Table 4 may be unknown for many people, they highlight hidden influences sometimes bigger than corporate ones. Most of the persons on the list are owners of big companies in Brazil or billionaire politicians. We can also extract the relation between the powerful donors and the political parties, as showed on Tables 5 and 6.
We analyzed power distribution among political parties. Table 7 shows the top ten parties in the Brazilian political scenario. The four major parties lead the list, but we can also see local representations (PMDB-RJ and PMDB-RN) among the top powerful groups.
Another aspect to be noticed is the amount of money that flows between parties that are considered adversaries, especially from big parties to smaller ones, as we can see in Table 8.
As stated in Section 2, the analysis of power is incomplete unless we detail who is the subject of this power. We could notice some famous and supposed powerful politicians that were not top-ranked in our list. We chose two of them to go into their poweredge details. They are quite similar: both from the same state (RJ), both federal deputies with important positions (head of Congress) and both received around the same amount in campaign donations. Our purpose is to detect if they have similar power structure. (i) Eduardo Cunha was a federal congressman from Rio de Janeiro, head of Congress for five years and the main leader of the impeachment process of president Dilma Rouseff that occurred in 2016. On 19 October 2016, Cunha was arrested by the Brazilian Federal Police, accused of hiding approximately 40 million dolars in secret bank accounts and on trying to tamper with investigations against him. His poweredges can be found in Table 9. (ii) Rodrigo Maia is also a federal congressman from Rio de Janeiro and was nominated head of Congress in Brazil after Eduardo Cunha was arrested. His poweredges can be found in Table 10.
Considering that a positive poweredge means that the candidate has more power and a negative one means the donor is the one who rules the relationship, we can see Eduardo Cunha is totally subjected to his party (PMDB-RJ) and, with less force, to two big construction industry players, Camargo Correa S.A. and Construtora Norberto Odebrecht S.A., both deeply involved in recent bribe scandals in Brazil.
Rodrigo Maia’s poweredges show much more balanced relationships, with smaller values on the negative side. This means he is more independent from his campaign donors, from his party and, therefore, more powerful, as the calculations bellow demonstrate.
According to the proposed Eq. 5, the general power for Mr. Cunha is calculated using: (a) sum of his poweredges: -1,072,756; (b) his δ factor: 9, the count of different economic sector he traded with; and (c) his Ω factor: 4, obtained in Table 1 for Federal Deputy, considering the following result: PowerEduardoCunha=9∗4∗−1,072,756=−38,619,216.
Similarly, the power for Mr. Maia is calculated (a) sum of his poweredges: 650,232; (b) his δ factor: 8; and (c) his Ω factor: 4, as he is also a Federal Deputy, considering the following result: PowerRodrigoMaia=8∗4∗650,232=20,807,424.
Complete tables with poweredges, all the data, source code and network files are available in https://github.com/LinkedOpenDataUFRJ/JISA_Article_PowerAnalisys. and are free to use under the GNU license.
6 Conclusion
This article presented metrics for power analysis on political and economic networks based on sociologist Manuel Castells’ Network Theory of Power. Such environment, where power is the result of a constant clash of forces, is hard to analyze and to quantify. Such challenge was reinforced by the specific scenario we chose to evaluate our proposal: Brazilian politics. With almost 6000 cities, 23 states, Brazil is facing a critic moment is its democracy. To identify whose interests are behind each political group or individual politician is key to have citizens better informed.
Our main contributions can be summarized as follows: (i) we developed quantitative metrics for power analysis on political network using domain knowledge combined with classical SNA metrics; (ii) in order to evaluate our metrics, we applied our metrics to a Brazilian economic and political network based on campaign donations in Brazil since 2002. Then, we compared our list of the top 100 powerful congressman with a well-known list published every year with good results; (iii) we performed a detailed analysis of some aspects in Brazilian politics that revealed what are the top influencing corporations and persons in this scenario and also the flow of money from one political party to another; and finally (iv) we provided a detailed analysis of power relations in Brazilian scenario from 2002 to 2016, with the publication of a clean and fine-grained dataset for future research.
Some limitations can be listed though: data about activity sector was not complete in our dataset and should be extracted from alternative sources manually. This limited our computation of switching power and was made only for donors above 1 million Brazilian Reais. The metrics gave a glimpse of the dynamic of power involved in Brazilian elections, but rules are changing fast for campaign donation and money laundry and bribes networks are hard to capture only with official data.
Some future enhancement are needed and planned: we intend to redesign the power metric to show relative values inside the network, instead of big absolute values. We will also integrate information about company owners to reveal hidden connections behind donations and politicians. We plan to add connections in the network between candidates and their individual campaign committees. In the present study donations for these committees were considered as donations to the political party, instead of to individual candidate. Finally, we intend to capture domain information from alternative datasets to evaluate if politicians or donors are religious leaders, owners of communication corporations or financial operators, because these networks should wield more power in the evaluation of switching power, according to Castells.
Notes
Journalist information on bribe scandals in Brazil can be found in http://www.bbc.com/news/world-latin-america-35810578, https://theintercept.com/2017/08/03/brazils-corrupt-congress-protects-its-bribe-drenched-president-finalizing-elites-two-year-plot/ and https://www.theguardian.com/world/2017/jun/01/brazil-operation-car-wash-is-this-the-biggest-corruption-scandal-in-history
Historical inflation taxes in Brazil: 1999: 8.94%, 2000: 5.97%, 2001: 7.67%, 2002: 12.53%, 2003: 9.30%, 2004: 7.60%, 2005: 5.69%, 2006: 3.14%, 2007: 4.46%, 2008: 5.90%, 2009: 4.31%, 2010: 5.91%, 2011: 6.50%, 2012: 5.84%, 2013: 5.91%, 2014: 6.41%, 2015: 10.67%, 2016: 6.29%, 2017: 2.95%. As an example, 2 million Brazilian Reais in 1998 is equivalent to 6.5 million in 2016.
Fig. 3 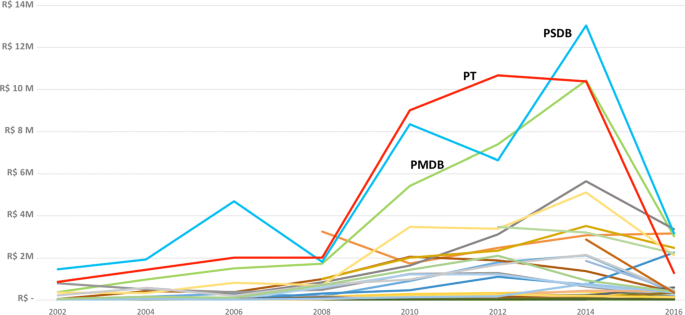
Amount donated to political parties. Evolution over the years
Exchange rate: 1 USD = R$ 3.30. Official dollar exchange rate for 12/31/2017
Table 3 Top 20 corporate donors considering power metrics Table 4 Top 10 personal donors considering power metrics

References
French JRP, Raven B, Cartwright D. The bases of social power. Class Organ Theory. 1959; 7:251–60.
Li J, Peng W, Li T, Sun T, Li Q, Xu J. Social network user influence sense-making and dynamics prediction. Expert Syst Appl. 2014; 41(11):5115–24.
Muchnik L, Aral S, Taylor SJ. Social influence bias: A randomized experiment. Science. 2013; 341(6146):647–51.
Kempe D, Kleinberg JM, Tardos É. Maximizing the spread of influence through a social network. Theory Comput. 2015; 11(4):105–47.
Lawyer G. Understanding the influence of all nodes in a network. Sci Rep. 2015; 5:8665.
Easley D, Kleinberg J. Networks, Crowds, and Markets: Reasoning About a Highly Connected World. Cambridge: Cambridge University Press; 2010.
Sun J, Tang J. A Survey of Models and Algorithms for Social Influence Analysis In: Aggarwal C, editor. Social Network Data Analytics. Boston: Springer: 2011.
Barabási A-L. Linked: The New Science of Networks. New York: AAPT; 2003.
Java A, Kolari P, Finin T, Oates T. Modeling the spread of influence on the blogosphere. In: Proceedings of the 15th International World Wide Web Conference: 2006. p. 22–26.
Hajian B, White T. Modelling influence in a social network: Metrics and evaluation. In: Privacy, Security, Risk and Trust (PASSAT) and 2011 IEEE Third Inernational Conference on Social Computing (SocialCom), 2011 IEEE Third International Conference On. Boston: IEEE: 2011. p. 497–500.
Ye S, Wu SF. Measuring message propagation and social influence on twitter. com. SocInfo. 2010; 10:216–31.
Van Raan A. The influence of international collaboration on the impact of research results: Some simple mathematical considerations concerning the role of self-citations. Scientometrics. 1998; 42(3):423–8.
Glänzel W, Schubert A. Analysing scientific networks through co-authorship. Handb Quant Sci Technol Res. 2004; 11:257–79.
Börner K, Dall’Asta L, Ke W, Vespignani A. Studying the emerging global brain: Analyzing and visualizing the impact of co-authorship teams. Complexity. 2005; 10(4):57–67.
Page L, Brin S, Motwani R, Winograd T. The pagerank citation ranking: Bringing order to the web, Technical report. Standford: Stanford InfoLab; 1999.
Freeman L. A set of measures of centrality based upon betweenness. Sociometry. 1977; 40:35–41.
Castells M. A network theory of power. Int J Commun. 2011; 5:773–87.
Castells M. The Information Age. Economy, Society and Culture. Vol I: The Rise of the Network Society. Oxford: Blackwell; 1996.
Anttiroiko A-V. Castells’ network concept and its connections to social, economic and political network analyses. J Soc Struct. 2015; 16:1–18.
Barabási A-L. The architecture of complexity. IEEE Control Syst. 2007; 27(4):33–42.
Schweitzer F, Fagiolo G, Sornette D, Vega-Redondo F, Vespignani A, White DR. Economic networks: The new challenges. science. 2009; 325(5939):422–5.
Verona L, Campos MLM, Oliveira J. Métricas para análise de poder em redes sociais e sua aplicação nas doações de campanha para o senado federal brasileiro. In: Proceedings of XXXVII Congresso da Sociedade Brasileira de Computação: 2-6 July 2017; São Paulo: 2017. p. 544–54.
Emerson RM. Social exchange theory. Annu Rev Sociol. 1976; 2:335–62.
Hindess B. Discourses of Power from Hobbes to Foucault. New Jersey: Wiley; 1996.
Willer D, Markovsky B, Patton T. Power structures: Derivations and applications of elementary theory. Sociol Theor Prog. 1989; 3:313–53.
Willer D. Network Exchange Theory. Connecticut: Greenwood Publishing Group; 1999.
Emerson RM. Power-dependence relations. Am Sociol Rev. 1962; 27:31–41.
Castells M. The Informational City: Information Technology, Economic Restructuring, and the Urban-regional Process. Oxford: Blackwell; 1989.
Castells M. The Information Age. Economy, Society and Culture. Vol II: Power of Identity. Oxford: Blackwell; 1997.
Liu Q, Xiang B, Yuan NJ, Chen E, Xiong H, Zheng Y, Yang Y. An influence propagation view of pagerank. ACM Trans Knowl Discov Data (TKDD). 2017; 11(3):30.
Peng S, Yang A, Cao L, Yu S, Xie D. Social influence modeling using information theory in mobile social networks. Inf Sci. 2017; 379:146–59.
Larsen AG, Ellersgaard CH. Identifying power elites—k-cores in heterogeneous affiliation networks. Soc Networks. 2017; 50:55–69.
Xu W, Liang W, Lin X, Yu JX. Finding top-k influential users in social networks under the structural diversity model. Inf Sci. 2016; 355:110–26.
DreŻewski R, Sepielak J, Wojciech F. The application of social network analysis algorithms in a system supporting money laundering detection. Inf Sci. 2015; 295:18–32.
Brazilian electoral data repository. http://www.tse.jus.br/hotSites/pesquisas-eleitorais/index.html. Accessed 20 Aug 2017.
HU Y. Efficient, high-quality force-directed graph drawing. Math J. 2005; 10(1):37–71.
A research about most influential congressman in Brazil. http://www.diap.org.br. Accessed 20 Nov 2017.
Bursztyn VS, Nunes MG, Figueiredo DR. How congressmen connect: analyzing voting and donation networks in the Brazilian congress. In: Proceedings do XXXVI Congresso da Sociedade Brasileira de Computação; São Paulo: 2016.
Acknowledgements
The authors would like to thank CNPq and FAPERJ for partially supporting this work. We would like to thank the organisers of BraSNAM 2017, Giseli Lopes and Rodrigo Pereira dos Santos for their excellent work on the conference. We also thank the anonymous reviewers for their complimentary comments and suggestions.
Author information
Authors and Affiliations
Contributions
All authors read and approved the final manuscript.
Corresponding author
Ethics declarations
Ethics approval and consent to participate
Not applicable. All data used in the study was already publicly available.
Consent for publication
Not applicable. All data used in the study was already publicly available.
Competing interests
The authors declare that they have no competing interests.
Publisher’s Note
Springer Nature remains neutral with regard to jurisdictional claims in published maps and institutional affiliations.
Additional information
Availability of data and materials
All data and code used in this article can be found at https://github.com/LinkedOpenDataUFRJ/JISA_Article_PowerAnalisys and can be used freely under GNU license.
† This article is a substantially extended and revised version of Verona (2017), which appeared in the proceedings of the VI Brazilian Workshop on Social Network Analysis and Mining.
Rights and permissions
Open Access This article is distributed under the terms of the Creative Commons Attribution 4.0 International License (http://creativecommons.org/licenses/by/4.0/), which permits unrestricted use, distribution, and reproduction in any medium, provided you give appropriate credit to the original author(s) and the source, provide a link to the Creative Commons license, and indicate if changes were made.
About this article

Cite this article
Verona, L., Oliveira, J., da Cunha Hisse, J. et al. Metrics for network power based on Castells’ Network Theory of Power: a case study on Brazilian elections. J Internet Serv Appl 9, 23 (2018). https://doi.org/10.1186/s13174-018-0092-5
Received:
Accepted:
Published:
DOI: https://doi.org/10.1186/s13174-018-0092-5