- Research
- Open access
- Published:
GARSAaaS: group activity recognition and situation analysis as a service
Journal of Internet Services and Applications volume 10, Article number: 5 (2019)
Abstract
Human activity recognition using embedded mobile and embedded sensors is becoming increasingly important. Scaling up from individuals to groups, that is, group activity recognition, has attracted significant attention recently. This paper proposes a model and specification language for group activities called GroupSense-L, and a novel architecture called GARSAaaS (GARSA-as-a-Service) to provide services for mobile Group Activity Recognition and Situation Analysis (or GARSA) applications. We implemented and evaluated GARSAaaS which is an extension of a framework called GroupSense (Abkenar et al., 2016 IEEE 30th International Conference on Advanced Information Networking and Applications (AINA), 2016) where sensor data, collected using smartphone sensors, smartwatch sensors and embedded sensors in things, are aggregated via a protocol for these different devices to share information, as required for GARSA. We illustrate our approach via a scenario for providing services for bush walking leaders and bush walkers in a bushwalking group activity. We demonstrate the feasibility of our model and expressiveness of our proposed model.
1 Introduction
Getting informed of occurred group activities, and situations within group activities, may benefit both a tracker (i.e., a person, group or any consumer who is interested in receiving information about groups) and a trackee (i.e., a person or group being tracked who might also receive service/s from trackers). For example, let us assume Tom and Josh are bushwalking leaders who are responsible for taking care of a group of bushwalkers. Usually, Tom walks at the front of the group and Josh behind. They communicate with each other through a hand-held transceiver (such as a walkie-talkie) or a mobile phone to update each other regarding the group’s status. Also, it is crucial to know if a bushwalker is in danger, such as experiencing a health issue or at risk of becoming lost. Another motivating scenario might be monitoring the eating together activity in which we can measure how much time a family has spent. Consequently, the level of family happiness would be feasible to be estimated [34]. Monitoring eating together can also be an aspect of social health and well-being of people, which is now trackable based on our approach.
Collecting sensor data from a large number of individuals to aggregate, analyze and make sense of has been called Crowd Sensing (CS) [22]. But individuals may not have the tech-savviness and sufficient incentives to contribute or share their sensor data [9, 12]. A service-oriented approach to group activity recognition and situation analysis can be helpful to abstract away implementation details, where developers and users can view tracking and analyzing group activities as a service provided.
However, there is a lack of an extensible Cloud-based software architecture in which group activities can be recognized in different domains with various sensor types, and which can provide a service to the participants (trackees) and or service consumers (trackers). Moreover, having a simulator environment to support creating multiple GA scenarios for multiple people (based on real data) would benefit similar projects and facilitate running experiments.
To address these shortcomings, this paper proposes a high-level architecture of a framework called GARSA–aaS (Group Activity Recognition and Situation Analysis-as-a-Service) and discusses all its components with reference to a RESTful API server. Then, we introduce a new notion of GA perspectives which represents what a tracker wants to know about trackees, i.e., the perspective on the trackee activities (i.e., a group activity) of interest to a tracker. Next, for illustration and to demonstrate our approach, a prototype that implements five different scenarios representing various situations that can be tracked in a ’bushwalking’ group activity will be presented.
The contributions of the paper include:
-
proposing GARSAaaS design and its components for GARSA service provisioning, for consumers who are interested in being aware of aspects of group activities which benefits both trackees and trackers;
-
a new notion of consumer GA perspectives; consumers can request the system to provide information with different levels of detail and granularity about the group and the undertaken group activity, balancing with trackees’ privacy concerns;
-
a prototype and proof of concept implementation of the GARSAaaS architecture via extensive bushwalking scenarios;
-
a means to evaluate and test our prototype via building our own online synthetic sensor data generator (based on real data for multiple activities) for multiple users.
2 System overview and modeling
We design an architecture for the proposed framework and how components interact will be described. Also, we provide a model for group activities, based on a compositional view of group activities, that is, where a group activity is viewed as a composition and abstraction of the activities of the individuals in the group.
2.1 System overview
Figure 1 shows the high level architecture design of GARSAaaS.

GARSAaaS High level Architecture
Sensing Layer (Observer Side). The system receives sensor data from various kinds of sensors (e.g., mobile devices, embedded sensors in things, sensors in the environment).
Mobile App Consumer. This component of the system receives raw sensor data from the environment and also uses its own sensor data to recognize the performed activity via local AR (Activity Recognizer). There are two types of (activity/group activity) recognition process: local and cloud. In the local components, the recognition engine is located on the device whereas on the cloud component all the data is sent to the cloud and a cloud-hosted recognition engine executes the task.
RESTful API SERVER (API Calls). The key component of GARSAaaS is a RESTFul API SERVER via which all the RESTful requests/responses to/from the platform are handled.
GA Expert Portal. This component is used by a domain expert to manage and add new group activity models, i.e. to define new GA expressions in the system. The GA Expert is a person who is able to model new GAs by exploiting GroupSense-L and can make sense of data to recognize a new activity. The expert is able to add new individuals and assign them to existing (or new) groups. Creating new situation rules is also part of this component’s task. The rule-based reasoning is the most straightforward and the most used method of reasoning [30]. Recognizing complex activities from primitive events in their life-cycle was used in [24]; we have used a similar technique to infer group activities. In our approach, recognizing lower-level activities (atomic) or higher-level (complex) individual activities are the basis for recognizing group activities. To build new activities, adding new sensors and context information may require defining sensor/context info specifications and linking them to a GA through the RESTful API Server.
Developer Portal. This component is mainly used by software developers to call GroupSense APIs in their products. GA developer may need to work with a GA expert to create new group activity models and include them in their applications.
3rd Party Consumer. In many cases, consumers want to use GARSAaaS to provide services to the target individuals and groups. They register in GARSAaaS and register their interest in groups, GAs and situations which are available. The next section discusses RESTful API Server components and its subcomponents in more detail.
Figure 2 shows the details of the RESTful API Server architecture:
-
Cloud Persistent Data Store: This component stores GroupSense persistent data on the cloud which can be changed over time. Information such as activity models, queries on activities and situations to recognize, and all the used sensors and their specifications.
Fig. 2 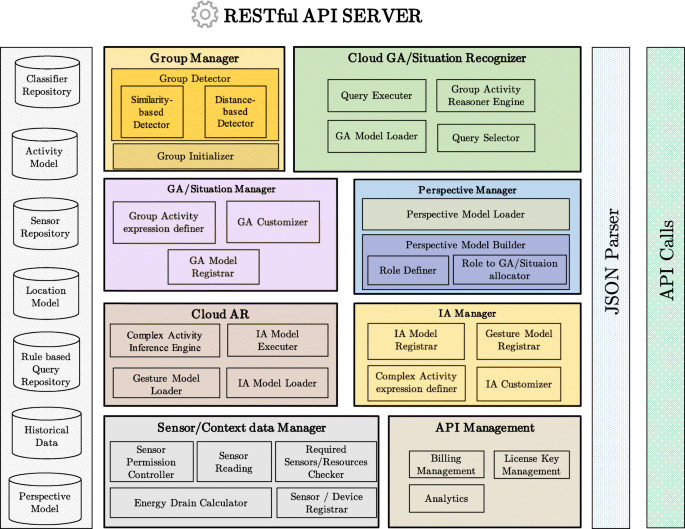
GARSAaaS RESTFul API Architecture Design
-
Sensor/Context Data Manager: Since sensor da-
-ta and context information plays an essential role in any context-aware application, this component manages all the issues related to sensor/context data. The GroupSense framework aims to be used broadly in various domains. Therefore, having one component which can control/manage sources of raw data is important.
-
Sensor Permission Controller: This component controls access to user sensors. Depending on user’s (trackee’s) privacy settings stored in his/her profile, the Sensor Permission Controller grants or denies access to a particular user’s sensor data to be used for activity analysis.
-
Sensor Reading Manager: This component handles readings of raw sensor data at the required sampling, and storing the data as the user’s historical data, as well as does buffering of data and passing data streams to the other components.
-
Required Sensor Checker: In order to recognize any activity or situation, a set of sensor data and context information is required to be available for the GA recognizer component. If the required sensors or context information are not available from the user recognition of certain activities will not be feasible.
-
Energy Drain Calculator: This component is able to calculate estimates of the required energy drain on participant’s devices when used for detecting an activity, individual or group.
-
Sensor/Device Registrar: Any new sensor or context information provider needs to be registered in the framework in order to be able to be used in GroupSense. For example, a GA expert wants to encode a new GA (e.g., eating together activity for group n) using GroupSense-L and he/she intends to use sensor stickers attached to objects in order to detect movements of objects such as spoon and fork; the devices/sensors should be registered to be recognizable in the system.
-
-
Group Manager: contains two sub-components responsible for dealing with groups in the system:
-
Group Initializer: If the group of people who intends to perform a GA is already known and the framework aims to monitor their activities in that group and to recognize if the given GA is taking place or not. Also, within the known group, the system might analyze the data and provide reports and feedback.
-
Group Detector: In some cases, a group is not specified a priori and based on ongoing activities, the system detects that a group of people are in fact acting and behaving as one group.
-
-
Cloud GA Recognizer:
-
GA Model Loader: Each GA has one or more models which describe the GA. This component loads required models from a GA repository to the system and a user’ device. In case a new GA model is built, GA Model Loader loads the new model into the GA recognizer.
-
Query Selector: Based on Location Models and GA Models, this component filters queries for more efficient and accurate results. For example, by considering received sensor and context data, the query selector decides to choose those queries which could possibly be answered positively. If a group (g) is located in a place (p) where ga cannot be performed, this component ignores queries about ga.
-
Query Executor: This component runs the query and sends the results to the Group Activity Reasoner Engine.
-
Group Activity Reasoner Engine: In order to do more complex inference, apart from query results which determine if a certain GA is occurring or not, this component is required to use query results, static knowledge and user historical data to perform more advanced reasoning.
-
-
GA Manager: This component is responsible for managing GAs including: defining a new GA/Situation, customize an existing GA and reusing it; and importing a GA model. There are two types of GA recognition approaches using wearable sensors: (1) Compositional Method - recognizing a GA from composing individuals’ activity, where raw sensor data from each individual is processed separately, and (2) Integrated Method - the GA model is built from all the raw sensor data (without first trying to recognize individual activities, which is not our research focus in this paper).
-
GA Expression Definer: This component handles creating new GA expressions by exploiting existing IA models, available registered devices (which produce sensor data and context information) and known groups.
-
GA Customizer: Since GA expressions can be defined parametrically with different constraints values, in many cases GARSAaaS consumers may want to customize an existing GA model and create a customized version.
-
GA Model Registrar: As mentioned, in case of having a model which can recognize the GA from raw sensor data received from all individuals, the system should be able to import the model dynamically in the system.
-
-
IA Manager:
-
IA Model Registrar: This component registers new individual activity models in the system. For example, if a new model for detecting smoking a cigarette is built, the registrar can import it into the system.
-
Gesture Model Registrar: Similar to an IA Model Registrar, this component registers built models for detecting gestures, such as raising hand, turning right neck or any other gestures which can be used in IA or GA recognition.
-
Complex Activity Expression Definer: The proposed GroupSense-L language can also be used to express complex individual activities which might be composed of some other atomic activities.
-
IA Customizer: Similar to GA recognizer, a user can define IAs by customizing existing IAs.
-
-
Cloud AR: This performs IA recognition on the cloud.
-
IA Model Executor: This sub-component receives the individual sensor data as input, classifying the input using existing models to recognize the undertaken activity. To do this, available IA models and gestures models must first be loaded from the repository.
-
IA Model Loader and Gesture Model Loader: These sub-components loads IA models/Gesture models from the model repository into the GARSAaaS.
-
Complex Activity Inference Engine: We do not only intend to recognize atomic activities and gestures. There are many GAs which are composed of complex individual activities and an engine -which can perform more complex reasoning- is required. The proposed GroupSense-L also can be used to model these type of activities.
-

2.1.1 GroupSense Inter-Component Interactions
In order to understand how the GroupSense components work, this section details one scenario and highlights the role of each module in the system. Lets suppose that a group of friends (g1) go to a restaurant for dinner, and are willing to receive vouchers from nearby restaurants or get a voucher for the same restaurant in a next visit. All the members of g1 already installed the GARSAaaS mobile client application and registered for that particular service (of obtaining group vouchers). In the GARSAaaS client, the Sensing Layer collects required accelerometer raw data from each individuals’ smartwatch. Raw data is analyzed by a Local AR engine. AR (by using an existing pre-loaded trained model on the device) detects if the person is performing an eating activity. The detected activity is sent to the RESTful API SERVER from the individuals. In order to locate the restaurant and other nearby restaurants (stored in the location model in the persistent data layer), user’s location also should be sent to the cloud. By receiving these data, the Cloud GA Recognizer, analyzes the data based on existing GA models and executes the appropriate query which users have already registered for (in this case, group eating vouchers). After GA detection, the API SERVER sends (g1) to the Perspective Manager component. In this example, the current restaurant must know about the exact location of users in order to send appropriate group vouchers for their next visit, whereas the other third party which intends to send nearby restaurant’s coupons do not need to know the exact user locations (due to user’s privacy issue). Hence, the Perspective Manager sends different levels of detailed information to different service providers.
We would like to clarify two matters. Firstly, we are not using rule-based engine for recognizing low level activities such as walking, running or any other gestures (raise hand). We built a classifier which classifies raw sensor data into these kinds of low-level activities. Also, it is not quite a binary classifier; and almost the same approach can be applied to detect atomic activities such as driving, on bus, sleeping, etc. Secondly and more importantly, different loaded classifiers in the framework can be executed concurrently in different threads. Hence, we can detect multiples activities at the same time with different classifiers. We believe that it is a strength of the framework to enable the system to evolve gradually by allowing addition of more group (and individual) activity classifiers and their associated models. By considering the output of a range of classifiers inserted into the framework as well as context information (including spatial and temporal relations), the Rule-Based Group Activity Reasoner Engine can infer the undertaken group activity. We also note that we can infer the pace of group activities and other properties.
2.2 Group activity modeling language (GroupSense-L)
In our approach to group activity recognition and understanding, a Group Activity (GA) is first described in GroupSense-L, (EBNF below) which enables a precise description of the GA so that algorithms for its recognition and analysis can be programmed more easily.
In the above, Participants denotes GA participants, which can be people or objects. GA_Name is the label of a GA or name of situation. In practice, each GA can be carried out in various ways and have different GA characteristics. Different people have different habits and it affects the way physical activities are carried out, called GA characteristics. Logical Temporal Relationship Activity (LTRA) denotes statements which describes performed activities by the individuals or group, considering their logical/temporal relationships, e.g.:
"((i1,i2,i3⋈walking) (b,15s,25s) ((i1,i2¬ walking))" describes a situation where i1,i2,i3 perform (“perform” denoted by ⋈) walking activities between 15s and 25sbefore (denoted by b) i1 and i2 are not (¬) walking.
Context Condition (CC) produces conditions on context information, e.g.:
"((i1,location="kitchen")∧((i2,i3),distance>10m))"
simply defines location of i1 in kitchen and (∧) distance between i2 and i3 must be greater than 10m. Distance and location are context information in this example. Logical and Temporal relationships are applied on context conditions. Required Hardware (RH) indicates devices and hardware which are required to detect a group activity. RequiredMinMaxDuration (RMMD) indicates the minimum or maximum required time for performing a group activity. Similarly, RMMP indicates the number of required participants for a group activity The complete version of GroupSense-L is availableFootnote 1.
In addition, GroupSense-L can be used to represent specific situations in context-aware applications. In some cases, the recognition of a performed GA is not an aim. Instead, given a known GA, we may need to know if certain situations about the GA is taking place or not. For example, in being in a conference group activity, in order to invoke a service such as muting speaker’s mobile phone, we may need to know who is giving a talk. Another example can be sending notifications to the employer of group of workers if any of them does not work efficiently. Other scenarios are given later.
2.3 Perspective model
Each GA consumer (tracker) might be interested to access information about a GA at different abstraction levels of the GA. Also, in order to protect the privacy of users (trackees) and provide services to trackees without invading his/her privacy, we introduce the notion of perspectives.
For example, in a bushwalking group activity, leader is one role who should know about the trajectory information of bush walkers and their heart rate in case of emergency, while park rangers only need to know if there are groups of bush walkers around their zone and their location. Providing different information for different consumer’s perspectives increases the flexibility of the system and helps protect user’s privacy. GA consumers can request for different perspectives and they are charged based on the abstraction level of GA information - only if trackees grant permission to access them. To implement the perspective model, a set of activity (GA/IA) attributes is defined for each activity to determine required resources to be recognized; selected attributes forms that perspective.
Each activity attribute is associated with resources (sensor or context information). Formally, a perspective is a tuple of the form:
As an example, bushwalking attributes can be location, trajectory data, heart rate, users closeness and total distance travelled so far. Each attribute is associated with sensor/context information. The leader may need to have access to all those information while a bush ranger (adopting a different perspective) only needs to know about the location of groups.
Similar to any other services/application there are terms and conditions which require users to share their data with the system. When a trackee joins certain groups in order to participate in certain GA (i.e., collaborative), s/he can also give permission to share his/her information relating to the GA; this could be in exchange for using a service. We have categorized GA into collaborative and non-collaborative. In collaborative mode, each individual’s activity affects the entire group activity, and inversely.
3 Cloud-based prototype implementation
The cloud version of GroupSense was implemented using the Google App Engine (GAE)Footnote 2. Figure 3 shows the high level architecture of Cloud-based GroupSense. In this version of the GroupSense prototype, though the implementation techniques to connect an Android device to the Cloud are different, the overall structure of GroupSense is quite similar to the localized version presented in our previous work [2]. The individuals’ activities detected by Android endpoints (or observer devices) are sent to the Google DatastoreFootnote 3.
3.1 GroupSense android client endpoint
The Android client endpoint in GroupSense is an Android application which contains all the required classes and methods to access sensor readings and execute classifiers to recognize individual’s activities on the device (similar to localized version). In addition, an Android client should invoke the implemented methods on the server endpoint. Each method on the backend server recognizes a GA. Listing 1Footnote 4 shows how an Android client endpoint in GroupSense invokes a GARecognizer from the server endpoint.
Listing 2Footnote 5 shows how individual’s activities and their context information (in this example ‘direction’ of user, measured in degrees) are stored to recognize ‘*-Together group activities’ (where ‘*’ is a wild-card which could mean ‘walking’,‘running’ etc). Every individual (mobile device) has a unique ID which relates them to other entities such as context entity or group entity. In this figure, as a simplification, we store the direction in the same entity. When there is more context information, this should be stored in a context entity (Fig. 4).

Saving Activity of Individual in Datastore
3.2 Google server endpoint
As previously mentioned, we used the Google App Engine to store the individuals’ activities into Datastore and execute the group recognition on the Cloud. Listing 3Footnote 6 shows the implementation of the ‘*-Together Activity’ on the Google Cloud as a RESTful service. This Listing retrieves the last 10 seconds of sent messages (detected individuals’ activities) from the Datastore using the Google Query Language (GQL)Footnote 7. GQL uses an SQL-like language which is executed over Google-based data entities such as GDS. It finds individuals who are performing the same activity within the preset window size (10s in this example) and also moving (either walking, cycling, running or jogging) in approximately the same direction (within 40° difference). If there is any detected group activity, it is saved in Datastore. Figure 5 shows a snapshot of the saved detected GA from Datastore.

Saving a Detected Group Activity in Datastore - an example
3.3 GroupSense entities data model
From an Object Oriented Programming (OOP) perspective, we define the following data model (entity) which we can send/receive data to/from a web service (See Fig. 6).

Data Model in GroupSense
ACTIVITY_DM contains properties to present an activity, and activityName, startTime and endTime are examples of these properties. Each activity is performed by an individual, and INDIVIDUAL_DM represents properties (such as firstName, lastName and group membership) of that individual. Also, individual carries a device (such as smartphone) and each device has sensors. DEVICE_DM can produce context data. GROUP_DM stores group information such as groupName, members, startTime and endTime of performed group activity (GROUP_ACTIVITY_DM).
3.4 Android wear interaction with GroupSense
GroupSense integrates mobile phone sensors with Android wearablesFootnote 8 (particularly a smartwatch). As can be seen in Fig. 7, one Android package, GroupSenseWatch.apk, needs to be deployed on the watch and another APK (GroupSenseMobile.apk) on the smart phone which is already paired with the watch. The Android Wear SDK on the phone handles connection between these two through Google Play ServiceFootnote 9. Google Data APIFootnote 10 and MessageAPIFootnote 11 were used to send and receive messages via Bluetooth. Figure 8 shows the sequence of invoking the implemented methods which enables message exchange (such as sensor data) between the smartwatch and smartphone. The DataApi.DataListener, MessageApi.MessageListener and ConnectionCallbacks interfaces must be implemented for this purpose. The initGoogleApiClient() method on both devices handles the connection to the Google Data API and Google Message API. When the devices are connected, listeners for these APIs are added via the onConnected() method. Next, the onSensorChanged() method is activated on the watch (providing the sensor listeners have already been registered); and sends the raw sensor data to the mobile device via sendSensorData(). On the smartphone end, onDataChanged() is invoked when any messages are received from the smartwatch. Finally, the received data is either sent to the classifier for online classification, or is saved in a file as CSV format in case of offline processing. The complete implementation of these methods are available at hereFootnote 12.
3.5 GroupSense data-flow
As can be seen in Fig. 9, there are two main components: (1) GA Rule-Based Reasoner which can be considered to be the key engine of GroupSense and contains all the defined rules for each GA in a separate thread, and (2) Classifier Repository which can execute all the trained models (to detect individual’s activities) concurrently.

Data Flow in GroupSense
The Group Activity Tracker sends a/multiple request/s to the GA thread Pool to obtain information about whether a GA is taking place or not. Each GA Recognizer (GAiRecognizer) (which is a separate Java thread) can activate one or more Activity Recognizer (AiRecognizer) threads depending on how many activities constitute that GA. Moreover, the context information required to recognize that GA is requested. From each individual’s end, the stream of sensor data, plus context data is continuously produced and will be used as input to the classifiers. Finally, all the analysed data from individuals as well as the context data will be sent back to the Rule-based GA reasoner, and the recognition process is completed.
4 Simulation-based proof-of-concept scenario: Bushwalking Recognition as a Service
In order to evaluate and illustrate our compositional group activity recognition and analysis approach, i.e., we reason with group activities from recognizing individual group activities, and to illustrate GARSAaaS, a bushwalking group activity is modeled, analyzed and recognized via our system. This section illustrates the scenario, used technologies, modeling and proof-of-concept experiments.
The aim of implementing this scenario is (1) to show the feasibility of GroupSense-L for representing and enabling detection of specifically represented situations, and (2) illustrating GARSA services both for the leader and bush walkers. GARSA services provided to the leader shown here are: determining the difficulty of the program, monitoring bush-walkers for abnormal health detection, and providing advice for bush-walkers. On the bush-walker side, they receive health advice from the leader. Also, they will be able to automatically get help in abnormal situations from the leader. As mentioned in Section 2.2, we do not always aim to recognize a GA, and here, being in bushwalking GA is already known but recognition of specific situations within the bushwalking group activity is the purpose of this experiment. Mostly, each situation/event triggers one service/action.
4.1 Used technologies.
Android SDK 24 was used for our implementation, and Android Wear SDK 21 used to exploit smartwatch sensors in our experiments. Google Cloud Endpoint is used as back-end server which is highly compatible with Goo-gle Android. The Apache commons Mathematics Java libraryFootnote 13 was used for feature extraction. We used the WEKA (Waikato Environment for Knowledge Analysis) data mining packageFootnote 14 to build a classifier for individual activities; in particular J48 which is a Java implementation of the C4.5 algorithm [31].
4.2 Sensor data generation for testing
In order to run our scenario and test on a larger scale while doing so in a realistic manner, a sensor data simulator called GroupSense-Sim was built to generate the required sensor data using seeding based on real data which was collected from a small group of users beforehand. The simulator is able to generate accelerometer data for given atomic activities (such as walking, running, standing, cycling and jogging) from two sources: smartphone and smartwatch. Figure 10 shows the architecture of GroupSense-Sim and its base components. Sensor data repository contains raw sensor data for different activities, and scenario initializer can define different individual activity scenarios. For instance, we can generate accelerometer raw data for person p1 who is playing table tennis at a normal pace by giving the start time and end time as parameters. Also, we can generate sensor data related to the walking activity for another person, p2 (Listing 1). Data loader retrieves the base sensor data from the sensor data repository when it is required. Raw sensor data random generator is responsible for randomly generating sensor data from the base data in the sensor data repository. Generator configuration sets all the configuration values for generating sensor data such as the frequency of generating raw data, and the required idle time for the used Java threads.

Sensor Data Generator Diagram

Also, to generate data to simulate a large group bushwalking scenario, generating barometer data, GPS data, and heart rate data is necessary. The simulator can generate random coordinates for individuals with a given starting point and a route path over a specified period time for a given activity. For example, by defining an expression and passing arguments: activity (for instance walking), start time, end time, route path and individual/group, the simulator generates GPS data. Heart rate data also is generated based on age [19]. Similarly, depending on how the scenario is intended to be simulated, relevant barometer data is generated which reflects the user’s elevation (correlated with altitude changes). In a nutshell, we can run various scenarios by defining user/group behavior and GroupSense-Sim generates all the raw sensor/context data through separate Java threads. Each thread belongs to one individual and all the created threads for each sensor/context are handled by ’threads runner’ which received all the threads and manages them. We also evaluated our data generator by comparing collected real data and simulated generated data. For example, Fig. 11 shows how our collected data and simulated data are similar, and Fig. 12 shows generated barometer and simulated data. Of course, the generated data cannot be merely a copy of the collected real data, and hence, our simulation aims to generate realistic data which are sufficiently different (can represent additional simulated members of a group, for instance, that add to real members). Figure 13 shows the trajectories of simulated and real walkers (green and blue).

Comparison of collected accelerometer data and generated simulated data for walking activity. a Collected Data. b Simulated Data

Generated Barometer Data vs Real collected Data

Generated GPS coordinates of individuals for a defined path. a Bushwalkers’ Trajectory. b Closer View of Trajectory
Listing 2 creating a GPS model to generate coordinates for a walking activity from a starting point (lines 2-3) and an end point (initLoc) for a given period of time using GroupSense-Sim.

The implementationo of GroupSense-Sim is availableFootnote 15.
4.3 Situation 1. Lagging behind in a group
4.3.1 Aim and scenario
Assuring that bushwalkers do not get lost is the leader’s responsibility. Typically, there are two leaders, one at the back and one in front of a group who help others navigate. Also, in larger groups more leaders might be required. The proposed system can reduce the number of leaders to one leader by helping the leader track the group. By sending bushwalker’s location data (even their direction) to the leader, the system can continually monitor the person and send notifications in case of someone lagging behind to prevent them from getting lost (Of course, not just a leader, but bush-walkers themselves can track their own positions relative to the group or the leader).
4.3.2 Modeling
Lagging behind is simply defined when a person’s distance is more than a threshold relative to the leader. This situation only requires each individual’s position. Practically the threshold can be set by the leader for each event. Let’s assume the maximum distance between the leader and any of bushwalker must not be more than 150m. Then, we have:
Due to GPS inaccuracy as wells high possibility of the distance threshold between individuals and leader being exceeded momentarily, the above model could raise many false alarms for the leader. Therefore, the system should ensure that the person is really lagging behind from the group.
Required Min Max Duration (RMMD) denotes that to recognize this situation at least 60s of user data (in this case user coordination data) is required. Checking Condition Interval Time (CCIT) represents how often the condition must be checked within 60s. Number of Satisfied Condition (NSC) shows if the satisfied rules are persistent.
4.3.3 Experimentation
To evaluate the model for this situation, two sets of data were generated: 1) First, data set was generated for a group of 10 so that one individual lagged behind 4 times in 60 min but, for two times, reached the group in less than 60 s. 2) Second data set is generated for a group of 20 in 3 h and two individuals lagged behind 10 times in our designed scenario. The situation engine could detect all occurred laggings in the first scenario and 8 (out 10) in the second data set.
4.4 Situation 2. Heart rate abnormality
4.4.1 Aim and scenario
Health concern is one of the main concerns in hiking events and heart rate can be a factor to determine the general health of a person. By monitoring the heart rate received from individuals and considering his/her physical activity by a person in a group (who is taking care of the bushwalker’s health) we can detect abnormal health situations of participating bushwalkers.
4.4.2 Modeling
Heart Rate (HR) abnormality is defined in GroupSense-L as follows:
In the above expression, normal HR values are estimated based on age. There are some other factors which affects HR such as gender, physical fitness which were not considered in this work.
4.4.3 Experimentation
In this scenario, experiments were carried out three times. We started simulating the scenario (based on real pre-collected data) with 5 users who are performing bushwalking for 30 min. 5 abnormal situations were then created in our simulated scenario and the situation recognition engine could detect 4 of them. A second experiment simulated 60 min of bushwalking with 15 people and 10 abnormal HR situations. Finally, the third one simulated two hours of bushwalking for 25 people and 15 abnormal HR situations. The detection engine detected 8 (out of 10) and 12 (out of 15) respectively. Incorrectly recognized cases were due to inaccuracy in detecting the physical activity of walking/standing.
4.5 Situation 3. Walking group deviating far from an expected route
4.5.1 Aim and scenario
This scenario intends to detect the situation when a bushwalking group (g) has deviated far from an expected route r. This situation can be applied to any other groups which should move from the starting point to the end point through certain way points, such as tourist groups and visitor groups. To check whether a group is on the right direction and close to the route, the centroid of the group, C(g) is calculated (based on GPS coordinates of the participants) and its distance from the path should not be more than a certain threshold value.
4.5.2 Modeling
As mentioned, the centroid point of the group should be near to a known path. The defined route has a set of way points and the centroid of the group, at any time, should be close to one of the way points. Otherwise, we can infer that the group is deviating from the expected path and the group gets a notification for this situation, which is expressed as follows:
4.5.3 Experimentation
Experiments were conducted with 5 simulated bushwalkers (cross symbols in Fig. 14). A 10 km route was defined by generating way points every 50 m (200 coordinates, denoted by small circle symbols). The moving pattern of this group was defined with the simulator in such a way to make sure one or two walkers do not walk closely (which happens in practice from observing real collected data of a small group). We assumed that all walkers have the same speed (5 km/h). The situation recognition engine is executed every 60 s (120 times in total). In each execution, the engine computes the centroid of the group and also calculates the distance between the centroid and all way points. The shortest distance should be less than the defined value in the expressed condition. Initially this value was set to 15 m but, in a number of situations, this was found to be more than expected. The group can easily pass the 15 m threshold. Hence, this value is not appropriate in cases when one or multiple walkers go/es relatively so close to the other members of the group. In a second run, this value was changed to 25 m and often, the group was detected as “deviating from the route”. Thus, the centroid being near to a way point on the path may be indicative but does not always mean that the entire group is actually is close to the expected path since the distribution of members, even if far from the route, might produce a close centroid. The next ’situation’ intends to model and measure the spread of the group.

Moving centroid of moving group, compared with the expected route
4.6 Situation 4. Determining the spread of the group.
4.6.1 Aim and scenario
Suppose a leader of a large group of bushwalkers wants to ascertain if the entire group is walking on track and individuals are not very spread out but keeping close together in the group. Also, as it was mentioned in Section 4.5, the centroid of group is not a precise indicator if the group is on track or not, especially for large spread out groups. We can use the diameter of a group to provide an indication of how spread out the group is. Also, in case of an emergency such as a bushfire, if the group is less spread out, rangers or rescue teams would be able to handle the situation more easily.
4.6.2 Modeling
A group being too spread out is represented in GroupSense-L as follows.
4.6.3 Experimentation
In order to measure the spread of the group, firstly, we compute the convex hull of the set of points of the group (i.e., the set of GPS coordinates of the group members) g′. To do that, the Graham Scan algorithmFootnote 16 is used to find the boundary point set. Then the maximum distance between any of pair of points in g′ is calculated. The maximum distance represents the spread of the group. To evaluate our model, a new scenario was built by defining a group of 15 who are walking and getting close to and far from each other randomly for 30 minutes using our simulator. Every 60 s, the last 15 s of users’ location data is retrieved and our models executed and the detection algorithm ran over the users’ coordinates. The value d (distance threshold expressed in the model) is set to 30 m. In the simulated scenario, the frequency of generating location data for users is set before building the scenario and there is no unexpected delay. Hence, the algorithm detects the situation with very high accuracy. However, in the actual devices, GPS data might have a few seconds lag time and also GPS inaccuracies may affect the accuracy of the spread recognition.
4.7 Situation 5. Determining level of difficulty of a walk.
4.7.1 Aim and scenario
There are hiking routes whose Difficulty Level (DL) has not been verified yet by others. Normally, to measure DL, hiking leaders go to the mentioned paths and they should manually calculate a few parameters which contribute to estimating the difficulty level of the pathFootnote 17Footnote 18Footnote 19. As one of the offered services of GARSAaaS, one can automate this process of estimating the DL of an unknown route by analyzing incoming sensor data from mobile devices.
4.7.2 Modeling
In order to model the difficulty of a bushwalking program, first, potential contributing factors are specified, such as:
-
Path Gradient Changes (PGC). PGC is elevation gain/loss (path up and down) during the path.
-
Max Gradient (MG). MG is maximum path gradient.
-
Total Distance (TD). TD is total travelled distance from starting point to end point of route.
-
Distance per hour (DPH). DPH is travelled distance (km) in one hour.
Table 1 shows typical boundary values of the mentioned parameters. The difficulty of Grade 3 can be modeled in GroupSense-L as follows:
4.7.3 Experimentation
To be able to study the above-mentioned factors and conduct our experiments, GPS coordinates were used to calculate distances, the step detector sensor was used to measure travelled distance more accurately, and barometer sensor was used for height measurement. The barometer sensor data indicates atmospheric pressure and we can map atmospheric pressure to an elevation value. To do this, barometer data from four smartphones were collected via 4 participants in one hour of normal walking in a placeFootnote 20 with hills (up and downs) which shows barometer changes more clearly. Every 10 s, the elevation of participants were also captured by use of Google’s elevation APIFootnote 21 and the MapQuest APIFootnote 22. Since each device has different barometer sensor chips, they capture different values for exactly the same location. However their fluctuations are the same and we can have an acceptable indication of location altitude. As the number of collected barometer data (5 in every second) and altitude (every 10 s) are not equal, these two data sets should be integrated via timestamps. Finally, a Matlab curve fitting function was used (Fig. 15) to find the best altitude function (f(x)) which returns the elevation value given pressure values:

Barometer vs Altitude - line fitting
Barometer values might be affected by weather and can affect the mapped height value. But still it can be used for the purposes of calculating ’Path Gradient Changes’, since we intend to measure gradient changes not exact elevation. TD measures the total traveled distance based on GPS coordinates. Every 60 s the distance is calculated from two points (begin to end) and by summation of these values for the whole path, we can have a fairly good measurement of total distance. The same approach is used for measuring DPH. Every 15 min distance per hour is calculated. Using the step detector provides more accurate results in comparison to GPS latitudes and longitude. We have assumed that the person (usually an experienced person in bushwalking) follows the path without random movements which can affect the TD and DPH so that using step detector does not change the accuracy significantly. In order to measure PGC, every 10 seconds, we obtain the traveled gradient from point x1 to x2 (x2−x1≈10 m). Then, gradient between two points a and b is calculated as follows:
While we do not deal with energy issues in this paper, we also note that energy consumption and battery drain issues in mobile devices especially in sensor driven applications are critical [28] - we evaluated GroupSense power consumption and concluded that it is feasible to use the proposed framework in real world scenarios, as shown in [2].
4.8 Errors
In our simulations, we simulated sensor data based on pre-collected real data. Hence, the generated data includes noisy data caused by sudden movement, or incorrect position of sensors. In the current implementation we have not considered other source of errors such as connection lost, network delay or data processing delay.
5 Related work
Apart from Activity Recognition, various terms such as situation recognition, task identification, activity-aware computing have been used interchangeably in different research publications. An activity implies performing a certain action with the body or parts of body. There are different techniques and approaches for detecting performed activities by individuals. Abkenar et al. [1] divided the approach of recognizing AR in two: 1. Machine learning (in which there exist two learning approaches namely supervised and unsupervised learning) and 2. Knowledge-Driven. The first approach, also called Data-Driven techniques are based on statistical and probabilistic reasoning and the second one, also called specification-based techniques, is based on logical modeling and reasoning algorithms [8]. Group activity recognition in context-aware computing is a process of detecting or inferring of members’ collective activity who are performing the same activity or collaborating and interacting to achieve a particular and more complex goal. A number of studies have been conducted in this area which can be categorized into two main categories: 1) vision-based [10] and 2) sensor-based [18]. Inherently, working with sensor data, especially mobile device sensor data, is very challenging. Accelerometer values are extremely sensitive to position and produce noisy data. In order to recognized more complex events, more sensors are required which leads to higher uncertainty of recognition. To handle the uncertainty problem, there are techniques based on automata, probabilistic graphical models, and first order logic [5]. The sensor-based approach has been used in many human activity recognition work in a wide-range of domains. Taking advantage of wearable sensors (smartphones as the most available and non-obtrusive embedded sensing device) in GAR seems to be a necessity. Another major advantage of mobile sensing results from the fact that the sensors are embedded into practically all contemporary mobile phones and provide rich information about a user, her/his undertaken activity and context. Gordon, et al. [13] defined MAR (Multi-User Activity Recognition) and differentiated it from GAR. While GAR intends to recognize an activity within a group as an entity, MAR aims to obtain multiple users’ activity done in parallel. Also, they proposed a distributed architecture using coffee cups, each of which is equipped with sensors such as accelerometer to detect whether individuals are drinking together or not.
In [6], a framework for continuous group activity recognition using mobile devices was proposed and we conducted experiments to test the feasibility of our proposed solution by focusing on power consumption aspects. We added more semantics to our model to handle more complex reasoning. A more sophisticated abductive reasoning can be performed by background theory of rules as in [4]. In [3] is introduced a new notion of GA perspectives which represents what a tracker wants to know about trackees (i.e., the perspective on the trackee activities). An incentive billing model for the proposed framework also presented in this work. Building on and different from previous work, this paper highlights the notion of group activity recognition as a service notion, and outlines in detail architectural elements as a reference for implementing GARSAaaS, i.e., we outlined the GARSAaaS platform, illustrated via scenarios.
Exploiting a cloud platform as infrastructure for sensor-driven applications which perform online and offline human monitoring applications has been explored in [25, 26, 29] - integrating cloud technologies would add significant benefits into group monitoring where combining multiple individuals’ sensor data and context information is essential.
Although employing the cloud in analyzing sensor data brings advantages, it poses challenges such as massive scaling up and real time processing, large-scale distribution and data stream management [16]. Gravina et al. [16] recently proposed a Cloud-based Activity-aaService cyber–physical framework for human physical activity monitoring. They conducted their experiments for energy expenditure, fall detection, step-counter and a few atomic physical activities (walking, standing, sitting and lying) in stand-alone and community scale versions. However, their community-scale level does not mean group activity. They perform individual activity recognition for large scale incoming sensor data.
In terms of comparing with the state of the art, it is difficult to provide a fair quantitative comparison (such as classification accuracy or algorithm performance) given that there is no widely accepted benchmark in the area of sensor-based group activity recognition. Most of the studies simulated their experiments and executed their proposed algorithms offline, e.g., [7, 15, 27, 35], in which, challenges such as the inaccuracy caused by communication delay has been disregarded. Also, having domain-dependent parameters can influence results, such as window size variations. Therefore, in order to propose a generic GAR framework, our approach aims to accommodate different group activity models making the framework more robust.
Table 2 summarizes comparison of sensor-based group activity recognition studies based on parameters such as ‘extensible approach’, ‘provide service’, ‘support group perspective’ and ‘simulation-based testing’; ‘extensible approach’ means if a work uses a generic approach for GAR, ‘provide service’ denotes if that study has considered providing GAR as a Service or not; and ‘simulation-based testing’ indicates if each project is able to test their solution using a simulator in different scenarios. As can be seen in this Table, almost all work did not consider all these parameters. Hence, GARSAaaS is intended as a platform to recognize various activities in different domains (and can offer services accordingly) provided GARSAaaS has been customized with the relevant group activity models and equipped with required sensors. Also, GroupSense-Sim as an addition to the proposed framework, adds the capability of simulating group activities based on real data to evaluate recognition of them in different situations. According to our review, none of the studied work have exactly the same features as GARSAaaS.
6 Conclusion
We have proposed and implemented a prototype GARSAaaS platform, and evaluated and demonstrated GARSAaaS (Group Activity Recognition and Situation Analysis as a Service), a framework for continuous GAR using embedded sensors in mobile devices which provides recognition of GA or situation as services for clients. For demonstration and evaluation, a range of situations in the context of the bushwalking group activity have been modeled and implemented through our sensor data generator. This sensor data and context data generator is able to generate required data (from the real collected data) for multiple users to be used any the GAR research area. The GARSAaaS is capable of providing information from groups at different levels of abstraction for the consumers by using GA perspectives. Many other types of group activities, such as exercising together with an instructor, tour groups in general, road-users and traffic group situations, as well as sports and safety applications can utilise GARSAaaS.
In future work, we aim to automate generating programming code from GroupSense-L expressions. Additionally, by expanding the current design, more extensive Group Activity Recognition as a Service (GARSAaaS) will be implemented. More precise cost modelling is needed such as a GA weighing mechanism which measures the complexity of a GA, and accordingly, its effect on costs. Dealing with uncertainty and adding it to our model would be another open issue in GARSAaaS.
Notes
https://cloud.google.com/datastore/
Fig. 3 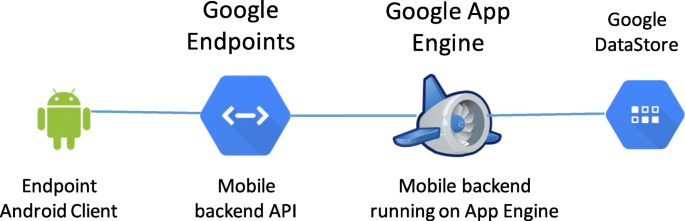
Cloud–Based Design of GroupSense
https://developers.google.com/android/guides/overview
Fig. 7 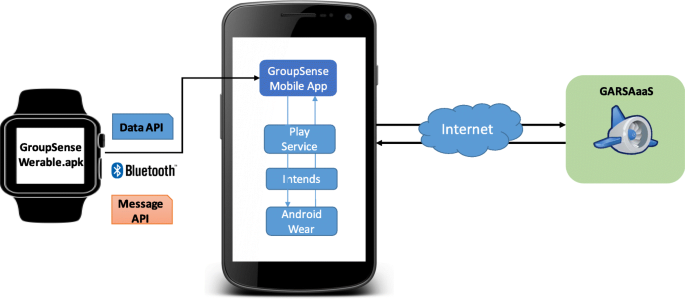
Android Wear Interaction with GroupSense
Fig. 8 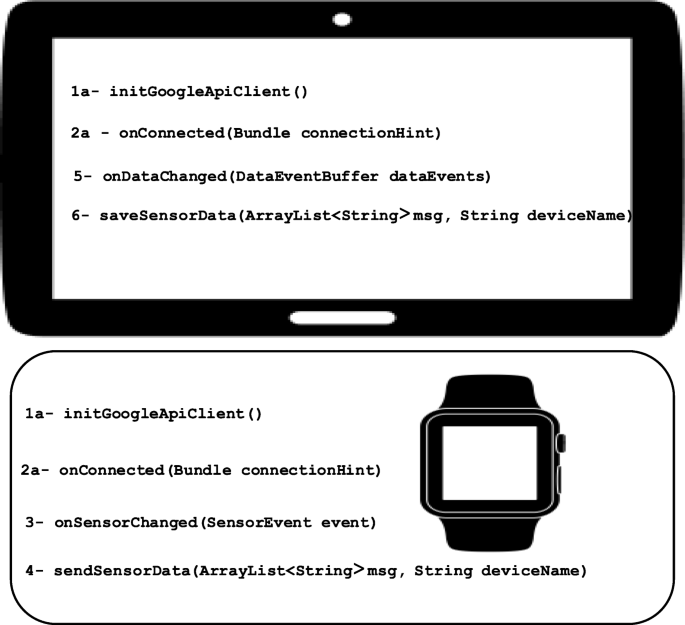
Required Methods to Send and Receive Sensor Data in GroupSense


References
Abkenar A, Loke SW. Myactivity: Cloud-hosted continuous activity recognition using ontology-based stream reasoning. In: 2014 2nd IEEE International Conference on Mobile Cloud Computing, Services, and Engineering: 2014. p. 117–126.
Abkenar AB, Loke SW, Rahayu W, Zaslavsky A. Energy considerations for continuous group activity recognition using mobile devices: The case of groupsense. In: 2016 IEEE 30th International Conference on Advanced Information Networking and Applications (AINA). Crans-Montana: IEEE: 2016. p. 479–486.
Abkenar AB, Loke SW, Zaslavsky. Iot-enabled group activity recognition services using a modelling language approach. In: Proceeding of the 3rd International Conference On Internet of Things: Smart Innovation and Usages (IoT-SIU 2018). Bhimtal: IEEE: 2018.
Abkenar AB, Loke SW, Zaslavsky A, Zheng JX. A service-oriented framework for group activity safety. In: Proceeding of the 14th EAI International Conference on Mobile and Ubiquitous Systems Workshop (IoCAT Workshop). Melbourne: IEEE: 2017.
Alevizos E, Skarlatidis A, Artikis A, Paliouras G. Probabilistic complex event recognition: A survey. ACM Comput Surv. 2017; 50(5):71:1–:31.
Bakhshandehabkenar A, Loke SW, Rahayu W, Zaslavasky A. A framework for continuous group activity recognition using mobile devices: Concept and experimentation. In: 2014 IEEE 15th International Conference on Mobile Data Management, vol. 2. Brisbane: IEEE: 2014. p. 23–26.
Bourbia AL, Son H, Shin B, Kim T, Lee D, Hyun SJ. Temporal dependency rule learning based group activity recognition in smart spaces. In: 2016 IEEE 40th Annual Computer Software and Applications Conference (COMPSAC), vol. 1: 2016. p. 658–663.
Chen L, Nugent C. Ontology-based activity recognition in intelligent pervasive environments. Int J Web Inf Syst. 2009; 5(4):410–30.
Davari M, Amintoosi H. A survey on participant recruitment in crowdsensing systems. In: 2016 6th International Conference on Computer and Knowledge Engineering (ICCKE). Mashhad: IEEE: 2016. p. 286–291.
Deng Z, Vahdat A, Hu H, Mori G. Structure inference machines: Recurrent neural networks for analyzing relations in group activity recognition. In: The IEEE Conference on Computer Vision and Pattern Recognition (CVPR). San Francisco: 2016. p. 4772–4781.
Do TMT, Gatica-Perez D. Groupus: Smartphone proximity data and human interaction type mining. In: Wearable Computers (ISWC), 2011 15th Annual International Symposium on. San Francisco: IEEE: 2011. p. 21–28.
Ganti RK, Ye F, Lei H. Mobile crowdsensing: current state and future challenges. IEEE Commun Mag. 2011; 49(11):32–9.
Gordon D, Hanne J-H, Berchtold M, Shirehjini AAN, Beigl M. Towards collaborative group activity recognition using mobile devices. Mob Netw Appl. 2013; 18(3):326–40.
Gordon D, Scholz M, Beigl M. Group activity recognition using belief propagation for wearable devices. In: Proceedings of the 2014 ACM International Symposium on Wearable Computers, ISWC ’14. New York: ACM: 2014. p. 3–10.
Gordon D, Wirz M, Roggen D, Tröster G, Beigl M. Group affiliation detection using model divergence for wearable devices. In: Proceedings of the 2014 ACM International Symposium on Wearable Computers, ISWC ’14. New York: ACM: 2014. p. 19–26.
Gravina R, Ma C, Pace P, Aloi G, Russo W, Li W, Fortino G. Cloud-based activity-aaservice cyber–physical framework for human activity monitoring in mobility. Futur Gener Comput Syst. 2017; 75:158–71.
Guo B, He H, Yu Z, Zhang D, Zhou X. Groupme: Supporting group formation with mobile sensing and social graph mining. In: International Conference on Mobile and Ubiquitous Systems: Computing, Networking, and Services. Beijing: Springer: 2012. p. 200–211. December 12-14.
Guo B, Yu Z, Chen L, Zhou X, Ma X. Mobigroup: Enabling lifecycle support to social activity organization and suggestion with mobile crowd sensing. IEEE Trans Hum-Mach Syst. 2016; 46(3):390–402.
Heart.org. Target Heart Rates. 2016. Accessed 05 June 2017.
Hsu JY-J, Lian C-C, Jih W-R. Probabilistic models for concurrent chatting activity recognition. ACM Trans Intell Syst Technol (TIST). 2011; 2(1):4.
Hung H, Englebienne G, Kools J. Classifying social actions with a single accelerometer. In: Proceedings of the 2013 ACM international joint conference on Pervasive and ubiquitous computing. Zurich: ACM: 2013. p. 207–210. September 08-12, 2013.
Jaimes LG, Vergara-Laurens IJ, Raij A. A survey of incentive techniques for mobile crowd sensing. IEEE Internet Things J. 2015; 2(5):370–80.
Jayarajah K, Lee Y, Misra A, Balan RK. Need accurate user behaviour?: Pay attention to groups! In: Proceedings of the 2015 ACM International Joint Conference on Pervasive and Ubiquitous Computing, UbiComp ’15. New York: ACM: 2015. p. 855–866.
Kafalı Ö, Romero AE, Stathis K. Agent-oriented activity recognition in the event calculus: An application for diabetic patients. Comput Intell. 2017; 33(4):899–925.
Kahol K. Integrative gaming: a framework for sustainable game-based diabetes management. J Diabetes Sci Technol. 2011; 5(2):293–300.
Lounis A, Hadjidj A, Bouabdallah A, Challal Y. Secure and scalable cloud-based architecture for e-health wireless sensor networks. In: Computer communications and networks (ICCCN), 2012 21st international conference on. IEEE: 2012. p. 1–7.
Lu C-H, Chiang Y-T. Interaction-feature enhanced multiuser model learning for a home environment using ambient sensors. Int J Intell Syst. 2014; 29(11):1015–46.
Mukhopadhyay SC. Wearable sensors for human activity monitoring: A review. IEEE Sensors J. 2015; 15(3):1321–30.
Pandey S, Voorsluys W, Niu S, Khandoker A, Buyya R. An autonomic cloud environment for hosting ecg data analysis services. Futur Gener Comput Syst. 2012; 28(1):147–54.
Perera C, Zaslavsky A, Christen P, Georgakopoulos D. Context aware computing for the internet of things: A survey. IEEE Commun Surv Tutorials. 2014; 16(1):414–54.
Quinlan JR. C4. 5: programs for machine learning.Elsevier Science; 2014. https://books.google.com/books?id=b3ujBQAAQBAJ.
Singla G, Cook DJ, Schmitter-Edgecombe M. Recognizing independent and joint activities among multiple residents in smart environments. J Ambient Intell Humanized Comput. 2010; 1(1):57–63.
Szczerbak MK, Toutain F, Bouabdallah A, Bonnin J-M. Kramer: New social medium based on collaborative recognition of important situations. Comput J. 2013; 57(9):1296–317.
Yiengprugsawan V, Banwell C, Takeda W, Dixon J, Seubsman S-a, Sleigh AC. Health, happiness and eating together: what can a large thai cohort study tell us?Global J Health Sci. 2015; 7(4):270.
Yu N, Zhao Y, Han Q, Zhu W, Wu H. Identification of partitions in a homogeneous activity group using mobile devices. Mob Inf Syst. 2016; 2016:1–14.
Zhang Y, Chen M, Mao S, Hu L, Leung V. Cap: Community activity prediction based on big data analysis. IEEE Netw. 2014; 28(4):52–7.
Acknowledgments
Part of this work has been carried out in the scope of the project bIoTope which is co-funded by the European Commission under Horizon-2020 program, contract number H2020-ICT-2015/ 688203 – bIoTope.
Funding
This work financialy supported by La Trobe and Deakin Universities. Authors also thank Data61 of CSIRO.
Availability of data and materials
Author information
Authors and Affiliations
Contributions
The first author co-design, implemented and built the software, and is the main author of the paper. The co-authors supervised and helped co-design the framework, discussed ideas and helped in authoring the paper. All authors read and approved the final manuscript.
Corresponding author
Ethics declarations
Competing interests
The authors declare that they have no competing interests.
Publisher’s Note
Springer Nature remains neutral with regard to jurisdictional claims in published maps and institutional affiliations.
Rights and permissions
Open Access This article is distributed under the terms of the Creative Commons Attribution 4.0 International License (http://creativecommons.org/licenses/by/4.0/), which permits unrestricted use, distribution, and reproduction in any medium, provided you give appropriate credit to the original author(s) and the source, provide a link to the Creative Commons license, and indicate if changes were made.
About this article

Cite this article
Abkenar, A., Loke, S., Zaslavsky, A. et al. GARSAaaS: group activity recognition and situation analysis as a service. J Internet Serv Appl 10, 5 (2019). https://doi.org/10.1186/s13174-019-0103-1
Received:
Accepted:
Published:
DOI: https://doi.org/10.1186/s13174-019-0103-1