
Abstract
In recent years, various types of elastomeric isolators are used for seismic isolated buildings globally. International standards for elastomeric seismic-protection isolators, ISO 22762 were first developed in 2005, and this standard has been revised through a systematic review to issue the 3rd edition now (3rd edition was issued in October 2018). This paper describes breaking test results of elastomeric isolators to investigate the ultimate property (breaking limit) of isolators used for buildings around the world. Shear displacement capacity is one of the most important parameters of elastomeric isolators, and these tests results are useful for our proposal of the introduction of a classification system (classification of isolators according to their performance) to ISO 22762 in the near future. Breaking tests were carried out on 11 isolators produced in five countries. The isolators having diameters of around 800 mm, and the total rubber heights of around 160 mm were tested with increasing shear strain under constant compressive stress using a multi-axial testing system. The breaking shear strain was distributed between 300 and 450% or more.
Seismic isolation is an aseismic design concept to reduce the seismic force transmitted to the structures by supporting with a flexible element at the base or sometimes middle story of the buildings, to elongate the natural period of the structure and thereby decouples it from the ground. Elastomeric seismic-protection isolators are actually used widely as this flexible element.
In recent years, seismic isolation technology using elastomeric isolators is spreading for buildings and bridges in various regions such as Japan, China, Europe and the United States. With this background, the International Organization for Standardisation started in 2000 to develop standards covering testing methods and product specifications for elastomeric isolators. The first edition was completed and issued in July 2005 as ISO 22762 [1]. This standard consists of three parts: ISO 22762-1 [2] (part 1): test methods, ISO 22762-2 (part 2): applications for bridges—specifications, and ISO 22762-3 [3] (part 3): applications for buildings—specifications. To keep abreast with new developments, the revised version of ISO 22762 was published as the 2nd edition in November 2010 and currently, the standard is being revised through systematic review to issue the 3rd edition (3rd edition was issued in October 2018).
In considering the future of ISO 22762, it seems very important that a classification system which identifies the difference in performance of elastomeric isolators is introduced to the standard and we propose to introduce this system. By identifying the difference in performance of elastomeric isolators, structural engineers can select appropriate elastomeric isolators according to the importance/usage of the buildings. This system will also lead to improved performance and quality of isolators.
There are various important performance requirements for isolators as shown in ISO 22762-3. Ultimate property is one of the most important performance requirements in addition to long-term durability and various dependencies of horizontal properties etc. Ultimate property in shear direction is classified as stability (buckling), failure (breaking) and roll-out. The roll-out properties of isolators with either recessed or dowelled connections shall be checked, and shear displacement for roll-out can be calculated theoretically [4]. A method for predicting the buckling limit was proposed, and the validity of this method is shown by test results of various isolators in Annex G of ISO 22762-3. However, since breaking shear deformation can not be theoretically obtained, it is necessary to rely on an experimental evaluation.
Although there are various studies investigating breaking shear properties [5,6,7,8,9], many of these studies use small-scale models of isolators. Furthermore, there is no study investigating and comparing breaking shear properties of various isolators using the same testing system. From this point of view, the breaking tests were carried out for full-size products of nearly equal size and with almost the same shape factor as manufactured globally.
Experimental
Materials and methods
Elastomeric isolators used for breaking tests
The elastomeric isolator, made up with layers of alternating rubber and steel plates, as shown in Fig. 1, is the most popular device to satisfy the above requirements. The principal requirements for elastomeric isolators are:

Example of elastomeric isolator
-
(i)
Very high compressive stiffness to sustain a long-term vertical load.
-
(ii)
Low shear stiffness to shift the natural period of the structures.
-
(iii)
Large shear deformation capability to absorb the displacement of buildings during an earthquake.
-
(iv)
Durability for long-term use.
In the breaking tests, 11 elastomeric isolators were collected from China, Italy, Japan, Malaysia and the United States. Outlines of these isolators are shown in Table 1. Isolators were classified into three types; linear natural rubber bearing (LNR) which has almost linear characteristics in the horizontal force–displacement relationship, and its damping is low, within 2–4% in equivalent damping ratio; high-damping rubber bearing (HDR) is a type of rubber bearing in which a specially compounded rubber material is used to provide energy-dissipation capability mainly by internal friction between fillers and polymers during deformation; lead-core rubber bearing (LRB) is another type of rubber bearing that has both spring and damping functions combined where a cylindrically shaped lead core is vertically inserted at the centre of the bearing for energy dissipation.
Outer diameter of the isolators \(D_{\text{o}}\) is around 800 mm; inner diameter of the isolators \(D_{\text{i}}\) is 20–40 mm; diameter of the lead core \(D_{\text{p}}\) is 160–180 mm; the first shape factor \(S_{1}\) is 25.9–36.1; and the secondary shape factor \(S_{2}\) is approximately 5.0. Shear modulus of the rubber \(G\) is 0.4–0.8 MPa at 100% shear strain. The first shape factor \(S_{1}\) and the secondary shape factor \(S_{2}\) are calculated using Eqs. 1 and 2 below:
where, \(t\) is the thickness of one rubber sheet, and \(n\) is the number of rubber layers.
Figure 2 shows a sample of an isolator, a high-damping rubber bearing from Japan. The outer diameter is 800 mm, the first shape factor is 36.1, and the second shape factor is 4.9. Shear modulus of the high-damping rubber is 0.62 MPa at 100% shear strain, and the equivalent damping coefficient is 0.24 at the same shear strain.
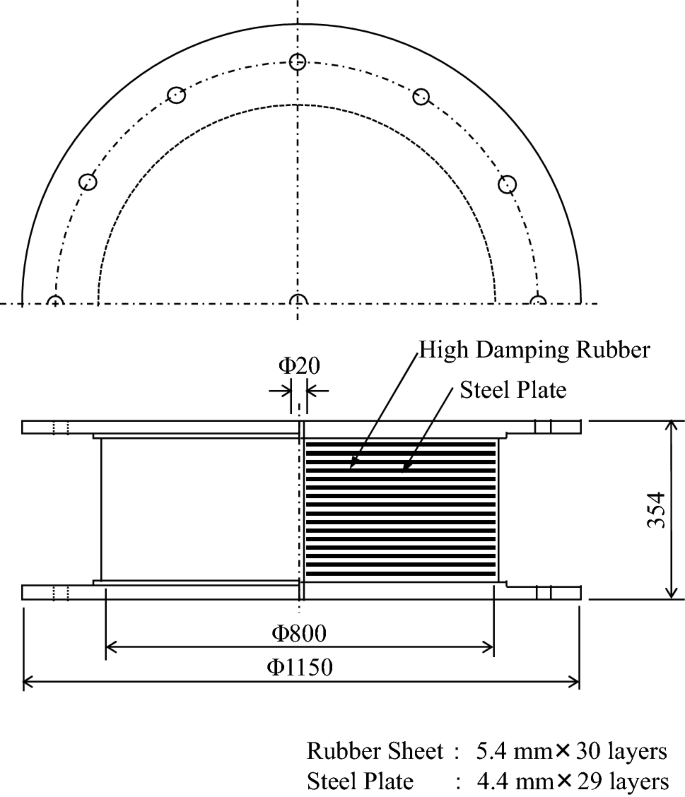
High-damping rubber bearing used for the breaking test
Test machine and test methods
Tests were carried out over 3 years using the multi-axial testing system (MATS) at the National Center for Research on Earthquake Engineering (NCREE) in Taiwan. The MATS illustrated in Fig. 3 has a 6-DOF (degree of freedom) loading system for seismic testing of structural components or sub-assemblies, and the system has longitudinal actuators, lateral actuators and vertical actuators. In the tests, isolators were deformed in a horizontal direction under a vertical load using the longitudinal actuators and the vertical actuators. The capacity of MATS is shown in Table 2. The testing system has a sufficient capacity of stroke and force for breaking tests in quasi-static condition.

Multi-axial testing system (MATS)
The tests were carried out for 3 years. Table 3 shows the test schedule and the procedures. In the tests, basic shear properties and basic compressive properties were measured at first, and then breaking shear properties were measured. In the 2nd and 3rd years, the tests to investigate compressive stress dependency and repeated deformation dependency of shear properties were added between the basic property test and ultimate property test. The horizontal loading rate was 10–15 mm/s in the tests except for the basic compressive property test (test number 2-1), and the vertical loading rate was 0.1 MN/s in the basic compressive properties test. Four isolators (TS01–TS04) were used in the 1st year, while six isolators (TS05–TS09) and two isolators (TS10–TS11) were used in the 2nd and 3rd years, respectively.
In this paper, compressive stress \(\sigma\), shear stress \(\tau\) and shear strain \(\gamma\) are defined by the following Eqs. 3–5:
where, \(P\) is vertical (compressive) load, \(F\) is horizontal load, \(\delta\) is horizontal displacement, and \(A\) is plan area of isolator excluding cover rubber portion.
In the ultimate property test, compressive stress is a constant value corresponding to the nominal compressive stress decided by the manufactures. Shear strain was given in the form of a triangular wave, and the amplitude was increased in the order of 200, 300, 400 and 450%. When isolators did not break at a 450% shear strain amplitude, the breaking test was discontinued to ensure safety.
In the compressive stress dependency test, compressive stress was varied to 0.5 times, 1.0 times and 2.0 times of the nominal compressive stress, respectively. In the repeated loading dependency test, 50 repeated deformations were applied consecutively.
Results and discussion
Basic properties
In the basic properties’ tests, shear stiffness, horizontal damping performance and compressive stiffness were measured. Shear stiffness or horizontal damping performance depends on the loading rate for HDR and LRB, therefore the results based on the quasi-static tests were not compared directly to the dynamic design values given by the manufactures. It was confirmed that all isolators’ performances met their design requirements.
Compressive stress and repeated loading dependency of shear properties
Compressive stress dependency and repeated loading dependency of shear properties were measured for 7 isolators and their results are shown in Tables 4 and 5. Shear properties(\(K_{\text{h}}\), \(h_{\text{eq}}\), \(K_{\text{d}}\) and \(Q_{\text{d}}\)) in Tables 4 and 5 defined in ISO 22762-1 are calculated using Eqs. 6–9:
where, \(Q_{1}\) is the maximum shear force, \(Q_{2}\) is the minimum shear force, \(X_{1}\) is the maximum displacement, \(X_{2}\) is the minimum displacement, \(Q_{{{\text{d}}1}}\), \(Q_{{{\text{d}}2}}\) are the points where the loop crosses the shear-force axis, on the positive and the negative sides, respectively, \(\Delta W\) is the area enclosed by the hysteresis loop.
Shear properties were calculated for the third cycle based on the compressive stress dependencies shown in Table 4. As an overall trend, \(K_{\text{h}} /K_{\text{d}}\) decreases and \(h_{\text{eq}} /Q_{\text{d}}\) increases with compressive stress increase. In detail, TS05 and TS06 have large compressive stress dependency because \(S_{1}\) is low and \(\sigma_{\text{o}}\) is high in these specimens. It seems that the compressive dependence of \(h_{\text{eq}}\) for TS10 is larger than the actual dependency, because the low value of \(h_{\text{eq}}\) is more sensitive to test accuracy (friction force correction of the test machine) than that of the other specimens.
Repeated loading dependency tests were carried out to investigate changes in shear properties and appearance abnormalities due to repeated fatigue and the results were summarised in Table 5. Shear properties hardly changed for all the test results. It is apparent that the temperature of the isolators did not increase much during the repeated loading tests for HDR and LRB as well as LNR due to the quasi-static loading pattern. Furthermore, there were no appearance abnormalities such as cracks and blisters on the surface of the isolators after the test.
Breaking properties
Typical breaking test results for LNR, HDR, and LRB are shown in Figs. 4, 5, and 6, respectively, while the shear stress and the shear strain are defined by Eqs. 4 and 5. All isolators possessed a hardening region where shear stress increases sharply as shear strain increases and this region is over around 250–300%. Isolators broke in this region although the breaking shear strain depended on isolators.

Breaking property of LNR

Breaking property of HDR

Breaking property of LRB
Breaking test results of all the isolators are summarised in Table 6. Final modes of the tests are classified into the following three modes (see Fig. 7 regarding mode 1 and mode 2):

Breaking mode
-
(i)
Mode 0: non-breaking.
-
(ii)
Mode 1: shear strain at breaking point equals the maximum shear strain.
-
(iii)
Mode 2: shear strain at breaking point is smaller than the maximum shear strain.
For mode 2, breaking shear strain was evaluated as the maximum strain experienced in the past. In Table 6, values in parentheses are shear strain at the breaking point. The maximum shear stress means the largest shear stress (absolute value) in the ultimate property test. This stress ranged from 1.9 to 5.4 MPa.
Figure 8 compares breaking shear strain of all the isolators based on Table 6. This shows that all isolators had high flexibility in the horizontal direction, and that there is no significant difference between LNR, HDR, and LRB. The breaking shear strain was distributed between 300 and 450% or more. For specimen TS04, breaking shear strain was around 300%, which was less than the breaking strain of other isolators. It should be considered that the rubber material used for the specimen TS04 has a higher modulus. Figure 9 shows the relationship between breaking shear strain and maximum shear stress in Table 6. The maximum shear stress of TS04 is 5.39 MPa and it represents the highest level.

Breaking shear strain of all the isolators

Relationship between breaking shear strain and maximum shear stress
Figure 10 shows the final conditions of breaking tests for all the isolators. These were the following three final conditions:
-
(i)
Condition 0: non-break.
-
(ii)
Condition 1: partial separation.
-
(iii)
Condition 2: complete separation.

Final conditions of the isolators
In Fig. 10, TS01, TS02 and TS05 are in condition 0, TS03, TS04, TS07, TS09, TS10 and TS11 are in condition 1, TS06 and TS08 are in condition 2.
Furthermore, samples of the breaking surface are shown in Fig. 11. In the breaking surface investigation, most of the fracture occurred in rubber and peeling of rubber or steel plate was not observed. These conditions showed that adhesion between the rubber and steel plate was adequate.

Samples of the breaking surfaces
Conclusions
Breaking limit of 11 isolators was investigated using the same test machine in NCREE. All of the isolators had high flexibility in the horizontal direction although it depended on isolators. The breaking shear strain was distributed between 300 and 450% or more. The lower shear strain of around 300% is due to the fact that the shear modulus is higher than the others (approximately double). The difference in the type of isolator does not clearly affect the breaking shear strain. There is no obvious difference in the breaking shear strain due to the difference in the type of isolators. Although HDR has a relatively high shear modulus, high-damping rubber is a nonlinear material, and shear modulus decreases in a larger strain region. The lead plug inserted in LRB does not significantly affect the breaking shear strain.
As described above, isolators have various important performances including breaking properties, and it is necessary to survey these performances thoroughly in the development of ISO 22762. For breaking properties, these breaking test results would be utilised to clarify the actual condition, although the challenge to expand the data in accordance with the actual size persists. In the near future, the classification system of ISO 22762 would be developed from a multifaceted viewpoint considering not only breaking properties but also other important performances.
References
Murota N, Kelly JM, Fuller K, Zhou FL, Nishi T, Yoshizawa T, Sudou C, Yazaki F (2006) New international standard for elastomeric seismic-protection isolators. In: 5th National seismic conference on bridges and highways, San Francisco, CA
ISO 22762-1 (2010) Elastomeric seismic-protection isolators part 1: test methods, 2nd edn
ISO 22762-3 (2010) Elastomeric seismic-protection isolators part 3: applications for buildings-specifications, 2nd edn
Kelly JM (1997) Earthquake-resistant design with rubber, 2nd edn. Springer, London
Fujita T, Fujita S, Tazaki S, Yoshizawa T, Suzuki S (1990) Research, development and implementation of rubber bearings for seismic isolation. JSME Int J Ser III 33(3):394–403
Aiken ID, Kelly J, Clark PW, Tamura K, Kikuchi M (1992) Experimental studies of the mechanical characteristics of three types of seismic isolation bearings. In: 10th World conference on earthquake engineering, Madrid, Spain
Muhr A (1994) Design of the isolation system for the demonstration building at Tenjo Resmi. In: UNIDO workshop on the use of natural-rubber based bearings for earthquake protection of small buildings, Jakarta
Feng D, Miyama T, Masuda K, Liu W, Zhou F, Zheng B, Li Z (2004) A detailed experimental study on Chinese G4 lead rubber bearing. In: 13th World conference on earthquake engineering, Vancouver, BC, Canada
Sato N, Nakayama T, Kaneko T, Nagata S, Imaoka T, Kurihara K, Hirai H, Mizutani K, Umeki Y (2014) Development of an evaluation method for seismic isolation systems of nuclear power facilities: part 8-fundamental properties of full-scale lead rubber bearings based on breaking test. In: ASME 2014 pressure vessels and piping conference, vol 8: seismic engineering, California, USA
Acknowledgements
This research was funded by the Ministry of Economy, Trade and Industry, Japan. The authors would like to express our greatest appreciation to the members in National Centre for Research on Earthquake Engineering (NCREE) for their generous cooperation. We would also like to thank the members of The Japan Rubber Manufacturers Association (JRMA) for their efforts and contributions in preparing the test specimens from abroad and conducting the tests.
Author information
Authors and Affiliations
Corresponding author
Additional information
Publisher's Note
Springer Nature remains neutral with regard to jurisdictional claims in published maps and institutional affiliations.
Rights and permissions
Open Access This article is distributed under the terms of the Creative Commons Attribution 4.0 International License (http://creativecommons.org/licenses/by/4.0/), which permits unrestricted use, distribution, and reproduction in any medium, provided you give appropriate credit to the original author(s) and the source, provide a link to the Creative Commons license, and indicate if changes were made.
About this article

Cite this article
Nishi, T., Suzuki, S., Aoki, M. et al. International investigation of shear displacement capacity of various elastomeric seismic-protection isolators for buildings. J Rubber Res 22, 33–41 (2019). https://doi.org/10.1007/s42464-019-00006-x
Received:
Accepted:
Published:
Issue Date:
DOI: https://doi.org/10.1007/s42464-019-00006-x