


Lifestyle changes in the last century, especially a sedentary life coupled with poor dietary choices, have led to an increasing prevalence of non-communicable chronic diseases. These noncommunicable chronic diseases, such as obesity, type 2 diabetes mellitus (T2DM) and CVD, are deemed responsible for two-thirds of the 57 million global deaths per year(Reference Barquera, Pedroza-Tobias and Medina1). Obesity and T2DM in particular are correlated not only with sugar consumption but also with physical inactivity(Reference Weeratunga, Jayasinghe and Perera2,Reference Siervo, Montagnese and Mathers3) .
Besides the pain, suffering and inconvenience to the affected individual, there is also a significant financial burden of T2DM both for the individual and for society. Cost-of-illness studies in different regions show that the medical expenses for people with T2DM are 2- to 4-fold higher than for people not suffering from this condition(Reference Jacobs, Hoyer and Brinks4–Reference Bermudez-Tamayo, Besançon and Johri6). For example, about 10 % of healthcare expenses in Germany are spent on the medical care of people with T2DM. This amounts to 16 billion Euros per year for Germany alone, indicating the huge economic burden of this disease(Reference Jacobs, Hoyer and Brinks4).
T2DM is often treated with oral antidiabetic drugs that either improve insulin sensitivity (e.g. metformin or glitazones) or increase insulin output from the pancreas (e.g. sulphonylureas, such as tolbutamide or glimepiride); combination therapies of these drugs are regularly used as well(Reference Molitch7). Glucosidase inhibitors (acarbose and miglitol) are often prescribed for prediabetic patients, but they come with side effects, most notably flatulence and bloating. A relatively new therapeutic class of antidiabetics, the gliflozins, block glucose re-absorption in the kidney by inhibition of the Na/glucose cotransporter-2 (SGLT2), thereby increasing glucose excretion and lowering blood sugar levels(Reference Molitch7).
Benjamin Franklin’s axiom ‘an ounce of prevention is worth a pound of cure’ is especially relevant for the prevention and treatment of non-communicable chronic diseases, especially T2DM. A healthy dietary pattern is a cornerstone for prevention, and compelling scientific evidence has shown many health benefits of individual foods and their constituent nutrients and bioactive components on the risk of chronic disease and associated risk factors(Reference Sikand, Kris-Etherton and Boulos8). One fruit that has long been in the focus for a healthy diet is the apple, hence the old adage ‘an apple a day keeps the doctor away’. The health benefits of apples have frequently been ascribed to secondary plant metabolites such as polyphenols, and over the past few decades, polyphenol-rich apple extracts have been developed for the amelioration of different ailments(Reference Akazome9–Reference Schloesser, Esatbeyoglu and Schultheiß15). One of the promising healthy polyphenols in apples is phloridzin (Fig. 1). Phloridzin (phloridzin; phloretin-2′-β-d-glucopyranoside) is the glucoside of the dihydrochalcone phloretin and occurs in the flesh and skin of apples (Malus pumila) and also in the bark of the apple tree. Phloridzin has long been known to influence glucose metabolism in humans through its action as a natural SGLT inhibitor, namely on SGLT1 in the intestine and SGLT2 in the kidney(Reference Chasis, Jolliffe and Smith16,Reference Ehrenkranz, Lewis and Ronald Kahn17) . By blocking these transporters and reducing sugar uptake from the intestine while concomitantly fostering sugar excretion in the urine, phloridzin may significantly reduce the sugar load of the body and be useful for the prevention of T2DM(Reference Ehrenkranz, Lewis and Ronald Kahn17).

Fig. 1. Structural formula of phloridzin (phloretin-2′-glucoside).
As apples are among the most consumed fruits worldwide, the intake of phloridzin via apples and apple products might contribute to the prevention of diabetes. Indeed, several studies have found a link between apple consumption and beneficial effect on T2DM risk(Reference Guo, Yang and Tang18–Reference Schulze, Bangert and Kottra20). The purpose of the present study was first to collect information on which foods naturally contain phloridzin and how much they contain, and then to calculate the intake of phloridzin from natural occurrence in foods by people in European countries.
Experimental materials and methods
Identification of food naturally containing phloridzin
Foods containing phloridzin were identified mainly from the Phenol Explorer Database of Polyphenols in Food (Phenol Explorer)(Reference Neveu, Perez-Jiménez and Vos21). Additional publications providing phloridzin levels in food were identified from a search of publicly available literature using the search terms ‘phloridzin’ and the names of different fruits to compile a database of natural occurrence of phloridzin in foods (Table 1). Data on phloridzin concentrations in the individual food items were then grouped together using the European Food Safety Authority (EFSA) FoodEx categorisation system(22) used in the EFSA Comprehensive Database(23) (Table 2), and the combined data were used for the dietary intake model. Concentrations of phloridzin are given in units of mg/100 g wet weight or mg/100 ml. Where data in the literature were provided in terms of dry weight, conversion to wet weight was made assuming 85 % water content in the fruit(24). Means, standard deviations and CV for the food items were calculated using Excel.
Table 1. Naturally occurring levels of phloridzin in food (mg/100 g wet weight or mg/100 ml) (Minimum and maximum values; mean values and standard deviations; coefficients of variation)
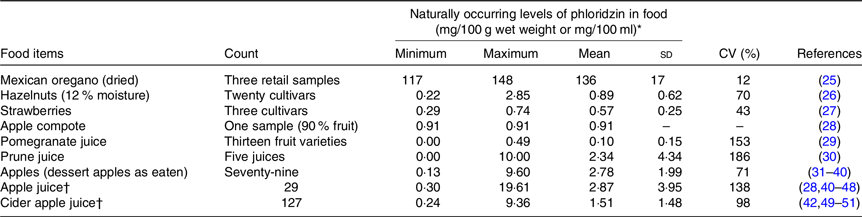
* Where phloridzin values in fruit were reported in the reference in terms of dry weight, wet weight was calculated assuming 85 % water content.
† Concentrated apple juice and cider were not included – not applicable.
Table 2. Food codes and phloridzin concentrations to be used in the dietary intake model
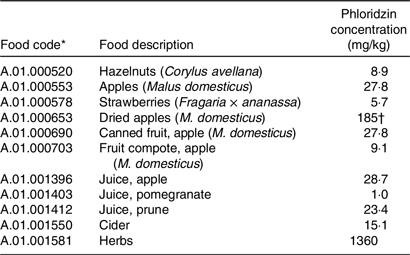
For apples, that is, as dessert apples or apples for eating, data for phloridzin levels for the whole fruit with the skin included were used when available. Where data were reported in the literature separately for apple flesh and peel, these were combined to estimate a value for a whole apple assuming 10 % peel and 90 % flesh. Where only data on apple flesh were available, these are also included in Table 1 as apples are also widely consumed in this form. Data for apple peel alone were not included. Cider apples are not directly eaten whole, rather they are intended only to be used to make apple cider juice, and therefore phloridzin levels only for the apple cider juice and not the whole fruit are included in this assessment.
The Phenol Explorer provides data for the following five dihydrochalcones: 3-hydroxyphloretin-2′-O-glucoside, 3-hydroxyphloretin-2′-O-xylosyl-glucoside, phloretin, phloretin- 2′-O-xylglucoside and phloridzin. This assessment was performed just for phloridzin (synonym: phloretin glucoside) which is one of the main phenolic compounds in apple products.
Modelling consumer intake of naturally occurring phloridzin
Food consumption data were taken from the published version of the EFSA Comprehensive European Food Consumption Database at Level L3(23). The national surveys were extracted into the Comprehensive European Dietary Exposure Model(Reference Tennant52), a dietary exposure model based on the methodology of the original EFSA Food Additive Intake Model in which the population average and consumers only 95th percentile intake (P95) from each food category is calculated(53). Exposure assessment is defined as the evaluation of the likely intake of biological, chemical or physical agents via food as well as other sources and routes(54). When the focus is on chemicals that are unintentionally present in food or added for a technological purpose, we refer to dietary exposure, whereas the term dietary intake is generally used to refer to the ingestion of nutrients, nutritive substances, novel foods, food ingredients or biologically active substances, which have nutrition or health purposes(Reference Gómez Ruiz and Bresson55). However, the terms tend to be used interchangeably. The Comprehensive European Dietary Expo sure Model method was developed and validated for use with food additives, but the same principles can be applied to any other food component. When average levels of phloridzin in foods are entered into the linked workbooks of the Comprehensive European Dietary Exposure Model, the levels of intake in mg/person per d and in mg/kg body weight per d are calculated for a food component for each food category in each age group in each country.
Using this method, intakes of phloridzin associated with each food have been estimated by multiplying the average phloridzin concentration in each food category (Table 3) with the population average or consumers only P95 food consumption value for each country/age group combination. For each country/age group combination, the food category with the highest P95 intake value was identified and to this was added the sum of the average intakes from all other food categories to estimate the high-level total intake. The average intake was the sum of population average intakes for all food categories(53).
Table 3. Estimated dietary intake of different population groups of naturally occurring phloridzin

bw, Body weight.
* List of food items that are the highest contributors to phloridzin intake for individual national dietary surveys.
† Lowest (minimum) and highest (maximum) national intake.
Food consumption data for the foods listed in Table 1 were available in the EFSA Comprehensive Food Consumption Database and so difficulties matching data on phloridzin levels and food consumption as described by Durazzo et al. (Reference Durazzo, Camilli and D’Addezio56) were not encountered. It was not possible to estimate phloridzin levels in complex food matrices because of the absence of standardised databases on the composition of such food(Reference Marconi, Durazzo and Camilli57). The principle source of phloridzin exposure was apples, and so consumption of apples in composite foods, such as apple pies, would be excluded. However, consumption of apple products, such as apple juice, was included.
Results
Natural occurrence of phloridzin in foods
With a mean concentration of 136 mg/100 g, dried Mexican oregano was the food item with the highest naturally occurring concentration of phloridzin identified from the publicly available scientific literature (Table 1). At only 2 % of the phloridzin concentration reported in Mexican oregano, the next highest mean concentrations of 2·78 mg/100 g and 2·87 mg/100 ml were reported in apples and apple juice, respectively. Levels of phloridzin were reported for prune juice and pomegranate juice, but no data are available on prune and pomegranate fruit. Based upon the similarity in concentrations between apples and apple juice, phloridzin levels in the whole prune and pomegranate fruit could be similar to the juice. In addition to the food items listed in Table 1, phloridzin has been reportedly identified but not quantified in cranberries and cranberry products(Reference Pappas and Schaich58) and in rosemary, oregano, sage, basil and thyme(Reference Hossain, Rai and Brunton59).
There was a relatively wide range of phloridzin levels reported in dessert apples, apple juice and apple cider. This may be due to variations in cultivars, cultivation conditions(Reference Guyot, Marnet and Sanoner60), age of the fruit or differences in analytical methods used to quantify phloridzin. Overall results for these three apple products were similar and so the average levels for each apple product were used in dietary intake calculations without modification.
Consumer intakes of phloridzin
Based upon the identified foods that naturally contain phloridzin (Table 1), FoodEx food category codes were selected from the categories available in the EFSA Comprehensive European Food Consumption Database and linked to average phloridzin concentrations for use as inputs into the food intake models (Table 2).
Intakes of phloridzin by different population age groups in Europe are summarised in Table 3. Average intakes ranged from 0·10 to 7·50 mg/d or <0·01–0·16 mg/kg body weight per d and high-level intakes ranged from 0·72 to 51·68 mg/d or 0·01–0·97 mg/kg body weight per d. Apple juice was the highest contributor to phloridzin intake for infants, toddlers and other children with apples as a close second. For adolescents, adults, elderly and the very elderly, it was the reverse, apples were the highest contributor to phloridzin intake followed by apple juice. Another significant phloridzin-contributing food item for adults was apple cider; adults in Ireland, the UK and Finland had particularly elevated total high-level phloridzin intakes due to cider consumption when results were broken out in detail by country and age group (Table 4). Whereas, high intake of apple juice was responsible for high-level phloridzin intake in all German population groups except for infants, for which apples were the major contributor. In contrast to other countries, herbs contributed most to the high-level intake in other children and the very elderly only in France.
Table 4. Average and total high-level phloridzin intake for population groups in European Union countries (mg/d)

–, No data or insufficient data, that is, fewer than 60; where a cell has more than one value, the values are for different national surveys. For age ranges see Table 3.
For all population groups considered together, apple juice (fresh or fermented) made the greatest contribution to total intake of phloridzin, followed by dessert apple consumption. Other food categories did not appear to make a significant contribution to European phloridzin consumption.
Considering the average intake of phloridzin by the European population of 0·10–7·5 mg/d and the phloridzin content of apples and apple juice of about 28 mg/kg, this would imply a daily consumption of 4–270 g of dessert apple or 4–270 ml of apple juice.
Uncertainty analysis
All exposure estimates should include an uncertainty analysis as recommended by the EFSA Scientific Committee(61). Uncertainty analysis can provide guidance on the reliability of assessments and in particular whether they are likely to over- or under-estimate true exposures. The EFSA Scientific Committee Guidelines provide recommendation on the structure for an uncertainty analysis, and additional guidance is available from a WHO/IPCS report on characterising and communicating uncertainty in exposure assessment(62). While exposure assessments focus on unintentionally present substances, the same technique can be used for dietary intake assessments.
Parameter uncertainties associated with food consumption data relate mainly to the limitations of food consumption surveys. If the number of consumers is small, then estimates of high percentiles are unreliable. In the present study, the numbers of consumers of apples and apple juice were sufficiently high to allow a high degree of confidence in consumption data. This factor particularly affects foods that are rarely consumed such as prune juice, hazelnuts and herbs. The duration of the survey will also have an impact, again if foods are relatively infrequently consumed. If a survey covers only 2 d, then any consumption during this period will be included in the ‘consumers only’ estimate, whereas the true consumption could be much lower if the survey duration was longer.
Data on the concentrations of phloridzin are also subject to significant uncertainties derived from sampling analytical and reporting errors. There may also be errors converting between dried and fresh products. Values are included only for foods where phloridzin has been reported. There may be other foods that also contain phloridzin for which no data are available. Processed foods that could be made from foods that contain phloridzin such as apple pie have also been excluded because of lack of data. Relatively high variability in phloridzin levels (CV over 100 % in some cases), which may reflect differences in plant variety, ripeness, etc., represents a significant potential source of uncertainty.
Model uncertainties relate to the consumer exposure model provided in the original EFSA ANS Food Additive Intake Model template where for each country/age group combination, the food category with the highest P95 intake value is identified and to this is added the sum of the average intakes from all other food categories to estimate the high-level total intake. Total average intake is the sum of population average intakes for all food categories. The model as used in the Food Additive Intake Model is likely to over-estimate intakes by a factor of up to 2 to 3(53).
The observations made in the uncertainty analysis can be tabulated following the approach recommended by the EFSA Scientific Committee (Table 5). This allows a subjective assessment of uncertainty to provide a semi-quantitative estimate of the effect of uncertainty on the estimate of dietary intake. Overall, the effects of uncertainty are likely to produce a small over-estimation of dietary intake.
Table 5. Uncertainties table as recommended by the European Food Safety Authority Scientific Committee
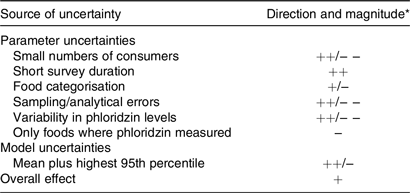
* Key to direction and magnitude. +, ++, +++ = uncertainty likely to cause small, medium or large over-estimation of dietary intake. −, − −, − − − = uncertainty likely to cause small, medium or large under-estimation of dietary intake.
Discussion
The origin and development of many chronic diseases have been shown to have both environmental and hereditary predisposition components. Dietary and lifestyle changes can have positive effects on the health of patients suffering from chronic diseases such as diabetes or may even reduce the incidence of certain diseases. Several studies have shown efficacy of lifestyle interventions with regard to diabetes prevention with a relative risk reduction of 40–70 % in adults with prediabetes(Reference Russell, Baka and Björck63). Besides changes in physical activity and weight reduction, lifestyle changes also include dietary changes, for example, eating more fruit and vegetables. Numerous studies have investigated potential effects of the nutrients in whole fruit and vegetables (dietary fibre, vitamins, minerals and phytochemicals) on various health outcomes(Reference Slavin and Lloyd64).
Phloridzin is a polyphenol, or more precisely, a dihydrochalcone. It acts as a specific and competitive inhibitor of SGLT1 and SGLT2. While SGLT2 is located only in the kidney, SGLT1 is located primarily in the small intestine as well as in the kidney(Reference Ehrenkranz, Lewis and Ronald Kahn17). Inhibition of SGLT1 by phloridzin could thus contribute to a reduced uptake of sugars from the gut, which might be beneficial for people suffering from prediabetes or T2DM.
Our studies have identified phloridzin in Mexican oregano, apples, and at lower concentrations in prune, pomegranate, strawberries, cranberries and Mediterranean herbs. Despite the much higher levels in Mexican oregano, the highest consumption of phloridzin in Europe is clearly from apples and apple products, mainly apple juice. Estimation of phloridzin consumption from apples is not straightforward as wide variations of phloridzin levels have been reported in (dessert) apples (0·13–9·60 mg/100 g fresh weight) and apple juices (0·30–19·6 mg/100 ml). This variation is mainly attributable to cultivar variations, cultivation conditions and annual changes in phloridzin content.
Several studies on phloridzin and diabetes have been conducted in rodents and have shown favourable outcomes in terms of blood glucose levels, diabetic nephropathy, neuropathy and retinopathy(Reference Schloesser, Esatbeyoglu and Schultheiß15,Reference Pei, Li and Zhang65–Reference Katsuda, Sasase and Tadaki67) . Moreover, in insulin-treated diabetic rats, the co-infusion of phloridzin, in addition to insulin treatment, allowed for the induction of hypoglycaemia with a 5-fold lower insulin dose(Reference Inouye, Yue and Chan68).
Compared with recent human trials with purified apple extracts and focusing on blood glucose management, the calculated average and high-level phloridzin intake for adults of 6·37 and 51·68 mg/d, respectively, is quite low. Schulze et al. used 2·8 g of apple extract containing 448 mg of phloridzin, Makarova et al. used an apple extract with a total dose of 315 mg phloridzin and Shoji et al. administered apple extract containing a daily dose of 60 mg phloridzin(Reference Makarova, Górnaś and Konrade19,Reference Schulze, Bangert and Kottra20,Reference Shoji, Yamada and Miura69) . In an intervention study with ten healthy lean men, Schulze et al. reported a substantial reduction of intestinal glucose absorption in the oral glucose tolerance test, visible as significantly reduced venous blood glucose and plasma insulin levels(Reference Schulze, Bangert and Kottra20). In addition, they observed increased renal glucose excretion. Similarly, Makarova et al. found a reduced postprandial glucose response and increased urinary glucose excretion after single administration of the apple extract in six healthy females(Reference Makarova, Górnaś and Konrade19).
Shoji et al. performed a randomised double-blind placebo-controlled study in subjects with fasting plasma glucose of 5·6–6·9 mmol/l (100–125 mg/dl), which is elevated but below the diagnostic threshold for diabetes mellitus(Reference Shoji, Yamada and Miura69). The study collective consisted of forty-four volunteers in both placebo and apple polyphenol intervention groups, of which thirty-three and thirty-two, respectively, finished the 12-week intervention. Chronic administration for 12-weeks of 600 mg/d apple extract, containing 10 % phloretin glycosides, 49 % procyanidins and 14 % flavanols, significantly reduced the increase in glucose at 30-min post oral glucose tolerance test in high-normal and borderline-diabetic subjects, compared with the placebo regimen. Also, plasma glucose AUC was significantly lower compared with placebo in high-normal and borderline-diabetic subjects. In normoglycaemic subjects (fasting plasma glucose < 5·6 mmol/l ( < 100 mg/dl)), no significant differences in 30-min post oral glucose tolerance test plasma glucose and plasma glucose AUC were found. No significant differences were detected between the groups for any of the insulin sensitivity parameters measured. These results indicate that apple polyphenols improved hyperglycaemia in high-normal and borderline-diabetic subjects. The dose of about 60 mg phloretin glycosides slightly exceeds the highest high-level consumption of phloridzin via natural sources. Importantly, adverse effects after the 12-week consumption of 600 mg/d apple extract were not reported.
Johnston et al. conducted a cross-over study in which nine subjects consumed a single dose of a clear apple juice, a cloudy apple juice or a control beverage (sucrose, d-glucose and d-fructose in water)(Reference Johnston, Clifford and Morgan41). The three beverages were standardised to contain the same amount of sugars. The single 400 ml doses of clear and cloudy apple juice contained 11·7 and 25·8 mg of phloridzin, respectively, which would be in the medium to high consumption range. Although there was no effect on plasma glucose concentrations, there was a significant treatment × time interaction over the 3 h observation interval, indicating delayed absorption when glucose was consumed in the apple juices compared with the control. This might indicate that medium- to high-level consumption of phloridzin-containing foods might exert an effect on glucose uptake. It can, however, not be ruled out that the effect observed by Johnston et al. might be due to the apple pectin, which is also known to affect glucose uptake(Reference Jenkins and Jenkins70).
That physiological doses of phloridzin, other apple polyphenols and dietary fibre are beneficial in reducing the risk of T2DM is implied by the results of a meta-analysis(Reference Guo, Yang and Tang18). The meta-analysis evaluated five independent prospective cohort studies with 14 120 T2DM cases and 228 315 participants. The researchers found that apple and pear consumption was inversely associated with T2DM risk. There was a dose-dependent trend, with a reduction of T2DM risk by 3–4 % per serving of apple or pear per week. It is thought that the polyphenols including dihydrochalcones are in part responsible for the lower T2DM risk due to their antioxidant and anti-inflammatory capacity; also, the dietary fibre in apples might reduce hyperinsulinaemia and postprandial glucose response.
The risk of developing T2DM increases with age, especially after age 45 years when individuals tend to exercise less, lose muscle mass and gain weight as they age. Our analysis shows that elderly (65–75 years) and very elderly (above 75 years) people in Europe consume less phloridzin than adults and adolescents. Compared with the average phloridzin intake for adults of 1·29–6·37 mg/d, the elderly consume 1·38–5·84 mg/d and the very elderly 1·38–5·45 mg/d. High-level intake is 4·32–39·32 mg/d for the elderly and 5·13–2·70 mg/d for the very elderly, a decrease of 24–37 % v. the adult population (5·05–51·68 mg/d). The age group of ‘adults’ in the European Food Consumption Database covers a wide span from 18 to 64 years, so it cannot be shown if phloridzin consumption declines before age 64 years but the trend to a lower consumption in the elderly and very elderly does indicate that this is the case. An increased intake of phloridzin and other apple bioactive ingredients, such as dietary fibre, would be especially important in the over 45 years age group to reduce the risk of developing T2DM.
Taken together, animal studies and human clinical trials show a reduction or delay in intestinal glucose absorption after administration of high doses of phloridzin or apple extracts. Furthermore, a reduction of T2DM risk has been attributed to the consumption of apples and pears in a large meta-analysis of > 200 000 participants throughout five prospective studies. These results indicate that phloridzin may be beneficial in the prevention of T2DM, one of the leading health concerns of western and developing countries. Our research has shown that the average phloridzin consumption in Europe by population groups ranging in age from 3 years to the very elderly is about 5·5–7·5 mg/d. High-level consumption could be as high as 52 mg/d in adults. In the elderly population, those most at risk of developing T2DM, phloridzin consumption is decreased in comparison with the adult population. More research is needed to elucidate the possible beneficial effects of increasing phloridzin in the diet on the development or progress of non-communicable chronic diseases.
Conclusion
To the best of our knowledge, this is the first time that the link has been made between naturally present phloridzin content in foods and dietary intake. Dietary phloridzin intake was found to be somewhat lower than levels used in human studies in which phloridzin-containing apple extract or apple juice had positive effects on glucose parameters. Inclusion of more apple products in the diet, especially by the elderly, could have positive effects on the development or progression of some diet-related chronic diseases.
Acknowledgements
DSM Nutritional Products funded the original research, but did not fund the publication.
P. B. formulated the research question; D. R. T. and K. E. N. designed the study and analysed the data. All authors contributed to writing the manuscript, critically reviewing and approving the final manuscript.
The authors declare that there are no conflicts of interest.


