Article

Impact of Mutations in Arabidopsis thaliana Metabolic Pathways on Polerovirus Accumulation, Aphid Performance, and Feeding Behavior

1
Université de Strasbourg, Institut National de Recherche en Agriculture, Alimentation et Environnement, SVQV UMR-A1131, 68000 Colmar, France
2
Institut de biologie moléculaire des plantes, Centre National de la Recherche Scientifique, Université de Strasbourg, 67084 Strasbourg, France
*
Author to whom correspondence should be addressed.
Viruses 2020, 12(2), 146; https://doi.org/10.3390/v12020146
Submission received: 4 December 2019 / Revised: 15 January 2020 / Accepted: 23 January 2020 / Published: 27 January 2020
(This article belongs to the Special Issue Plant Virus Transmission by Vectors)

Abstract

:
During the process of virus acquisition by aphids, plants respond to both the virus and the aphids by mobilizing different metabolic pathways. It is conceivable that the plant metabolic responses to both aggressors may be conducive to virus acquisition. To address this question, we analyze the accumulation of the phloem-limited polerovirus Turnip yellows virus (TuYV), which is strictly transmitted by aphids, and aphid’s life traits in six Arabidopsis thaliana mutants (xth33, ss3-2, nata1, myc234, quad, atr1D, and pad4-1). We observed that mutations affecting the carbohydrate metabolism, the synthesis of a non-protein amino acid and the glucosinolate pathway had an effect on TuYV accumulation. However, the virus titer did not correlate with the virus transmission efficiency. Some mutations in A. thaliana affect the aphid feeding behavior but often only in infected plants. The duration of the phloem sap ingestion phase, together with the time preceding the first sap ingestion, affect the virus transmission rate more than the virus titer did. Our results also show that the aphids reared on infected mutant plants had a reduced biomass regardless of the mutation and the duration of the sap ingestion phase.

1. Introduction

Aphids are a large group of Hemipteran insects that induce direct damage on plants but are, more importantly, major vectors of plant viruses. Among aphids, Myzus persicae, the green peach aphid, can transmit more than 100 different virus species to a variety of plant species including the model plant Arabidopsis thaliana [1]. The success of transmission results from molecular interactions between the virus, the plant, and the vector. Indeed, once an aphid probes and then feeds on a host plant, it releases salivary secretions that are recognized and elicit plant defenses [2,3,4,5]. These reactions implement a number of metabolic and physiological modifications that may have a detrimental effect on aphids [6,7,8,9]. Several hormonal pathways induced in reaction to M. persicae are characterized in A. thaliana and involve ethylene, salicylic, jasmonic, and abscisic acid-signaling pathways [7,8]. Secondary metabolites are also important in plant defense against aphids. For example, PAD4 (phytoalexin-deficient 4) and PAD3, a cytochrome P450 involved in the synthesis of camalexin, both act as key players in modulating plant defenses against M. persicae [10,11,12]. Glucosinolates are herbivores-deterrent secondary metabolites in Brassicaceae that increase upon aphid feeding and reduce A. thaliana susceptibility to aphids [13,14,15]. Finally, callose deposition, modification of starch content, and stimulation of senescence constitute additional modifications that may affect M. persicae [7].
Arabidopsis thaliana can, among other plant viruses, be infected by poleroviruses (Polerovirus genus, Luteoviridae family) that are transmitted by aphids in a circulative and non-propagative mode [16]. Polerovirus particles are acquired by aphids during phloem sap ingestion on infected plants. Virions migrate through the gut and internalize into intestinal cells after binding to specific virus receptors [17]. Virus particles are then transported through the intestinal cells and released in the hemolymph. Finally, polerovirus particles cross the salivary gland cells and are released together with saliva into a new plant host during a subsequent feeding event [18].
There is growing evidence that aphid-transmitted viruses can affect plant phenotypes and vector behaviors in ways that may ultimately facilitate virus acquisition and inoculation [19,20]. This concept of plant and aphid “manipulation” by the virus also applies to viruses in the Luteoviridae family. Polerovirus infection induces leaf yellowing, which may be visually attractive for aphids [21]. The major viral determinant governing both symptoms expressions, including yellowing, and aphid transmission, is attributed to the minor capsid protein of poleroviruses [22,23]. These viruses also increase volatiles emission from infected plants that attract non-viruliferous aphids [24,25]. In addition, polerovirus infection alters plant palatability and quality that affect aphid feeding behavior and performances [26,27]. Changes in aphid behavior following virus acquisition are shown for Cucurbit aphid-borne virus (CABYV), Potato leafroll virus (PLRV) (Polerovirus genus, Luteoviridae family), and Barley yellow dwarf virus (BYDV) (Luteovirus genus, Luteoviridae family) [26,28,29]. Most studies conducted so far on potential “manipulations” of plants and aphids by poleroviruses and luteoviruses are mainly descriptive, and the molecular mechanisms behind the observed effects of the viruses on plants or on aphids are still unknown.
Knowledge on the plant response to poleroviruses is lacking, but transcriptomic analyses on plants infected by other aphid-transmitted viruses identified several plant defense pathways induced by viral infection. In addition to the RNA silencing pathway, these include stress and defense responses characterized by the induction of heat shock proteins and the accumulation of pathogenesis-related proteins mediated by salicylic acid [30,31,32]. Genes involved in plant growth and development like those modulating accumulation of abscisic acid, auxin, cytokinin, gibberellin, and ethylene are also induced [30,31,32]. Since common pathways or reactions are turned on following aphid infestation or virus infection, like the jasmonic acid pathway, response to hydrogen peroxide, and callose deposition, it is conceivable that plant defensive signaling and metabolism serve viruses to spread between plants by influencing aphid performance and feeding behavior. Until now, only a few viral proteins are supposed to impact aphid behavior (for review [33,34]). Some of these viral factors interfere with the jasmonic acid or ethylene pathways, or with the production of reactive oxygen species [33,34,35]. For example, it was shown that Cucumber mosaic virus, a non-persistently transmitted virus, drives accumulation of reactive oxygen species through the action of its 2b silencing suppressor, which consequently shortens aphid probes and increases virus acquisition [35]. Another advanced molecular study on viral impacts on aphid performance addresses the role of the nuclear inclusion-a protease (NIa-Pro) from Turnip mosaic virus, which regulates ethylene production and ethylene-related defense mechanisms [36,37,38]. The effect of NIa-Pro on aphid performance correlates with its ability to relocalize to the vacuole after aphid puncture [39].
Further functional studies are needed to identify metabolic pathways that are under virus control, influence aphid performance and/or feeding behavior, and ultimately impact virus acquisition and transmission. Consequently, we selected some A. thaliana mutants known to be affected in carbohydrates and glucosinolates metabolisms, phloem functions, and defense signaling and investigated their potential incidence on aphid traits, on Turnip yellows virus (TuYV, Polerovirus genus, Luteoviridae family) accumulation as well as on growth and feeding behavior of M. persicae, an efficient vector of TuYV. Mutants that influenced sap ingestion by aphids in TuYV-infected plants were further tested for their effect on virus transmission.

2. Materials and Methods

2.1. Plant Growth and Aphid Rearing

Arabidopsis thaliana mutant seeds were obtained from stock centers for pad4-1 (PHYTOALEXIN DEFICIENT 4; N3806), xth33 (xyloglucan:xyloglucosyl transferase 33; N16546), ss3-2 (starch synthase 3; N869727). quad (cyp79B2cyp79B3myb28myb29) and myc234 (myc2myc3myc4) were kindly provided by Philippe Reymond (Lausanne University, Lausanne, Switzerland). atr1D was obtained from Judith Bender (Johns Hopkins University, Baltimore, MD, USA) and nata1 (GK-256F07) from Georg Jander (Boyce Thompson Institute, Ithaca, NY, USA). For nata-1, xth33-1, and ss3-2 A. thaliana mutants, homozygosis and T-DNA insertion were analyzed by PCR using primers described in Table S1. For pad4-1 mutant, the point mutation was confirmed by BsmF1 digestion of a PCR product amplified using the primers described in Table S1. ATR1D point mutation was confirmed by sequencing the PCR product encompassing the mutation (see primers in Table S1).
A. thaliana plants were grown in a growth chamber under 20 ± 1 °C and 14 h photoperiod under fluorescent lamps. Plants were aphid-inoculated two weeks post-sowing and kept in the same conditions. The Myzus persicae (Sulzer) (Hemiptera: Aphididae) clone originates from the Netherlands. Aphids were reared on Chinese cabbage (Brassica rapa) in a growth chamber under 20 ± 1 °C, and 16 h photoperiod.

2.2. Plant Inoculation with Viruliferous Aphids

Arabidopsis thaliana mutants and the reference ecotype Col-0 were inoculated using viruliferous M. persicae. Non-viruliferous aphids were fed with an artificial medium [22] containing TuYV at a concentration of 100 ng/µL and purified as described in [40]. After a 24 h acquisition period, two aphids were transferred onto each Col-0 plant or A. thaliana mutant. After 72 h inoculation, aphids were manually eliminated, and the plants were grown for 3 weeks before being tested by double-antibody sandwich enzyme-linked immunosorbent assay (DAS-ELISA) for infection status.

2.3. Virus Detection by DAS-ELISA and Quantitative RT-PCR (qRT-PCR)

TuYV was detected in non-inoculated leaves of A. thaliana by double-antibody sandwich enzyme-linked immunosorbent assay (DAS-ELISA) with a TuYV-specific polyclonal antiserum (Loewe) 3 weeks post-inoculation [41]. For qRT-PCR, total RNA was extracted 3 weeks post-inoculation using NucleoSpin RNA Plant Kit (Macherey-Nagel, Hœrdt, France). After quantification (Nanodrop 2000, ThermoFisher Scientific, Illkirch, France), 200 ng of viral RNA were converted to cDNA using the reverse primer BPqtR1 (Table S1) and the M-MLV reverse transcriptase kit (Promega, Charbonnières-les-Bains, France). The forward primer BPqtF0 and the reverse primer BPqtR1 (Table S1) were used to amplify the cDNA corresponding to nts 3694-3830 on TuYV genomic sequence (accession number NC_003743) using a CFX cycler (Biorad, Schiltigheim, France) programmed as follows: 3 min 95 °C, 40 amplification cycles for 10 s at 95 °C, 30 s at 60 °C. Melt curve analysis was performed from 60 °C to 95 °C with 5 s of 0.5 °C increments. Dilution series of 108 to 103 viral cDNA copies obtained from RNA extracted from purified virions were used for calibration. The comparison between the Ct values of the calibration standard and the samples provided an absolute quantification of TuYV genomes.

2.4. Plant to Plant Virus Transmission by M. Persicae

Non-viruliferous aphids (L4 and adults) were deposited onto TuYV-infected plants for virus acquisition during 24 h. After this acquisition access period, two aphids were deposited per Col-0 test plant for a 3-day inoculation period. Aphids were then eliminated by an insecticide treatment (Pirimor®, Certis Europe France, Guyancourt, France) and the test plants were assayed by DAS-ELISA 3 weeks later. In each virus transmission experiment, one to three virus source plants were used per condition and 20 to 60 test plants per condition.

2.5. Myzus Persicae Feeding Behavior Analysis on A. Thaliana Plants

Pools of synchronized first-instar nymphs were obtained from parthenogenetic adult females placed on detached leaves of pepper plant (Capsicum annuum) and deposited on 1.5% agar in Petri dishes during 24 h. Synchronized young adults were obtained 9–10 days later in the same device. The electrical penetration graph DC system [42] was used as described in [27]. The following parameters were extracted from the electropenetrography (EPG) recordings based on their characteristic EPG waveforms described in [43]: (Pr) stylet activity within plant tissues; (C) stylet pathways in plant tissues except phloem and xylem; (E1) salivation in phloem elements; (E2) passive phloem sap ingestion; (t > 1E2) time to first phloem ingestion; (G) active xylem sap ingestion; (F) derailed stylet mechanics. The feeding behavior was recorded for 8 h on infected or non-infected plants used only once.

2.6. Myzus Persicae Performance on A. Thaliana Mutants

Myzus persicae performance was evaluated by measuring the weight of individual aphids. Synchronized M. persicae first instar (L1 stage) was obtained as described above and deposited on whole plants of A. thaliana mutant (50 aphids on three different plants). After 10 days, thirty aphids were randomly selected and weighted individually with an electronic precision scale (Sartorius, MSE3.6P-000-DM, maximum 3.1 Kg, low 1 μg, (dd) = 1 μg).

2.7. Statistical Analyses

Data on TuYV accumulation in mutants and Col-0 are not normally distributed, thus we carried out a generalized linear model (GLM using quasi-Poisson distribution (link:log) followed by pairwise comparisons using estimated marginal means (package R: ‘emmeans’).
We used a generalized linear model (GLM) with a likelihood ratio and Chi-squared test to assess whether there was an effect of TuYV infection, or an effect of the mutation introduced into A. thaliana genome on M. persicae performance and feeding behavior. Data on aphid weight were analyzed by a GLM using Gaussian distribution. When a significant effect of one of the main factors was detected or when an interaction between factors was significant, a pairwise comparison using least-squares means (package R: “lsmeans”) (p-value adjustment with Tukey’s method) at the 0.05 significance level was used to test for differences between treatments. Data on aphid feeding behavior (s-E2) are not normally distributed, accordingly we carried out a GLM using a gamma (link = ”inverse”) distribution. When a significant effect of one of the main factors was detected or when an interaction between factors was significant, a pairwise comparison using least-squares means (package R: “lsmeans”) (p-value adjustment with Tukey’s method) at the 0.05 significance level was used to test for differences between treatments. Data on aphid feeding behavior (t1 < E2) were modeled using the Cox proportional hazards (CPH) model and we treated cases where the given event did not occur as censored. The assumption of validity of proportional hazards was checked using the functions “coxph” and “cox.zph”, respectively (package R: “survival”). The fit of all generalized linear models was controlled by inspecting residuals and QQ plots.
Comparisons of transmission efficiencies were analyzed by Pearson’s Chi-squared tests and followed by pairwise comparisons using Pearson’s Chi-squared tests with Yates’ continuity correction (p-value adjustment method: fdr) (package R: “RVAideMemoire”).
All statistical analyses were performed using the R software version 3.3.2 (The R Foundation, https://www.r-project.org/).

3. Results

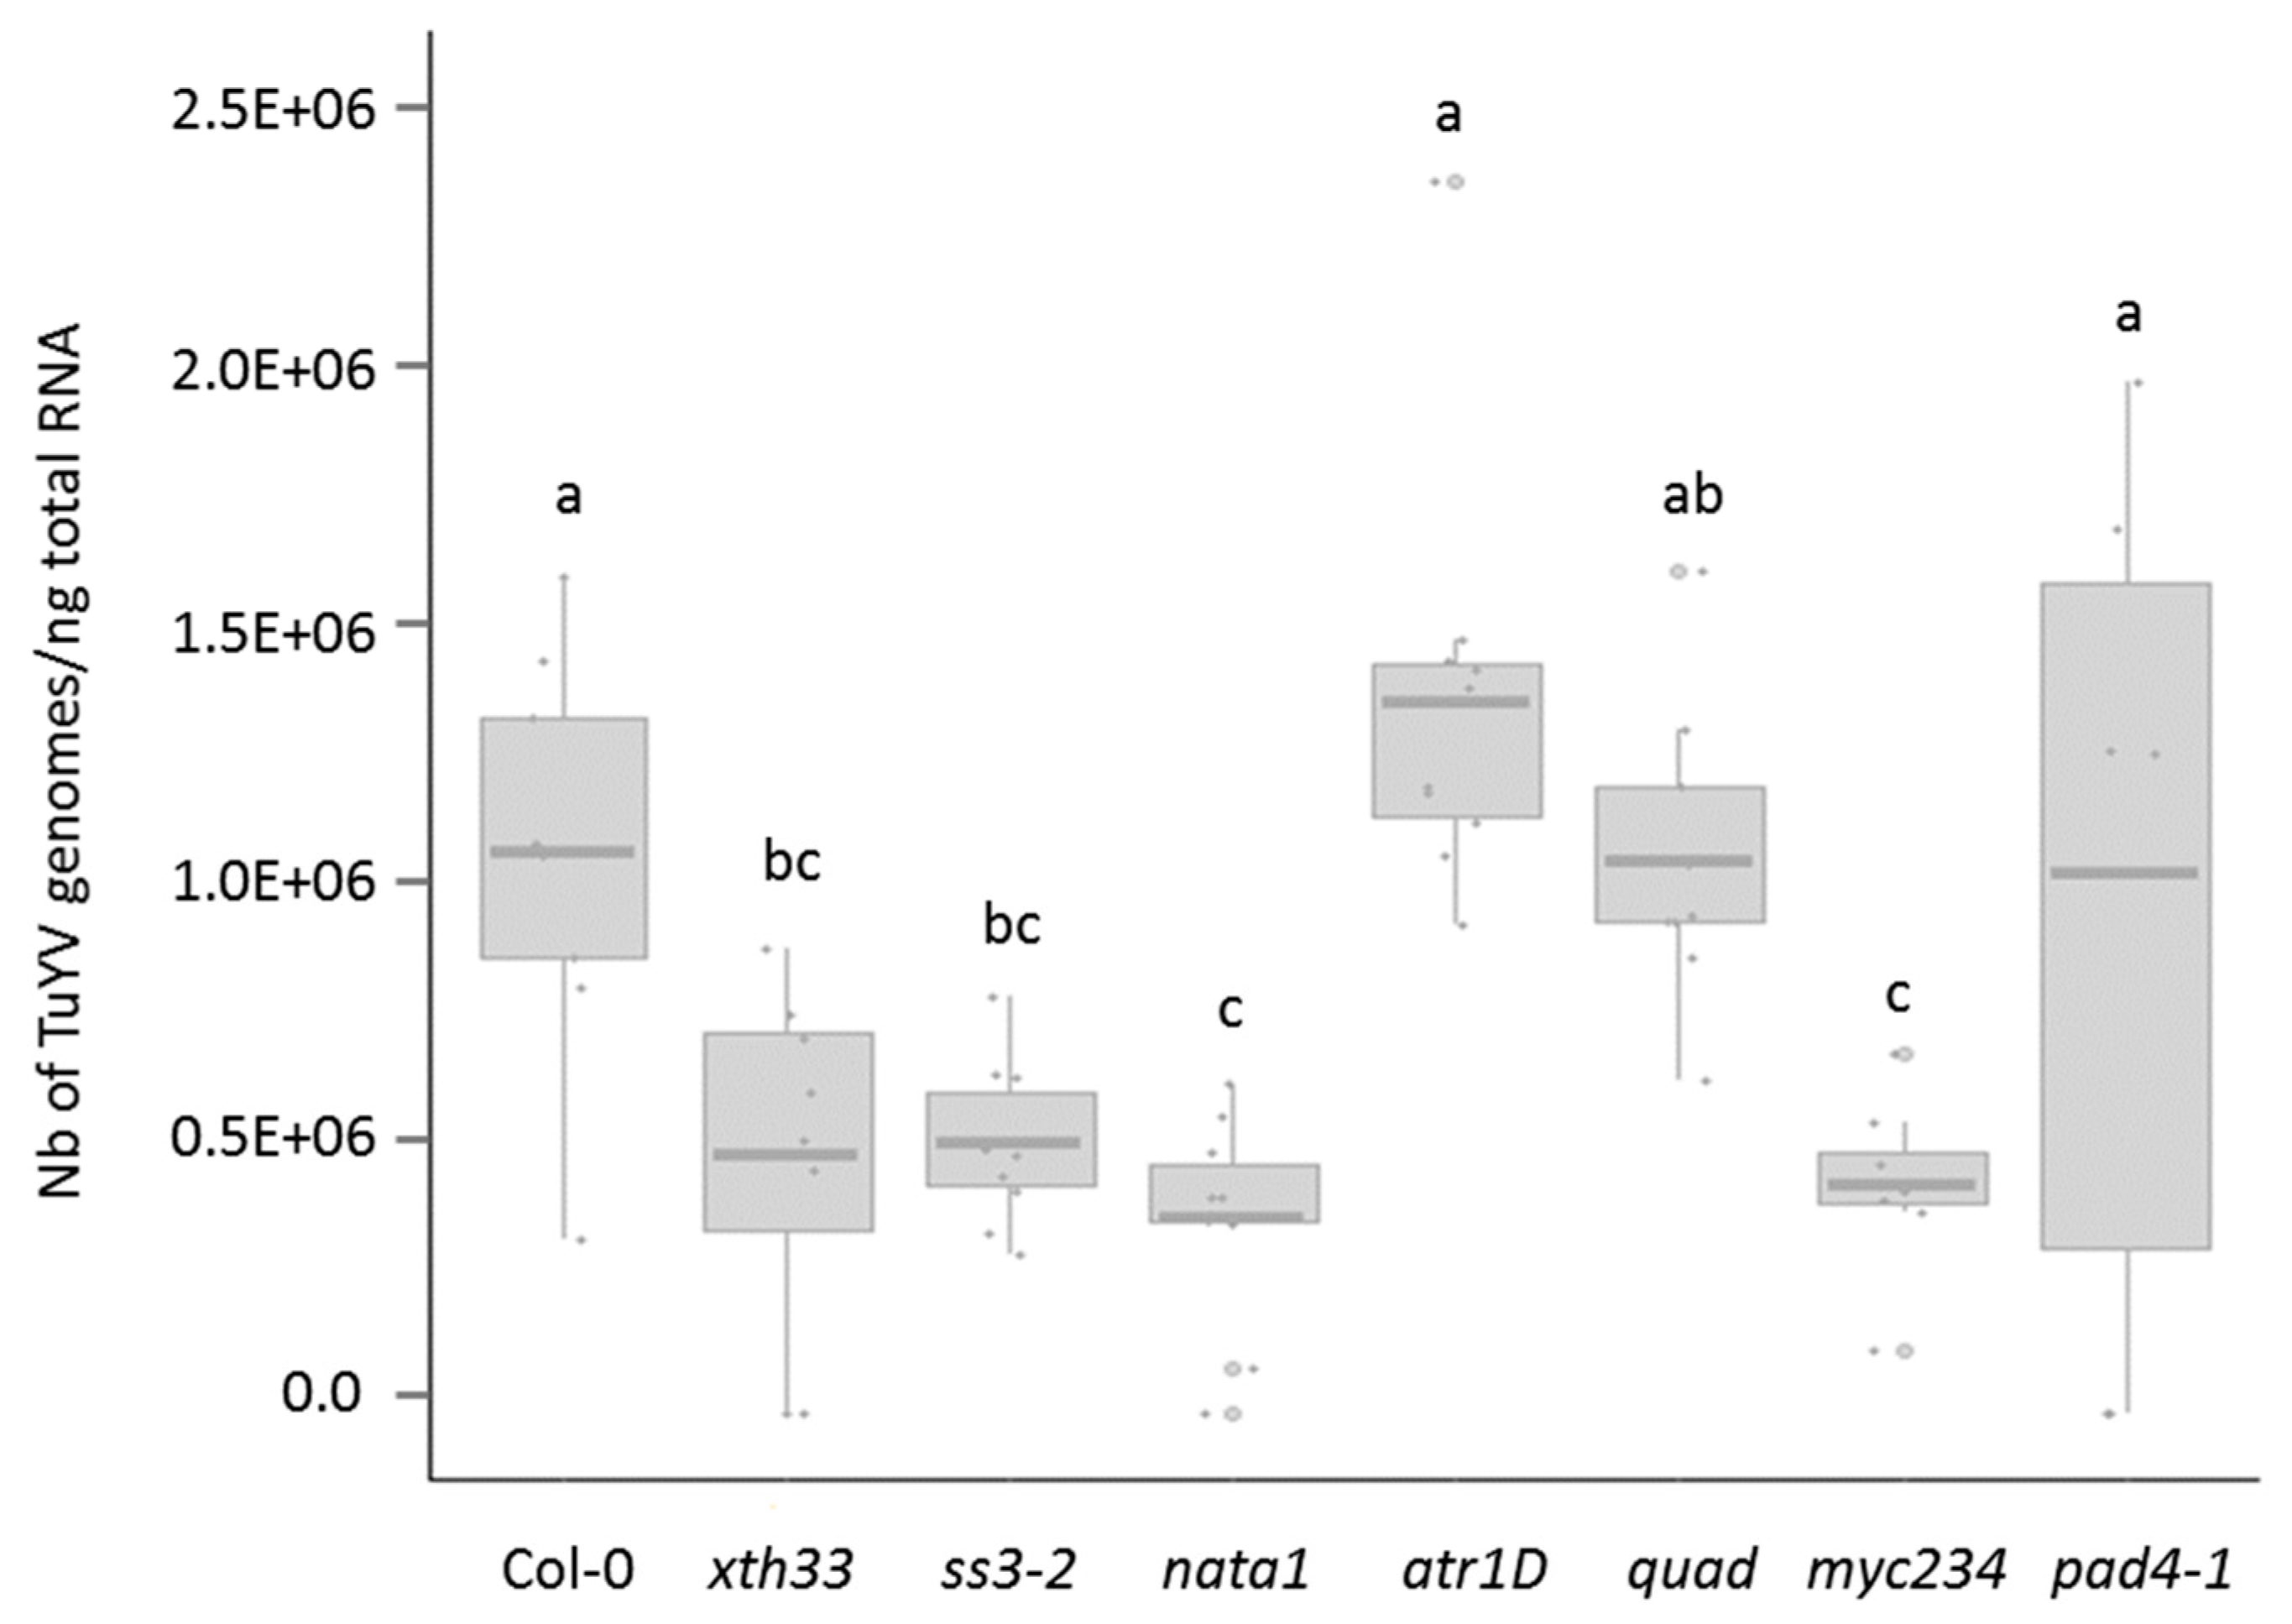
3.1. TuYV Infection Assay of the A. thaliana Mutant Lines

We selected mutant lines of A. thaliana affected in various metabolic pathways expected to influence aphid fitness and behavior. Some effects of the mutations on M. persicae were previously reported (Table 1). Two mutants were modified in the carbohydrate metabolism. xth33 bears a mutation in a gene involved in cell wall remodeling and ss3-2, which overaccumulates starch, a defense mechanism against M. persicae [44,45]. The nata1 mutant contains a mutation in a gene controlling the synthesis of a non-protein amino acid, Nδ-acetylornithine, which negatively impacts M. persicae when aphids acquire it from artificial medium or from plant leaves transiently expressing NATA1 [46]. Glucosinolates are secondary metabolites that have a defensive function against herbivorous insects. In particular, indole glucosinolates are reported to have a detrimental effect on aphids [14]. We tested three mutant lines affected in this pathway, myc234, quad, and atr1D. myc234 contains mutations in three transcription factors regulating jasmonic acid responses (MYC2, MYC3, and MYC4) [47] and the quad mutant contains mutations in two cytochrome P450s genes (CYP79B2 and CYP79B3) and two transcription factors, MYB28 and MYB29, resulting in very low glucosinolates containing plants [48,49]. Therefore, myc234 and quad mutants accumulate low levels of glucosinolates. In contrast, the overexpression of the MYB transcription factor ATR1, in the atr1D mutant, results in increased accumulation of indole glucosinolates [50]. PAD4 gene is part of a defense regulatory pathway against various pests and pathogens including M. persicae and the mutation in the pad4-1 mutant results in a phytoalexin-deficient mutant, which positively affects aphid performance and phloem activity [51,52]. None of the mutated plants exhibit abnormal growth and development when compared to Col-0.
The capacity of TuYV to infect the different mutant lines was addressed by inoculating young plants with viruliferous aphids. Since TuYV-infected Col-0 do not develop symptoms [57], all aphid-inoculated plants were assayed by DAS-ELISA three weeks later. All mutants became infected with TuYV suggesting that none of the mutations had a strong detrimental effect on TuYV infection (Table S2). TuYV accumulation was then measured by qRT-PCR on DAS-ELISA positive plants. Compared to Col-0, virus titers were similar in atr1D, quad, and pad4-1 and lower in xth33-1, ss3-2, nata1, and myc234 infected plants (Figure 1).

3.2. TuYV Transmission Efficiency by M. persicae from Infected atr1D, quad, myc234, and pad4-1 Mutants

In order to address whether TuYV titers in infected plant influence virus acquisition and transmission, TuYV transmissibility by aphids was analyzed using several infected mutant plants as the virus source: atr1D, quad, and pad4-1 in which virus accumulation was similar to Col-0 and myc234 which display a lower virus titer compared to Col-0 (Figure 1). Four virus transmission experiments by aphids were performed. In three experiments, the virus acquisition period was 24 h (Table 2, Exp. 1, 2, and 3) which is a duration commonly used in TuYV transmission assays [22]. A significative reduction in TuYV transmission efficiency was only observed when atr1D was used as the virus source (Table 2, Exp. 1 and 2). The fourth transmission experiment was conducted using a shorter virus acquisition period of 8 h to evaluate if the impact of a mutation was more visible by reducing the acquisition time (Table 2, Exp. 4). This experiment confirms the lower TuYV transmission efficiency when infected atr1D plants are used as virus source but in addition, a decreased transmission rate is observed when aphids feed on infected pad4-1 plants for 8 h and not for 24 h. The virus transmission efficiency is therefore not correlated to the virus accumulation in the plants since both mutants (atr1D and pad4-1) sustained similar levels of TuYV when compared to Col-0 (Figure 1). TuYV transmission efficiencies from infected quad or myc234 mutants are not significantly different from those of infected Col-0 plants (Table 2, Exp. 1, 2, 3 and 4) despite a reduced virus accumulation in myc234 (Figure 1).
In all four independent experiments, virus titers in atr1D, quad, myc234, and pad4-1 plants were not correlated to the virus transmission efficiency suggesting that additional factors influence virus uptake from the infected mutated plants.

3.3. Effect of the Mutations and TuYV Infection of A. thaliana on Phloem Feeding Activity of M. persicae

Considering that the phloem sap ingestion phase is a crucial step for virus acquisition and therefore transmission of the phloem-limited TuYV, we measured, using electropenetrograpghy (EPG), the duration of sap ingestion (s_E2). Additionally, the time aphids took to perform the first phloem sap ingestion phase (t > 1E2), was analyzed as this parameter reflects plant palatability and might also affect TuYV acquisition.
On non-infected plants, total duration of phloem sap ingestion on ss3-2 and myc234 mutants is longer relative to nata1 and the time until the first phloem sap ingestion is longer on nata1 when compared to myc234 (Table 3). In TuYV-infected plants, the phloem sap ingestion is longer on xth33 and myc234 relative to atr1D and pad4-1 mutants (Table 3). In infected plants, the time to first phloem sap ingestion is higher in nata1 and atr1D relative to xth33, ss3-2, and myc234 (Table 3).
These results suggest that the reduced phloem sap ingestion phase on infected atr1D and pad4-1 during the 8 h of EPG recording could be responsible for the lower virus transmission efficiency observed when infected mutant plants are used as virus source (Table 2). Similarly, the longer sap ingestion phase on infected myc234 could compensate the lower virus titer in this mutant and explain why TuYV is transmitted as efficiently from this mutant than from infected Col-0 plants (Table 2).
No significant differences are observed in the total duration of the phloem sap ingestion between non-infected and infected plants (mutants and the reference Col-0) (Table 2). In contrast, the time to reach the phloem is reduced in infected xth33 plants when compared to non-infected plants and increased in infected atr1D and quad plants when compared to corresponding non-infected mutant plants (Table 2).

3.4. Biomass of Aphids Raised on Non-Infected and TuYV-Infected A. thaliana Mutant Lines

Considering that the phloem sap ingestion phase is altered on several infected mutants, we analyzed whether these changes affect aphid biomass. We therefore analyzed the effect of A. thaliana mutations on aphid biomass, combined or not with TuYV infection. On non-infected plants and compared to Col-0, aphid biomass on ss3-2 and atr1D is not significantly different while the aphid weight is lower on xth33 and nata1 and higher on quad, myc234, and pad4-1 (Figure 2, light gray boxes). On TuYV-infected plants, the aphid biomass is not significantly different from the one on infected Col-0 for quad and pad4-1 but it is lower on xth33, ss3-2, nata1, atr1D, and myc234 (Figure 2, dark grey boxes). Except for the atr1D mutant for which a lower sap ingestion phase is observed together with a reduction in the aphid biomass when compared to Col-0, there is no correlation between the duration of the sap ingestion and the biomass for aphids fed on the other mutants.
Interestingly, when we compared the aphid weight between non-infected and TuYV-infected plants reared on the same A. thaliana line, a significant decrease is observed for all mutants while no difference is seen between infected and non-infected Col-0 plants (Figure 2, compare light and dark boxes).

4. Discussion

In this study, we addressed the effect of mutations in the A. thaliana genome on accumulation and aphid transmission of the phloem-limited TuYV, but also on aphid vector biomass and feeding behavior. The mutants are affected in different metabolic pathways and selected based on previous reports highlighting physiological and behavioral effects on aphids. This study is the first to address the combined effect of specific mutations in A. thaliana and TuYV infection on different aphid traits, biomass, and feeding activity. Two parameters related to phloem feeding phases were specifically selected, the total phloem sap ingestion duration and the time to the first sap ingestion phase, since both of them can potentially influence TuYV acquisition.
We observed that neither aphid performance nor feeding parameters are affected by TuYV infection in the wild-type context (Col-0). In contrast, in all mutants, the combined effect of the mutation and the infection effect aphid biomass, and in some of them, an additional effect on the feeding activity. This indicates that the virus infection interferes with several metabolic pathways that may impact aphid growth and feeding activity, as developed below. In the wild-type context (Col-0), the impact of the virus infection on several metabolic pathways can induce opposite effects on the aphids, which ultimately can result in a neutralization of these effects and no visible consequences on insect feeding or fitness parameters.

4.1. Effect of the Mutations and TuYV Infection on Aphid Feeding Activity

The XTH33 gene encodes a xyloglucan:xyloglucosyl transferase involved in cell wall remodeling. In a previous report, M. persicae preferred settling on A. thaliana xth33 mutant [44]. In our test conditions, aphids tended to feed more and reach the phloem faster on xth33, but only when the plants were infected. This suggests that in a non-mutated context (Col-0), and upon TuYV infection, this metabolic pathway could hinder aphid access to the phloem and reduce virus acquisition. We postulate that knocking out this pathway alleviates its negative effect on aphid feeding in infected plants. The second mutant in the carbohydrate metabolism is ss3-2, which overaccumulates starch and reduces M. persicae populations [53]. Reared on this mutant, aphids are faster in reaching the phloem vessels but only in infected plants. This suggests that overaccumulation of starch is not a barrier to stylet progression to the phloem.
In A. thaliana nata1 mutant, which is unable to synthesize the non-protein amino acid Nδ-acetylornithine [46], the phloem sap composition is altered. This non-proteinaceous amino acid is likely not metabolized by aphids. This compound is synthesized upon M. persicae infestation and has an in vitro toxic effect on sap-feeding insects including M. persicae [46]. We expected a beneficial effect (i.e., increased sap ingestion) on aphids feeding on nata1 because of the absence of this aphid defensive compound, but no such effect was observed. Surprisingly, in the infected nata1, the time to perform the first phloem phase increased, revealing a beneficial effect of this component on aphids in Col-0.
The effect of glucosinolates is addressed in this study using three A. thaliana mutants, which accumulate different levels of these compounds. Glucosinolates are secondary metabolites that are hydrolyzed into toxic compounds after tissue damage of generalist herbivores. They affect not only herbivores by also their natural enemies [58,59]. The over-expresser mutant atr1D accumulates higher amounts of indole glucosinolates [50] while myc234 and quad mutants sustain very low levels of glucosinolates [48,49]. The myc234 mutant is practically devoid of glucosinolates and only traces of two indole glucosinolates remain [48]. It was previously reported that the genetic suppression of MYC function in the myc234 mutant increases aphid attraction by releasing different volatiles and potentially also by modifying composition of plant metabolites [54]. In the quad mutant, the synthesis of both indole and aliphatic glucosinolates is impaired, but no impact on M. persicae population growth was reported [49,55]. Although M. persicae should not be in contact with vacuolar glucosinolates-hydrolyzing myrosinases when ingesting sap, indole glucosinolates are nonetheless degraded in the aphids and this degradation may be responsible for the deterrent effect of these compounds on aphids [14]. Supporting the role of indole glucosinolates in crucifer defense against aphids is their over-accumulation upon aphid infestation [13,15]. Our data showed a beneficial effect of low glucosinolates content only in myc234 plants in which aphids reach the phloem faster and feed longer both in non-infected and infected conditions. In accordance with the overaccumulation of indole glucosinolates in atr1D, access to the phloem and sap ingestion are both negatively impacted but only in infected plants.
PAD4 is a central player in the signaling defense pathway against pathogens including aphids, and PAD4 expression in A. thaliana is stimulated by M. persicae infestation [51]. In the phytoalexin-deficient mutant pad4-1 background, the aphid-induced senescence is inhibited resulting in a better aphid settling, feeding, and fecundity [12,52]. In contrast to these reports, we observed a reduced sap ingestion phase on pad4-1. The discrepancy in the results may be due to intrinsic differences in the aphid clones, but it is also conceivable that the increased sap ingestion observed on pad4-1 by Pegadaraju et al. [12] is due to an abnormal low phloem feeding activity of M. persicae on the reference Col-0 in this study. In our study, we observed an opposite effect of the mutation (reduced sap ingestion phase) but only upon virus infection.

4.2. Effect of the Mutations and TuYV Infection on Aphid Biomass

Aphid biomass on the A. thaliana mutants was not addressed before. As expected, M. persicae’s growth increases on non-infected pad4-1, which accumulates a low content of phytoalexins, and on quad and myc234, which are substantially deprived of glucosinolates. The aphid biomass on the other mutants is not related to the biological function of the mutated genes. However, regardless of the mutation in the A. thaliana genome, we always observe a reduction of the aphid biomass on infected mutant plants when compared to the non-infected mutants. This effect on aphid biomass was not clearly observed on Col-0 despite a slight, but not significant, reduction in aphid size. One hypothesis to explain this result is an additive effect of the virus infection and the mutations on aphid development. TuYV infection, together with the mutations in the different metabolic pathways, likely affect sap nutrient value and therefore aphid biomass. In this regard, the constitutive expression of the P4 protein from Potato leafroll virus (PLRV, Polerovirus, Luteoviridae) is reported to induce changes in carbohydrate status which could have consequences on the aphid biomass [60].
It is interesting to point out that the aphid weight measured on non-infected or infected mutants is not correlated to the duration of the sap ingestion. Indeed, no statistical differences in the sap ingestion phase were observed between non-infected and infected mutants whereas a significant reduction in the aphid biomass was visible with all infected mutated plants. This strongly suggests that nutritional quality of phloem sap contributes more to aphid biomass than the volume of sap ingested by aphids.

4.3. Impact of the Mutations on TuYV Transmission by Aphids

The impact of the mutations in atr1D, quad, myc234, and pad4-1 on TuYV transmission efficiency is addressed. Only the atr1D mutation has a reproducible negative effect on TuYV transmission by aphids regardless of the time of virus acquisition (8 or 24 h), while it has no effect on virus accumulation. A slight decrease in the virus transmission rate is also observed with pad4-1 but only when the acquisition time is 8 h. The reduced sap ingestion phase observed during the 8 h of recording on infected atr1D and pad4-1 could be responsible for a lower virus uptake, and subsequently, a reduced TuYV transmission. It is conceivable that the decreased sap ingestion observed on pad4-1 during the first eight hours of feeding is transient and that the expected beneficial effect of the absence of phytoalexins in this mutant sets in only later. This delay would explain why an effect on virus transmission was observed after a virus acquisition period of 8 h but not 24 h. In the case of atr1D, it is also possible that the higher content of indole glucosinolates influences virus uptake, internalization into intestinal cells or even virus inoculation into test plants. Detection of plant glucosinolates in aphids [61] suggests that they could exert their negative effect also in the aphid’s body by altering virus transport from the digestive tube to the accessory salivary glands.
Lastly, our study also suggests that the time required to perform the first phloem sap ingestion phase, which is extended in atr1D, could be a more important factor for virus uptake than expected. Hindrance during phloem access could discourage aphids to ingest sap as they normally do, and this could limit virus acquisition.

5. Conclusions

In this work, we addressed the effect of different mutations affecting several plant biological pathways known to influence aphid performance and behavior. We observed that virus infection and most mutations have cumulative effects and induce a biomass reduction of aphids suggesting that the deregulations triggered by TuYV infection also impact the biological pathways targeted by the mutations. It is however conceivable that the infection activates plant defense responses which, in combination with the mutations, affects aphid traits. The mutations in myc234 result in an increased phloem sap ingestion and a faster phloem access, but no beneficial effect on virus transmission was observed in our experimental conditions, maybe because of the low virus accumulation in this mutant. A completely adverse situation was observed in atr1D mutant with reduced sap ingestion and a delayed phloem access leading to a decreased virus transmission (Figure 3). This result highlights a negative effect of the overexpression of ATR1D on virus transmission. It is interesting to point out that expression of this gene is reduced in TuYV-infected Col-0 that are infested for 6 h with non-viruliferous aphids while no such deregulation was observed in plants solely infected with the virus or solely infested with aphids (Krieger and Ziegler-Graff, unpublished). Such gene downregulation in the condition of virus infection and aphid infestation could indicate a plant manipulation by the virus upon aphid infestation. However, this assumption requires extensive studies to be confirmed. This work points the way towards the identification of metabolic pathways which could be potential targets to reduce virus acquisition by aphids, and as a consequence, virus propagation among plants.

Supplementary Materials

The following are available online at https://www.mdpi.com/1999-4915/12/2/146/s1, Table S1: Primer sequences; Table S2: TuYV infection of A. thaliana mutant lines; Table S3: TuYV titer measured by qRT-PCR in infected A. thaliana mutants quad, pad4-1, and atr1D plants used as virus source in a virus transmission experiment (Exp. 1, Table 3); Table S4: TuYV accumulation measured by ELISA in infected A. thaliana mutants quad, atr1D, and myc234 plants used as virus source in virus transmission experiments (Exp. 2 and 3, Table 3); Table S5: TuYV titer measured by qRT-PCR in infected A. thaliana mutants quad, pad4-1, and atr1D plants used as virus source in a virus transmission experiment (Exp. 4, Table 3).

Author Contributions

Conceptualization, V.B. and V.Z.-G.; methodology, F.B., S.B., A.M., and E.P.; formal analysis, F.B., Q.C., and V.B.; investigation, F.B., S.B., A.M., E.P., and C.V.; writing—original draft preparation, V.B., F.B., A.M., S.B., and V.Z.-G.; writing—review and editing, V.B., F.B., A.M., S.B., V.Z.-G., Q.C., and M.D. All authors have read and agreed to the published version of the manuscript.

Funding

This research was funded by The French National Agency (ANR). Project VIRAPHIPLANT ANR-14-CE19-0010-01. This project also received support from HFSP research grant RGP0013/2015.

Acknowledgments

Judith Bender, Georg Jander, and Philippe Reymond, are acknowledged for the gift of seeds. Members of the experimental unit of INRA-Colmar (France) are acknowledged for the plant production.

Conflicts of Interest

The authors declare no conflicts of interest. The funders had no role in the design of the study, in the analyses, or interpretation of data; in the writing of the manuscript, or in the decision to publish the results.

References

  1. Blackman, R.L.; Eastop, V.F. Aphids on the World’s Crops: An Identification and Information Guide, 2nd ed.; Wiley: Chichester, UK, 2000; 466p. [Google Scholar]
  2. Chaudhary, R.; Atamian, H.S.; Shen, Z.; Briggs, S.P.; Kaloshian, I. GroEL from the endosymbiont Buchnera aphidicola betrays the aphid by triggering plant defense. Proc. Natl. Acad. Sci. USA 2014, 111, 8919–8924. [Google Scholar] [CrossRef] [PubMed] [Green Version]
  3. De Vos, M.; Jander, G. Myzus persicae (green peach aphid) salivary components induce defence responses in Arabidopsis thaliana. Plant Cell Environ. 2009, 32, 1548–1560. [Google Scholar] [CrossRef] [PubMed]
  4. Elzinga, D.A.; De Vos, M.; Jander, G. Suppression of plant defenses by a Myzus persicae (green peach aphid) salivary effector protein. Mol. Plant Microbe Interact. 2014, 27, 747–756. [Google Scholar] [CrossRef] [Green Version]
  5. Thompson, G.A.; Goggin, F.L. Transcriptomics and functional genomics of plant defence induction by phloem-feeding insects. J. Exp. Bot. 2006, 57, 755–766. [Google Scholar] [CrossRef] [Green Version]
  6. Jaouannet, M.; Rodriguez, P.A.; Thorpe, P.; Lenoir, C.J.; MacLeod, R.; Escudero-Martinez, C.; Bos, J.I. Plant immunity in plant-aphid interactions. Front. Plant Sci. 2014, 5, 663. [Google Scholar] [CrossRef] [Green Version]
  7. Louis, J.; Shah, J. Arabidopsis thaliana-Myzus persicae interaction: Shaping the understanding of plant defense against phloem-feeding aphids. Front. Plant Sci. 2013, 4, 213. [Google Scholar] [CrossRef] [Green Version]
  8. Nalam, V.; Louis, J.; Shah, J. Plant defense against aphids, the pest extraordinaire. Plant Sci. 2019, 279, 96–107. [Google Scholar] [CrossRef]
  9. Rodriguez, P.A.; Bos, J.I. Toward understanding the role of aphid effectors in plant infestation. Mol. Plant Microbe Interact. 2013, 26, 25–30. [Google Scholar] [CrossRef] [Green Version]
  10. Kettles, G.J.; Drurey, C.; Schoonbeek, H.J.; Maule, A.J.; Hogenhout, S.A. Resistance of Arabidopsis thaliana to the green peach aphid, Myzus persicae, involves camalexin and is regulated by microRNAs. New Phytol. 2013, 198, 1178–1190. [Google Scholar] [CrossRef] [Green Version]
  11. Louis, J.; Leung, Q.; Pegadaraju, V.; Reese, J.; Shah, J. PAD4-dependent antibiosis contributes to the ssi2-conferred hyper-resistance to the green peach aphid. Mol. Plant Microbe Interact. 2010, 23, 618–627. [Google Scholar] [CrossRef] [Green Version]
  12. Pegadaraju, V.; Louis, J.; Singh, V.; Reese, J.C.; Bautor, J.; Feys, B.J.; Cook, G.; Parker, J.E.; Shah, J. Phloem-based resistance to green peach aphid is controlled by Arabidopsis PHYTOALEXIN DEFICIENT4 without its signaling partner ENHANCED DISEASE SUSCEPTIBILITY1. Plant J. 2007, 52, 332–341. [Google Scholar] [CrossRef] [PubMed]
  13. Kim, J.H.; Jander, G. Myzus persicae (green peach aphid) feeding on Arabidopsis induces the formation of a deterrent indole glucosinolate. Plant J. 2007, 49, 1008–1019. [Google Scholar] [CrossRef] [PubMed]
  14. Kim, J.H.; Lee, B.W.; Schroeder, F.C.; Jander, G. Identification of indole glucosinolate breakdown products with antifeedant effects on Myzus persicae (green peach aphid). Plant J. 2008, 54, 1015–1026. [Google Scholar] [CrossRef] [PubMed]
  15. Mewis, I.; Tokuhisa, J.G.; Schultz, J.C.; Appel, H.M.; Ulrichs, C.; Gershenzon, J. Gene expression and glucosinolate accumulation in Arabidopsis thaliana in response to generalist and specialist herbivores of different feeding guilds and the role of defense signaling pathways. Phytochemistry 2006, 67, 2450–2462. [Google Scholar] [CrossRef]
  16. Brault, V.; Uzest, M.; Monsion, B.; Jacquot, E.; Blanc, S. Aphids as transport devices for plant viruses. C. R. Biol. 2010, 333, 524–538. [Google Scholar] [CrossRef]
  17. Mulot, M.; Monsion, B.; Boissinot, S.; Rastegar, M.; Meyer, S.; Bochet, N.; Brault, V. Transmission of Turnip yellows virus by Myzus persicae Is Reduced by Feeding Aphids on Double-Stranded RNA Targeting the Ephrin Receptor Protein. Front. Microbiol. 2018, 9, 457. [Google Scholar] [CrossRef] [Green Version]
  18. Gildow, F. Luteovirus transmission mechanisms regulating vector specificity. In The Luteoviridae; Smith, H.G., Barker, H., Eds.; CAB International: Oxon, UK, 1999; pp. 88–111. [Google Scholar]
  19. Dader, B.; Then, C.; Berthelot, E.; Ducousso, M.; Ng, J.C.K.; Drucker, M. Insect transmission of plant viruses: Multilayered interactions optimize viral propagation. Insect Sci. 2017, 24, 929–946. [Google Scholar] [CrossRef]
  20. Mauck, K.E.; Chesnais, Q.; Shapiro, L.R. Evolutionary determinants of host and vector manipulation by plant viruses. Adv. Virus Res. 2018, 101, 189–250. [Google Scholar] [CrossRef]
  21. Holopainen, J.K.; Semiz, G.; Blande, J.D. Life-history strategies affect aphid preference for yellowing leaves. Biol. Lett. 2009, 5, 603–605. [Google Scholar] [CrossRef] [Green Version]
  22. Bruyère, A.; Brault, V.; Ziegler-Graff, V.; Simonis, M.T.; Van den Heuvel, J.F.; Richards, K.; Guilley, H.; Jonard, G.; Herrbach, E. Effects of mutations in the beet western yellows virus readthrough protein on its expression and packaging and on virus accumulation, symptoms, and aphid transmission. Virology 1997, 230, 323–334. [Google Scholar] [CrossRef] [Green Version]
  23. Wang, J.Y.; Chay, C.; Gildow, F.E.; Gray, S.M. Readthrough protein associated with virions of barley yellow dwarf luteovirus and its potential role in regulating the efficiency of aphid transmission. Virology 1995, 206, 954–962. [Google Scholar] [CrossRef] [PubMed] [Green Version]
  24. Claudel, P.; Chesnais, Q.; Fouche, Q.; Krieger, C.; Halter, D.; Bogaert, F.; Meyer, S.; Boissinot, S.; Hugueney, P.; Ziegler-Graff, V.; et al. The Aphid-Transmitted Turnip yellows virus Differentially Affects Volatiles Emission and Subsequent Vector Behavior in Two Brassicaceae Plants. Int. J. Mol. Sci. 2018, 19, 2316. [Google Scholar] [CrossRef] [PubMed] [Green Version]
  25. Eigenbrode, S.D.; Ding, H.; Shiel, P.; Berger, P.H. Volatiles from potato plants infected with potato leafroll virus attract and arrest the virus vector, Myzus persicae (Homoptera: Aphididae). Proc. Biol. Sci. 2002, 269, 455–460. [Google Scholar] [CrossRef] [PubMed] [Green Version]
  26. Carmo-Sousa, M.; Moreno, A.; Plaza, M.; Garzo, E.; Fereres, A. Cucurbit aphid-borne yellows virus (CABYV) modifies the alighting, settling and probing behaviour of its vector Aphis gossypii favouring its own spread. Ann. Appl. Biol. 2016, 169, 284–297. [Google Scholar] [CrossRef]
  27. Chesnais, Q.; Couty, A.; Uzest, M.; Brault, V.; Ameline, A. Plant infection by two different viruses induce contrasting changes of vectors fitness and behavior. Insect Sci. 2019, 26, 86–96. [Google Scholar] [CrossRef] [Green Version]
  28. Ingwell, L.L.; Eigenbrode, S.D.; Bosque-Perez, N.A. Plant viruses alter insect behavior to enhance their spread. Sci. Rep. 2012, 2, 578. [Google Scholar] [CrossRef] [Green Version]
  29. Rajabaskar, D.; Bosque-Perez, N.A.; Eigenbrode, S.D. Preference by a virus vector for infected plants is reversed after virus acquisition. Virus Res. 2014, 186, 32–37. [Google Scholar] [CrossRef]
  30. Carr, J.P.; Murphy, A.M.; Tungadi, T.; Yoon, J.Y. Plant defense signals: Players and pawns in plant-virus-vector interactions. Plant Sci. 2019, 279, 87–95. [Google Scholar] [CrossRef]
  31. Hillung, J.; Garcia-Garcia, F.; Dopazo, J.; Cuevas, J.M.; Elena, S.F. The transcriptomics of an experimentally evolved plant-virus interaction. Sci. Rep. 2016, 6, 24901. [Google Scholar] [CrossRef] [Green Version]
  32. Whitham, S.A.; Yang, C.; Goodin, M.M. Global impact: Elucidating plant responses to viral infection. Mol. Plant Microbe Interact. 2006, 19, 1207–1215. [Google Scholar] [CrossRef] [Green Version]
  33. Mauck, K.E.; Kenney, J.; Chesnais, Q. Progress and challenges in identifying molecular mechanisms underlying host and vector manipulation by plant viruses. Curr. Opin. Insect Sci. 2019, 33, 7–18. [Google Scholar] [CrossRef] [PubMed]
  34. Patton, M.F.; Bak, A.; Sayre, J.; Heck, M.; Casteel, C.L. A polerovirus, Potato Leafroll virus, alters plant-vector interactions using three viral proteins. Plant Cell Environ. 2020, 2020 43, 387–399. [Google Scholar] [CrossRef]
  35. Guo, H.; Gu, L.; Liu, F.; Chen, F.; Ge, F.; Sun, Y. Aphid-borne Viral Spread Is Enhanced by Virus-induced Accumulation of Plant Reactive Oxygen Species. Plant Physiol. 2019, 179, 143–155. [Google Scholar] [CrossRef] [PubMed] [Green Version]
  36. Bak, A.; Patton, M.F.; Perilla-Henao, L.M.; Aegerter, B.J.; Casteel, C.L. Ethylene signaling mediates potyvirus spread by aphid vectors. Oecologia 2019, 190, 139–148. [Google Scholar] [CrossRef] [PubMed]
  37. Casteel, C.L.; De Alwis, M.; Bak, A.; Dong, H.; Whitham, S.A.; Jander, G. Disruption of Ethylene Responses by Turnip mosaic virus Mediates Suppression of Plant Defense against the Green Peach Aphid Vector. Plant Physiol. 2015, 169, 209–218. [Google Scholar] [CrossRef] [PubMed] [Green Version]
  38. Casteel, C.L.; Yang, C.; Nanduri, A.C.; De Jong, H.N.; Whitham, S.A.; Jander, G. The NIa-Pro protein of Turnip mosaic virus improves growth and reproduction of the aphid vector, Myzus persicae (green peach aphid). Plant J. 2014, 77, 653–663. [Google Scholar] [CrossRef]
  39. Bak, A.; Cheung, A.L.; Yang, C.; Whitham, S.A.; Casteel, C.L. A viral protease relocalizes in the presence of the vector to promote vector performance. Nat. Commun. 2017, 8, 14493. [Google Scholar] [CrossRef]
  40. Van den Heuvel, J.F.; Boerma, T.M.; Peters, D. Transmission of potato leafroll virus from plants and artificial diets by Myzus persicae. Phytopathology 1991, 81, 150–154. [Google Scholar] [CrossRef]
  41. Clark, M.F.; Adams, A.N. Characteristics of the microplate method of enzyme-linked immunosorbent assay for the detection of plant viruses. J. Gen. Virol. 1977, 34, 475–483. [Google Scholar] [CrossRef]
  42. Tjallingii, W.F. Membrane potentials as an indication for plant cell penetration by aphid stylets. Entomol. Exp. Appl. 1985, 38, 187–193. [Google Scholar] [CrossRef]
  43. Tjallingii, W.F.; Hogen Esch, T. Fine structure of aphid stylet routes in plant tissues in correlation with EPG signals. Physiol. Entomol. 1993, 18, 317–328. [Google Scholar] [CrossRef]
  44. Divol, F.; Vilaine, F.; Thibivilliers, S.; Kusiak, C.; Sauge, M.H.; Dinant, S. Involvement of the xyloglucan endotransglycosylase/hydrolases encoded by celery XTH1 and Arabidopsis XTH33 in the phloem response to aphids. Plant Cell Environ. 2007, 30, 187–201. [Google Scholar] [CrossRef] [PubMed]
  45. Zhang, X.; Myers, A.M.; James, M.G. Mutations affecting starch synthase III in Arabidopsis alter leaf starch structure and increase the rate of starch synthesis. Plant Physiol. 2005, 138, 663–674. [Google Scholar] [CrossRef] [PubMed] [Green Version]
  46. Adio, A.M.; Casteel, C.L.; De Vos, M.; Kim, J.H.; Joshi, V.; Li, B.; Juery, C.; Daron, J.; Kliebenstein, D.J.; Jander, G. Biosynthesis and defensive function of Ndelta-acetylornithine, a jasmonate-induced Arabidopsis metabolite. Plant Cell 2011, 23, 3303–3318. [Google Scholar] [CrossRef] [PubMed] [Green Version]
  47. Fernandez-Calvo, P.; Chini, A.; Fernandez-Barbero, G.; Chico, J.M.; Gimenez-Ibanez, S.; Geerinck, J.; Eeckhout, D.; Schweizer, F.; Godoy, M.; Franco-Zorrilla, J.M.; et al. The Arabidopsis bHLH transcription factors MYC3 and MYC4 are targets of JAZ repressors and act additively with MYC2 in the activation of jasmonate responses. Plant Cell 2011, 23, 701–715. [Google Scholar] [CrossRef] [PubMed] [Green Version]
  48. Schweizer, F.; Fernandez-Calvo, P.; Zander, M.; Diez-Diaz, M.; Fonseca, S.; Glauser, G.; Lewsey, M.G.; Ecker, J.R.; Solano, R.; Reymond, P. Arabidopsis basic helix-loop-helix transcription factors MYC2, MYC3, and MYC4 regulate glucosinolate biosynthesis, insect performance, and feeding behavior. Plant Cell 2013, 25, 3117–3132. [Google Scholar] [CrossRef] [PubMed] [Green Version]
  49. Sun, J.Y.; Sonderby, I.E.; Halkier, B.A.; Jander, G.; de Vos, M. Non-volatile intact indole glucosinolates are host recognition cues for ovipositing Plutella xylostella. J. Chem. Ecol. 2009, 35, 1427–1436. [Google Scholar] [CrossRef]
  50. Celenza, J.L.; Quiel, J.A.; Smolen, G.A.; Merrikh, H.; Silvestro, A.R.; Normanly, J.; Bender, J. The Arabidopsis ATR1 Myb transcription factor controls indolic glucosinolate homeostasis. Plant Physiol. 2005, 137, 253–262. [Google Scholar] [CrossRef] [Green Version]
  51. Louis, J.; Shah, J. Plant defence against aphids: The PAD4 signalling nexus. J. Exp. Bot. 2015, 66, 449–454. [Google Scholar] [CrossRef]
  52. Pegadaraju, V.; Knepper, C.; Reese, J.; Shah, J. Premature leaf senescence modulated by the Arabidopsis PHYTOALEXIN DEFICIENT4 gene is associated with defense against the phloem-feeding green peach aphid. Plant Physiol. 2005, 139, 1927–1934. [Google Scholar] [CrossRef] [Green Version]
  53. Singh, V. Studies on Plant-Aphid Interactions: A Novel Role for Trehalose Metabolism in Arabidopsis Defense Against Green Peach Aphid. Dissertation, University of North Texas, Denton, TX, USA, 2012; 136p. [Google Scholar]
  54. Wu, D.; Qi, T.; Li, W.X.; Tian, H.; Gao, H.; Wang, J.; Ge, J.; Yao, R.; Ren, C.; Wang, X.B.; et al. Viral effector protein manipulates host hormone signaling to attract insect vectors. Cell Res. 2017, 27, 402–415. [Google Scholar] [CrossRef] [PubMed]
  55. Smith, J.D.; Woldemariam, M.G.; Mescher, M.C.; Jander, G.; De Moraes, C.M. Glucosinolates from Host Plants Influence Growth of the Parasitic Plant Cuscuta gronovii and Its Susceptibility to Aphid Feeding. Plant Physiol 2016, 172, 181–197. [Google Scholar] [CrossRef] [Green Version]
  56. Bender, J.; Fink, G.R. A Myb homologue, ATR1, activates tryptophan gene expression in Arabidopsis. Proc. Natl. Acad. Sci. USA 1998, 95, 5655–5660. [Google Scholar] [CrossRef] [PubMed] [Green Version]
  57. Bortolamiol-Becet, D.; Monsion, B.; Chapuis, S.; Hleibieh, K.; Scheidecker, D.; Alioua, A.; Bogaert, F.; Revers, F.; Brault, V.; Ziegler-Graff, V. Phloem-Triggered Virus-Induced Gene Silencing Using a Recombinant Polerovirus. Front. Microbiol. 2018, 9, 2449. [Google Scholar] [CrossRef] [PubMed]
  58. Kos, M.; Houshyani, B.; Achhami, B.B.; Wietsma, R.; Gols, R.; Weldegergis, B.T.; Kabouw, P.; Bouwmeester, H.J.; Vet, L.E.; Dicke, M.; et al. Herbivore-mediated effects of glucosinolates on different natural enemies of a specialist aphid. J. Chem. Ecol. 2012, 38, 100–115. [Google Scholar] [CrossRef] [PubMed] [Green Version]
  59. Kos, M.; Houshyani, B.; Wietsma, R.; Kabouw, P.; Vet, L.E.; van Loon, J.J.; Dicke, M. Effects of glucosinolates on a generalist and specialist leaf-chewing herbivore and an associated parasitoid. Phytochemistry 2012, 77, 162–170. [Google Scholar] [CrossRef] [PubMed] [Green Version]
  60. Hofius, D.; Herbers, K.; Melzer, M.; Omid, A.; Tacke, E.; Wolf, S.; Sonnewald, U. Evidence for expression level-dependent modulation of carbohydrate status and viral resistance by the potato leafroll virus movement protein in transgenic tobacco plants. Plant J. 2001, 28, 529–543. [Google Scholar] [CrossRef]
  61. Madsen, S.R.; Kunert, G.; Reichelt, M.; Gershenzon, J.; Halkier, B.A. Feeding on Leaves of the Glucosinolate Transporter Mutant gtr1gtr2 Reduces Fitness of Myzus persicae. J. Chem. Ecol. 2015, 41, 975–984. [Google Scholar] [CrossRef] [Green Version]
Figure 1. TuYV accumulation in A. thaliana mutant lines is assessed by qRT-PCR. The number of TuYV genome copies are normalized to ng of total plant RNA. This graph represents one experiment in which all plants are grown simultaneously and inoculated with viruliferous aphids from the same batch. Each dot corresponds to a plant sample. Box plots show median (line), 25%–75% percentiles (box) and 10%–90% percentiles (whiskers). TuYV accumulation varies with A. thaliana mutant lines (generalized linear model (GLM), df = 64, F = −10.38, p < 0.001). Letters show significant differences between plants as tested with a GLM followed by pairwise comparisons using estimated marginal means (Tukey’s method). Eight to ten plants per accession are tested in technical triplicates. Each point corresponds to the mean of the triplicates.
Viruses 12 00146 g001
Figure 2. Myzus persicae biomass 10 days after feeding on non-infected (light grey) or TuYV-infected (dark grey) A. thaliana mutants, or on wild-type Col-0. Box plots show median (line), 25%–75% percentiles (box), and 10%–90% percentiles (whisker). Aphid biomass varied with the A. thaliana mutant lines and infection status (GLM, p < 0.001 for both factors). The asterisks indicate significant biomass differences of aphids raised on TuYV-infected and non-infected plants of the same mutant line (* p < 0.05, *** p < 0.001; NS, not significant). Letters indicate significant differences between plant genotypes obtained by GLM analysis followed by pairwise comparisons using least-squares means (lowercase letters for non-infected plants, capital letters for TuYV-infected plants).
Viruses 12 00146 g002
Figure 3. Schematic representation of the combined effect of A. thaliana mutations and TuYV infection on phloem sap ingestion, time until the first sap ingestion phase, and virus transmission. Black stars stand for the effect of the mutation in TuYV-infected A. thaliana when compared to the reference Col-0 represented by a dashed line. When the stars are above the line, the parameter values observed for the mutants are higher than those for Col-0 and when the stars are below the line, the values are lower than those for Col-0. In grey is a zone that potentially represents beneficial conditions for virus acquisition (long sap ingestion and short delay to perform the first sap ingestion phase). The dotted line area symbolizes a zone not favorable for virus acquisition with reduced sap ingestion and increased time until the first sap ingestion phase.
Viruses 12 00146 g003
Table 1. Myzus persicae fitness and behavior on the A. thaliana mutants used in this study.
Gene NumberMutantGene NameEffects on M. persicae Observed on the Corresponding MutantReferences
At1g10550xth33xyloglucan:xyloglucosyl transferase33Settling preference.[44]
At1g11720ss3-2starch synthase IIIReduced population.[45,53]
At2g39030nata1Gcn5-related N-acetyltransferaseReduced aphid progeny when Nδ-acetylornithine was added to an artificial medium or when transiently produced in leaves.
No effect on aphids when NATA1 is expressed in transgenic plants.
[46]
At1g32640
At5g46760
At4g17880
myc234MYC2, MYC3, MYC4Higher aphid attractiveness.[47,54]
At2g22330
At4g39950
At5g61420
At5g07690
quadglucosinolate quadruple mutantNo increase of aphid population.[49,55]
At5g60890atr1Daltered tryptophan regulation 1Decreased aphid reproduction at the rosette stage.
No increase of aphid population.
[50,55,56]
At3g52430pad4-1phytoalexin-deficient 4Better feeding activity and enhanced susceptibility to aphids.[12,52]
Table 2. TuYV transmission efficiency from infected A. thaliana mutants atr1D, quad, myc234, and pad4-1.
Virus Source PlantExp. 1 1Exp. 2 2Exp. 3 2Exp. 4 3
atr1D23/60 4 (38.33%) a 526/45 (57.70%) a/41/60 (68.33%) a
Quad43/60 (71.67%) b41/45 (91.11%) b/48/60 (80.00%) b
myc234//16/20 (80.00%)
pad4-143/60 (71.67%) b//42/60 (70.00%) a
Col-049/60 (81.67%) b42/43 (93.33%) b18/20 (90.00%)53/60 (88.33%) b
1 The virus titer of the source plants is presented in Table S3. 2 The virus titer of the source plants is presented in Table S4. 3 The virus titer of the source plants is presented in Table S5. 4 Number of infected test plants (Col-0) assayed by DAS-ELISA/total number of plants inoculated with viruliferous aphids. A plant is considered infected when the OD (optical density) value of the leaf extract is above twice the mean OD values of three non-infected plants plus three times the standard deviation of these values. 5 Letters indicate significant differences between plant genotypes obtained by Pearson’s Chi-squared tests (χ2 = 28.67, df = 3, p < 0.001; χ2 = 27.52, df = 2, p < 0.001; χ2 = 0.20, df = 1, p = 0.658; and χ2 = 0.76, df = 3, p = 0.033 for experiments 1, 2, 3, and 4, respectively) followed by pairwise comparisons.
Table 3. Feeding behavior of M. persicae on non-infected and TuYV-infected A. thaliana mutants.
Col-0xth33ss3-2nata1atr1Dquadmyc234pad4-1
s_E2 (min) 2n11918201821202220
non-inf.199.54 ± 30.02 ab 254.72 ± 33.76 ab274.05 ± 30.95 a129.09 ± 23.14 b183.04 ± 27.83 ab292.55 ± 26.18 ab277.90 ± 20.16 a165.82 ± 24.88 ab
TuYV-infected229.09 ± 30.74 AB268.44 ± 27.88 A227.06 ± 23.97AB182.61 ± 36.73 AB139.60 ± 33.79 B154.84 ± 28.87 AB265.82 ± 26.07 A132.28 ± 24.63 B
non-inf. versus inf.nsnsnsnsnsnsnsns
t > 1E2 (min) 3n1822201718202020
non-inf.167.14 ± 23.47 ab134.49 ± 35.50 ab104.73 ± 16.21 ab181.67 ± 31.40 a179.15 ± 22.98 ab108.19 ± 21.26 ab130.94 ± 17.95 b167.43 ± 28.20 ab
TuYV-infected162.55 ± 25.99 AB105.71 ± 14.00 B131.53 ± 25.95 B287.20 ± 31.67 A218.47 ± 36.48 A218.12 ± 39.56 AB108.96 ± 17.86 B108.34 ± 25.38 AB
non-inf. versus inf.ns*nsns***nsns
1 n: number of individuals for which the parameter was recorded. 2 s_E2: total duration of phloem sap ingestion. Phloem sap ingestion varies according to the A. thaliana mutant lines (GLM, p < 0.001) but not the infection status (p > 0.05). Letters indicate significant differences between plant genotypes obtained by GLM analysis followed by pairwise comparisons using least-squares means (lowercase letters for non-infected plants, capital letters for TuYV-infected plants). 3 t > 1E2: time to first phloem sap ingestion. Time to the first phloem sap ingestion varies according to the A. thaliana mutant lines (Cox model, p < 0.001) but not the infection status (p = 0.33). Letters indicate significant differences between plant genotypes obtained by GLM analysis followed by pairwise comparisons using least-squares means (lowercase letters for non-infected plants, capital letters for TuYV-infected plants). Dark grey boxes highlight significant different values of parameters with a potential beneficial effect on virus acquisition and light grey boxes highlight significant different values of parameters with a potential negative effect on virus acquisition. The asterisks indicate a significant difference between TuYV-infected and non-infected plants (* p < 0.05, ** p < 0.01; ns, not significant).

