
Abstract
Forming processes of continuous fiber reinforced thermoplastic materials are oftentimes limited to high volume production due to the high costs for tooling and processing machines. This study suggests the combined use of a cold and simple tool and high forming speeds to reduce tooling and processing costs and enable the usage of common stamping machines. Half sphere samples are produced from single and two-layer polypropylene and glass fiber organo-sheets in a custom built drop tower and analyzed for their geometry, degree of re-consolidation, surface quality and potential fiber damage using a variety of microscopy techniques. While only mediocre degrees of re-consolidation and limited surface qualities can be achieved with the combination of a cold tooling and state-of-the-art forming speeds of 0–0.5 ms−1, the usage of a higher forming speed of 3 ms−1, vastly improves surface qualities and the degree of re-consolidation without any detectable fiber damage. This effect is more pronounced in the dual layer material. Extensive knowledge on the forming behavior of continuous fiber reinforced thermoplastics at high cooling rates and high speeds of deformation is required for sufficient process control and future studies need to further elaborate and quantify the influencing factors and limits of high-speed forming of continuous fiber reinforced thermoplastics.
1 Introduction
Continuous fiber reinforced thermoplastics (CFRTs), as pre-forms also referred to as organo-sheets, are a group of materials with a number of very promising properties. Compared to classic engineering materials, such as steel and aluminum, they offer a superior potential for lightweight construction due to their weight-specific modulus and strength allowing for a wide range of viable applications e.g. in the aerospace and automotive sector [1]. While high moduli can already be reached with lower fiber lengths [2, 3], high strength and impact properties require long or continuous fibers [4, 5], so that CFRTs show the highest advantages in failure and crash relevant applications. Furthermore, CFRTs have significant advantages over thermoset composites, which are typical competitors in the market of high performance plastics. Storage can take place without refrigeration and mostly without time limits, while shorter manufacturing cycles are as well possible due to solidification by cooling instead of curing [6]. Furthermore, the thermoplastic matrix allows for welding processes and process combinations with different manufacturing technologies, such as injection molding, to create parts with high complexity and degrees of functional integration [7]. Despite these significant advantages, the actual use of CFRTs stays behind the use of thermoset composites: In 2015, the revenue of thermoset carbon fiber composites was three times the revenue of thermoplastic carbon fiber composites [8]. Reasons for this are manifold: higher material costs compared to metals, comparably long cycle times and high energy consumption for material and tool heating and others. Even though recent advancements have been made in reliably measuring the forming properties of CFRTs [9,10,11] and furthering their numerical modelling [12,13,14], simulative predictions are still lacking compared to metals [15,16,17] and as CFRT processing necessitates dedicated complex tooling, major costs are involved in engineered and production of CFRT parts. A comprehensive review of the current of CFRT simulation is given in [18] and based on the shown perspectives, the quality and reliability of these simulations employed in both the industrial and scientific sectors can be expected to rise in the near future. Compared to thermoset based continuous fiber reinforced plastics, this eliminates possible applications with small part numbers, which can feasibly be produced in hand lay-up and other thermoset processes [19].
Hence, it is desirable to reduce the tooling as well as energy costs and the cycle time in order to reduce the overall manufacturing costs and consequently make small batch production profitable for CFRTs.
One possible approach to achieve this aim is to use unheated, and therefore less costly, tools with high forming velocities. In state-of-the-art CFRT processing, heated tooling and comparably slow mold closing or compression speeds are used. Investigated closing speeds range from 11.7–166 mms−1 [20] over 75 mms−1 [21] and 125 mms−1 [22] up to 30–230 mms−1 [23]. However, in case of semi-crystalline thermoplastics, re-crystallization takes time, which causes the re-crystallization to shift to lower temperatures, as low as below 100 °C for polypropylenes, at high cooling rates [24, 25], widening the processing time and temperature windows, especially in combination with fast forming processes.
Trudel-Boucher et al. [21] found out that a fast application of the forming force and high stamping pressure leads to better mechanical properties and lower void content. Another recent study shows that the use of high cooling speeds in manufacturing of CFRTs may significantly improve the strength of the composite [26].
In summary, several advantages are expected with high-speed forming with cold tools of CFRTs over traditional forming with heated tools. The reduced tool complexity may reduce overall production costs or increase process stability while complex shapes can be made with multiple steps. Cycle time improvements can be achieved by a significantly reduced cooling time due to higher cooling rates as well as significantly increased closing and compression speeds. The overall stamping process could be executed simplified forming presses. Regular and thus existing stamping machines for automotive body panels may be feasible, in general, however, common forming speeds are with 210–300 mms−1 only slightly higher than those in common CFRT forming [27, 28]. This could reduce costs for planning and machinery and thus lower entry hurdles. Reduced use of energy without tool heating offers potential for additional cost savings in production.
Against this background, the goal of this paper is to examine the general suitability of high-speed forming of continuous fiber reinforce thermoplastics with cold tools. The main focus of this study is the general examination of the part quality based on a surface and consolidation quality analysis with the use of a 3D laser scanning microscope as well as microsection images. Additional micro computer tomography (μCT) scans are employed to locally analyze selected samples for fiber damage, which is a potential limitation for higher forming speeds.
2 Materials and Methods
2.1 Material
All tests are carried out with an e-glass fiber fabric reinforced polypropylene composite (organo-sheet) with a variable number of reinforcement layers and total thickness of 0.5–1 mm. The fabric reinforced composite is of the type Tepex 104-RG600(x)/47% (Bond-Laminates GmbH, Brilon, Germany; the material name varies based on the number of layers, for which “x” is the placeholder) in the one (1 L, 0.5 mm nominal thickness, measured to 0.51 ± 0.01 mm, n = 15) and two (2 L, 1 mm nominal thickness, measured to 1.01 ± 0.01 mm, n = 15) layer variants. The glass fiber fabric features an area weight of 600 g/m2 and a roving based 2/2 twill weave at total content of 72.33 ± 5.85 wt% (measured with a thermogravimetric analyzer, TGA 5500 (TA Instruments, Newcastle, USA)).
2.2 Differential Scanning Calorimetry
The melting and recrystallization behavior of the composite material is measured in a differential scanning calorimetry on three samples per setting (DSC) (tested heating rates of 0.083–0.333 Ks−1), using a Discovery DSC 2500 (TA Instruments, Newcastle, United States). In addition, higher cooling rates of 0.833–6.667 Ks−1 are examined one single samples per setting using a high-speed DSC 8500 (PerkinElmer Inc., Waltham, United States). Since the high-speed DSC uses smaller samples and operates at higher cooling rates, a homogeneous cooling of the sample cannot be guaranteed anymore, whence the high-speed measurements deviate and are only supposed to indicate further development of the recrystallization behavior at higher cooling rates instead of showing perfectly reliable values.
2.3 Forming Sample Preparation
All samples are cut from 300 mm × 300 mm sized pre-cuts using a common utility knife (single layer material variant) or a water-cooled saw (dual layer variant) into smaller, square forming samples with dimensions of 200 mm × 200 mm. In a following step, a marking grid with cell lengths and widths of 10 mm is applied to one side of each sample using a common white gloss paint marker. The grid allows for an easier analysis of the local shear angles. For the normal forming samples, preparation is complete at this point.
For the initial temperature adjustment samples, two small holes are burnt into the macro-pores closest to the center of the forming samples using heated wires. Two insulated IEC 584–1 / DIN EN 60584–1 thermocouples (2 × 0.20 mm; ABB Automation Products GmbH, Alzenau, Germany) with point-welded tips are then lead through these holes and fixed in such a way that their tips are constantly pressed onto the surface of the organo-sheets, one on each side, securing surface temperature surveillance.
All samples are subsequently mounted into a clamping frame (see Fig. 1), which allows for secure sample handling prior to the actual forming. The clamping is achieved by four common poster clips fixed on the clamping frame in all outer corners, which each exert clamping forces of 11.4 ± 1.4 N (n = 4) along a length of 25 mm.
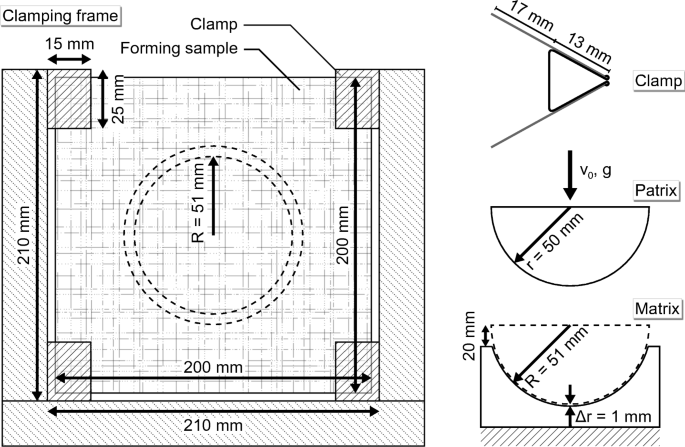
Schematic depiction of the high-speed forming setup with all relevant measures. Left: Clamping frame used to keep the forming sample in place during actual forming and allow for safe sample handling with indication of the tooling matrix as dashed lines
Right: Schematics of clamps, patrix and matrix used for the forming trials. The matrix is fixed and aluminum profiles limit the patrix to vertical movement, resulting in a forming situation defined by mass of the patrix, its initial velocity and gravity.
2.4 Process Temperature Control
Process temperature control is employed by a combination of time-control and heating pre-trials. The temperature adjustment samples with mounted thermocouples are placed in between a pair of custom built infrared heating panels consisting of four 248 × 248 mm2 sized infrared heaters type G 14–25 - 2,5 MINI 7,5; 230 V/ 11 A/ 2,5 kW (KRELUS AG, Oberentfelden, Switzerland). The heating panels are spaced 180 mm apart and the forming samples are centered in between the panels during heating.
Starting from room temperature at TS = 25 °C, the heating panels are subsequently set to maximum power and the surface temperature changes over time are tracked and recorded using a custom DASYLab script (version 5.1, National Instruments, Austin (Texas), United States of America) until a maximum temperature of 250 °C is reached. Afterwards, the sample frame is manually removed from the heating panels, placed into the final position for the actual forming trials and left there for further cooling, while still recording all temperature changes. Based on these measurements, the initial heating, the temperature drop due to handling and the final passive cooling can be quantified into corresponding heating and cooling rates. Together with the known handling times for sample movement and triggering the forming process, the required initial heating temperatures TI and corresponding heating times ti can be calculated, which are needed to reach a desired sample target temperature at the beginning of the actual forming process. For the given study, a target forming temperature of TF = 200 °C is used. This corresponds to an initial heating temperature TI(1 L) = 225 °C (tI(1 L) = 27.2 s) and TI(2 L) = 220 °C (tI(2 L) = 35.9 s). The subsequent first temperature drop ΔTH(1 L) = 19 K, ΔTH(2 L) = 15 K due to 5 s of handling and the generated forced convection cooling is followed by another ΔTF(1 L) = 6 K, ΔTF(2 L) = 5 K of static cooling during 3 s of triggering (compare Fig. 2). Different forming speeds will then lead to different cooling durations with contact to the cold tools, resulting in different temperatures at the end of forming TE. High-speed forming leads to higher temperatures TE,HS before the forming is complete than lower forming speeds (TE,LS). The calculated procedure has been verified in additional pre-trials and the measured temperature at the beginning of the forming process has been found to be in good agreement with the target temperature of 200 °C. In order to avoid damage to the forming matrix and patrix, process control is employed only via time control without mounted thermocouples.
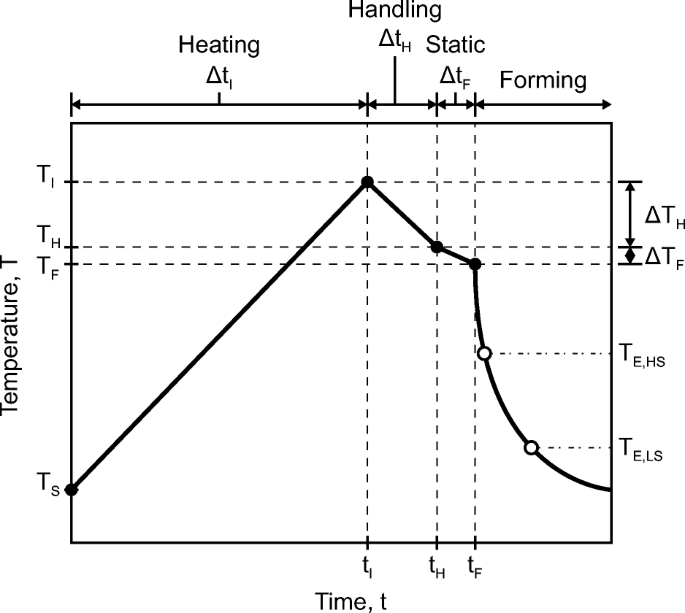
Schematic representation of the temperature changes during the forming trials. First, the samples are heated to the initial Temperature TI, followed by forced-convection cooling ΔTH during handling and a period of free-convection (static) cooling ΔTF before triggering the forming process at the forming temperature TF. As soon as the actual forming is started and contact between forming sample and tooling is established, the temperature drops with a high cooling rate due to conduction and the high temperature difference between the heated forming sample and the cold tooling at room-temperature. The temperature reached at the end of the forming process TE depends on the forming speed, with higher speeds (HS) resulting in higher temperatures than lower forming speeds (LS)
2.5 High Speed Sample Forming
For high-speed forming of the organo-sheet samples, a custom-built drop tower mostly made from aluminum profiles is used. The drop-tower limits the movement of the patrix to one-dimensional vertical movement and allows for the application of additional weights to the patrix to vary the impact energy. In this study, only a single fixed set of weights is used, resulting in a combined mass of patrix and weights of 15.14 kg. Vertical fixation of the patrix is used by a thin metal-rod, which can be pulled out manually, instantly causing the patrix to drop and initiate the forming process.
Geometry-wise, the patrix is a steel dome (half-sphere) with a radius of 50 mm and the matrix is a negative steel dome with a radius of 51 mm and with a height reduced by 20 mm when compared to a half-sphere (see Fig. 1). This radius offset of patrix and matrix corresponds to the material thickness of the two layered organo-sheet variant of 1 mm. As locally highly sheared areas and hence shear thickening are expected, homogenous compression across the whole samples cannot be achieved. Followingly, further examination will be focused the areas of full and homogeneous compression. The samples are formed with different forming speeds based on the initial patrix velocity. The initial patrix velocity is adjusted by the vertical gap Δy between forming sample surface and lower patrix surface and initial velocities of v0 = 0 ms−1 (Δy = 1 mm), 0.5 ms−1 (Δy = 15 mm) and 3 ms−1 (Δy = 495 mm) are used. Adjustment and verification of the vertical gap have been conducted by velocity measurements prior to the impact using two light barriers OPB916 (TT Electronics Plc, Working, United Kingdom) spaced 19.8 mm apart. Explicit measurement of the velocity is necessary, as the vertical slide bearings cause a minor energy loss due to friction and lead to an acceleration below gravitational acceleration.

Overview of the general sample appearance and locations A-C of the microscopic samples on in the forming samples
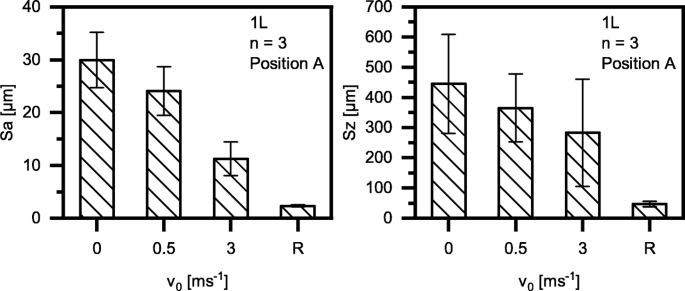
Comparison of the arithmetical mean height of the surface Sa and the maximum height difference Sz at position A for initial velocities of v0 = 0–3 ms−1 and the single layer material variant. The corresponding values of the organo-sheets prior to forming (R) are given as additional reference
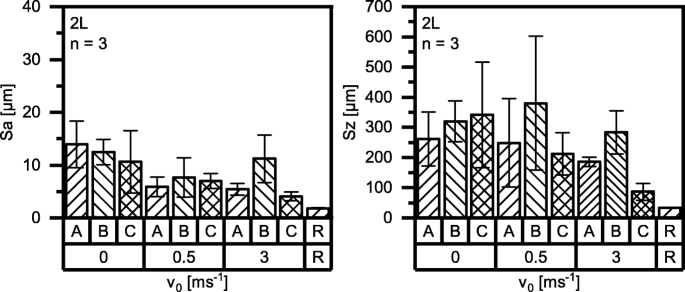
Comparison of the arithmetical mean height of the surface Sa and the maximum height difference Sz at positions A-C for initial velocities of v0 = 0–3 ms−1 and the dual layer material variant. The corresponding values of the organo-sheets prior to forming (R) are given as additional reference

Characteristic laser scanning images of position C of all individual forming samples for the two layer material and different initial velocities of v0 = 0–3 ms−1

Comparison of the light microscopy samples of the single layer material variant for position A (compare Fig. 3) at the tested initial forming velocities of v0 = 0, 0.5 and 3 ms−1

Comparison of the light microscopy samples of the dual layer material variant for the positions B and C (compare Fig. 3) at the tested initial forming velocities of v0 = 0, 0.5 and 3 ms−1

Overview of the CT results, showing representative details of the fiber appearance throughout the forming samples of both thicknesses (1 L, 2 L) at the indicated positions and initial velocities at three different depth. For all scans, the focus is set on the fiber layers closest to surface and the depths are spaced 10% of the fiber layer thickness apart. The scans reveal no signs of fiber damage in any samples or configurations, which has been confirmed for the complete, scanned samples, though only representative images can be shown due to the volume data size
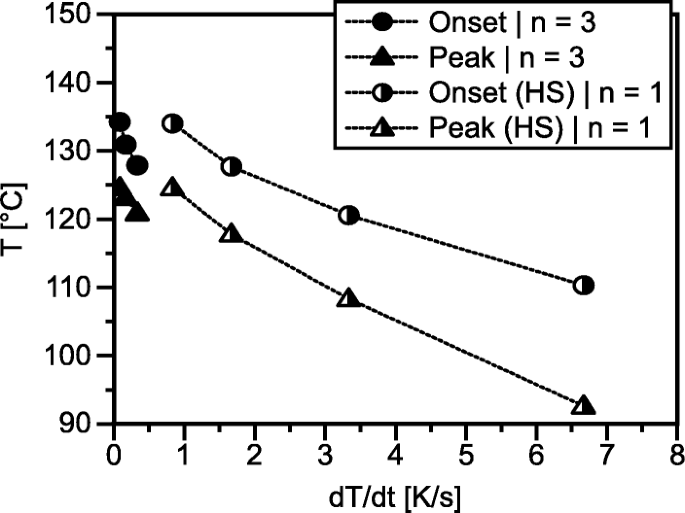
Thermal material properties measured with differential calorimetry in a DSC 2500 at lower cooling rates and with a DSC 8500 at higher cooling rates (denoted by HS). The results are shown in form of the recrystallization onset and peak temperatures of the first cooling, indicating a shift of the recrystallization process to lower temperatures with increasing cooling rate
For all settings (v0 = 0, 0.5, 3 ms−1), three trials are conducted for each material thickness (0.5, 1 mm). All trials are conducted at room temperature (25 °C) and no active cooling is used for the patrix and matrix. Subsequent trials are started, when patrix and matrix have cooled down to 25 °C again.
2.6 Microscopy Sample Preparation
The produced CFRT domes have different forming zones with distinct shear-deformation resulting from the combination of the used 0/90 twill-weave reinforcement. Along the width- and length-directions, no shear is required to drape the material into the desired dome-geometry, while the diagonal lines connecting the corners for the forming sample, major shear-deformation takes place. As only a single set of tooling is used, no homogeneous compression is achieved, since areas of high shear cause the composite to locally thicken, reducing the compressibility in the process [29]. For the one-layered forming samples, full compression takes place in the center, at the tip of the dome (see Fig. 3, location A), as even the sheared areas do not cause the material to exceed a thickness of 1 mm. For the two layer samples, full compression takes only place along the edge of the matrix (locations B and C), with a focus on the diagonal regions (location C), as here maximum shear occurs with resulting weave angles after forming of 57.7 ± 2.7° (2 L, v0 = 0 ms−1), 54.3 ± 2.6° (2 L, v0 = 0.5 ms−1) and 49.0 ± 1.2° (2 L, v0 = 3 ms−1), limiting further progression into the matrix as the local material thickness after compression exceeds 1 mm. Hence, three different locations are examined for each sample (compare Fig. 3).
Location A is located in the center of the dome. The other two investigated sections are located in periphery of the dome, 10 mm above the revolving edge. Position B is located in a zone with minimal fiber sheer whereas position C is located in the zone with maximum fiber shear.
In order to allow for an analysis of the same samples in all microscopy variants, CT imaging is conducted first, followed by the laser-scanning analysis and embedding and light microscopy are conducted last. The individual microscopy samples are cut out of the dome with a water-cooled saw to avoid any thermal influences and each individual microscopy sample measures 20 mm × 20 mm. For CT imaging, the samples are first cut to 20 mm × 40 mm, ensuring an unobstructed view of the sample area outside of the fixation clamps, before being cut to the final microscopy sample size of 20 mm × 20 mm. For laser-scanning and CT imaging, the microscopy samples are used in this state. For light microscopy, the samples are additionally embedded in transparent resin and subsequently ground and polished. A microscopy sample for each section (A-C) and each forming sample for all initial velocities v0 (n = 3) is analyzed in laser-scanning microscopy, for light microscopy one microscopy sample per section and v0 (n = 1) is analyzed. Single CT images (n = 1) are only created for the regions, in which full compression takes place for v0 = 0 ms−1 and 3 ms−1: Location A for the single layer material and Location C for the dual layer material.
Top left: Sketch of the dome geometry of the sample in top view and side viewBottom left: Forming sample of the two layer material in side view, depicting the high shear and sample compression (smooth surface area) in the diagonal regions around location C.
Right: Forming sample of the one and two layer materials at v0 = 0.5 ms−1 in top view.
2.7 Micro Computer Tomography
For the μCT analysis, the samples are fixed in a rotatable mount, allowing for different viewing angles during the scans, which are required to generate a volume reconstruction based on the scans. The samples are positioned in such a way that one geometric plane is aligned tangentially to their surface. However, as the samples are sections of a dome, full tangential alignment is not possible. The CT analyses are conducted with a micro-radiography-computer-tomograph device of the type sub휇-CT (Fraunhofer Institute for Integrated Circuits (IIS) e.V., Germany, Erlangen).
All sample scans are sighted thoroughly, following the path of individual rovings and fibers and analyzing them for potential breakage, indicated by sudden shifts in direction, internal open ends or sudden voids.
2.8 3D Laser Scanning Microscopy
For examination of the surface quality, a 3-D laser scanning confocal microscope VK-X1000 (Keyence Corporation, Osaka, Japan) and for all post-processing the corresponding software MultiFileAnalyzer (version 2.1.3.89, Keyence Corporation, Osaka, Japan) is used.
For single layered samples, only position A is examined, since only in this area controlled contact to both patrix and matrix is established during forming due to the tool gap being fitted for a 1 mm material and sufficient pressure for reconsolidation and good surface quality cannot be guaranteed in the other positions.
For two layered samples, all positions (A, B, C) are examined in order to be able to assess the influence of the forming speed on the resulting local part geometry. Full compression and controlled contact to both the patrix and the matrix only takes place at position C. However, full contact to the patrix is consistently achieved in all locations in contrast to the single layer samples, where surface analyses are only partly possible.
The scanned area measures 5 × 5 mm2 with 20-x magnification. The gained metrology data is then filtered with a cut-off wavelength of 2.5 mm in order to remove geometrical deviations caused by the sample shapes, i.e. removing the global sample curvature, as the samples are sections of a dome, without influencing surface irregularities caused by individual rovings or fibers. Larger area scans cannot be feasibly evaluated, as the geometrical sample curvature does else dominate the measured topology and cannot be corrected anymore.
One sample of every position and forming sample (n = 3) is evaluated for its arithmetical mean height of the surface Sa as well as the maximum height difference per sample Sz as indicators of the surface topology. The mean value and standard deviation of the measurements per position, initial velocity and layer setup is calculated and used for further evaluation.
As a reference, the surface topology of the metal patrix at position A and the organo-sheets prior to forming is measured as well, using a comparable scanned area of 5 × 5 mm2. The other positions of patrix and matrix cannot be tested due to geometrical limitations of the used laser scanning confocal microscope.
2.9 Light Microscopy
In order to further analyze the cross-section and inner shapes of the polymeric matrix, voids and the fiber rovings in the formed samples, the prepared samples (compare section 2.5) are digitally recorded by a microscope of the type Axio Imager M2 m (Carl Zeiss AG, Oberkochen, Germany). After digital image recording, the white balance of the images is adjusted equally with Adobe Photoshop (version 13.0 × 64, Adobe Systems Inc., San José, United States of America), increasing the contrast for easier discrimination of polymeric matrix, voids and embedded fibers. In the evaluation, special emphasis is put on analysis of the sample thickness and void content as an indicator for the material compression and degree of consolidation. The void content is calculated according to the procedure described in [30], using the software ImageJ (version 1.8.0_112, https://imagej.nih.gov/ij/index.html; National Institute of Health, Bethesda, United States of America). The microscopy images are first segmented using an intensity threshold of gray level 90 followed by the application of a size threshold of 30 μm to exclude ‘void like’ features originating in sample preparation and other optical artifacts. The void content is then calculated as the relative content of these voids in the total sample cross section.
3 Results and Discussion
3.1 3D Laser Scanning Microscopy
The examination of the resulting surface qualities reveals clear coherences between the achieved surface quality and the evaluated position as well as the initial velocity. In the samples with one layer thickness, a reduced surface roughness can be observed for increased initial velocities v0. The measured arithmetical mean height of the surface Sa decreases from Sa(1 L, A, 0 ms−1) = 29.91 ± 5.24 μm over Sa(1 L, A, 0.5 ms−1) = 22.05 ± 4.61 μm to Sa(1 L, A, 3 ms−1) = 10.13 ± 3.21 μm. This depicts that in addition to a reduction in surface roughness a reduction of deviations in between individual samples can also be achieved by increased forming speeds, which indicates increased reproducibility of the forming process (see Fig. 4). While the general trend of reduced surface irregularities is comparable for the measured maximum height difference per sample Sz, no major reduction in the standard deviation can be observed for higher forming speeds. Major local irregularities are highly likely due to the experimental setup, whence the Sa values are a better indication for the general average surface quality. Only when a generally high surface quality level is already present, the Sz values can contribute with a higher accuracy due to the recognition of single instances of surface defects. In addition, the patrix is not mechanically locked after it has reached the final forming position and can jump upwards due to its high kinetic energy, which is not depleted due to the forming action. This may hence cause local material rupture and limits the maximum surface quality that can be reliably achieved in the given setup. The measured surface irregularities are still more pronounced than in the unprocessed organo-sheets (Sa(1 L, unprocessed) = 2.34 ± 0.20 μm), Sz(1 L, unprocessed) = 46.75 ± 8.66 μm)), though, indicating that the surface quality is not optimal yet. However, no major influence from the tools on the measured surface parameters is to be expected, as the tool surface is comparable to the surface of the unprocessed organo-sheets (Sa(patrix, A) = 2.87 ± 0.49 μm), Sz(patrix, A) = 58.36 ± 5.65 μm)).
For the 2 layer material, the results for position C indicate the same trends as for the 1 layer material in position A (compare Fig. 5), which are comparable due to full compression. Here, the Sa value decreases from Sa(2 L, C, 0 ms−1) = 10.60 ± 5.89 μm over Sa(2 L, C, 0.5 ms−1) = 6.49 ± 1.41 μm to Sa(2 L, C, 3 ms−1) = 4.08 ± 0.81 μm. As the patrix to matrix gap is set to 1 mm and additional shear thickening takes place at location C, the actual compression is slightly higher when compared to location A for the single layer material, resulting in a lower average surface roughness and reduced deviation between the samples.
At position A of the two layer samples, the surface roughness decreases from Sa(2 L, C, 0 ms−1) = 12.74 ± 3.81 μm over Sa(2 L, C, 0.5 ms−1) = 5.26 ± 1.71 μm to Sa(2 L, C, 3 ms−1) = 5.14 ± 1.08 μm. During forming, position A is exposed to patrix contact and as the outer dome regions are compressed at position C, the organo-sheet is stretched in the dome area, resulting in a resistance, which allows for limited compression on the patrix side. After a certain, small initial velocity is reached, no further compression and hence improvement of the surface quality can be achieved anymore, as no full contact to the matrix can be established in this position and only the stretched weave acts as a resisting force. As previously stated, the Sz value reacts with a high sensitivity to any surface defects, even in single instances. Differences in the mean values and standard deviations between initial forming velocities of 0 ms−1 and 3 ms−1 are more pronounced and especially for position C, the highest forming speed shows major improvement of the surface quality with a drop from Sz(2 L, C, 0 ms−1) = 341.88 ± 174.76 μm to Sz(2 L, C, 3 ms−1) = 86.62 ± 28.11 μm. As for the 1 layer material, these results show that the Sz value can help in differentiating higher surface qualities, but the Sa value can more reliably depict surface topology differences at lower to medium surface qualities. In the 2 layer setup as well, all measured values are still well above the original surface quality of the unprocessed organo-sheets (Sa(2 L, unprocessed) = 1.80 ± 0.10 μm), Sz(2 L, unprocessed) = 34.47 ± 0.97 μm)).
At position B, neither pronounced compression nor stretching takes place, whence no relevant decrease of the surface roughness takes place along an increase in initial velocity.
In summary, it can be noted that increasing forming speeds lead to a reduced surface roughness and reduced deviation in between individual samples. However, this can only be proven locally for the locations, in which full or limited compression takes place.
For further validification, the results of the Sa measurements are as well presented in the form of the original laser scanning images of the two layer material of position C in Fig. 6. The main detected defects are filament accumulations as they are especially prominent in sample 1 at v0 = 0 ms−1 and sample 3 at v0 = 0.5 ms−1. These two samples also show the highest measured Sa in their group with 18.900 μm and 8.779 μm. As it can be expected with the declining surface roughness with increased forming speed, the amount of visible surface defects is reduced at higher initial velocities. At the highest velocity v0 = 3 ms−1, the scan of sample 3 is even void of any major surface defects, showing that high surface qualities and sufficient compression can be reached even with cold tooling, when the forming speed is sufficiently high.
Besides the filament accumulations, most of the samples show distinct horizontal lines that are caused by the tool surface and are the result of machining leads. As previously stated, the roughness of the tool is well below the material roughness of all measured defects and is hence negligible.
3.2 Light Microscopy
The micro sections reveal no major differences between the three different initial velocities in position A for the single layer material with relatively good compressions and low void contents. However, a slightly higher compression can be identified for the initial velocities of v0 = 0.5 ms−1 and v0 = 3 ms−1 in a slight reduction in sample thickness ds (ds(1 L, A, 0 ms−1) = 0.48 ± 0.04 mm, ds(1 L, A, 0.5 ms−1) = 0.42 ± 0.04 mm, ds(1 L, A, 3 ms−1) = 0.44 ± 0.04 mm; measured on 8 equidistant locations per sample) alongside a slight reduction of internal voids (black areas, see Fig. 7). The total void contents cv of the samples amount to cv(1 L, A, 0 ms−1) = 8.22%, cv(1 L, A, 0.5 ms−1) = 5.41%, cv(1 L, A, 3 ms−1) = 8.99%, however, the high total void content at the highest deformation speed (1 L, A, 3 ms−1) originates in an accumulation of three neighboring large local voids close to the sample surface.
These effects are more pronounced in the dual layer material. Figure 8 compares the micro sections of position B and C at all three initial velocities for the dual layer material. For both positions, a significant reduction of voids can be identified with increasing initial velocity from v0 = 0 ms−1 and v0 = 3 ms−1. The corresponding void contents amount to cv(2 L, B, 0 ms−1) = 23.45%, cv(2 L, B, 3 ms−1) = 4.68%, cv(2 L, C, 0 ms−1) = 9.44% and cv(2 L, C, 3 ms−1) = 1.86%. For the sample at position B and v0 = 0.5 ms−1, there is also a slight reduction of the void content with cv(2 L, B, 0.5 ms−1) = 18.90%, whereas position C does not reveal an improvement at this point with cv(2 L, C, 0.5 ms−1) = 12.21%. At sufficient forming speed, at least partial compression takes place at position B, whence major improvements can only be noted for v0 = 3 ms−1 but not for v0 = 0.5 ms−1.
Overall, position C at v0 = 3 ms−1 shows the lowest void content with the smallest individual voids of all investigated samples and therefore, it can be concluded that a high forming speed and the resulting high contact pressure is advantageous for a good consolidation. The expected thickening due to lower weave angles in the highly sheared state in position C (2 L: 57.7 ± 2.7° (v0 = 0 ms−1), 54.3 ± 2.6° (v0 = 0.5 ms−1) and 49.0 ± 1.2° (v0 = 3 ms−1); measured digitally on sample scans) can as well be confirmed, as the average thickness of the two layer samples in the micro sections exceeds the pre-form thickness of 1 mm (ds(2 L, C, 0 ms−1) = 1.30 ± 0.07 mm, ds(2 L, C, 0.5 ms−1) = 1.23 ± 0.13 mm, ds(2 L, C, 3 ms−1) = 1.11 ± 0.13 mm; measured on 8 equidistant locations per sample).
3.3 Computer Tomography
As previously stated, the samples feature an innate curvature, preventing a proper volume display of all relevant features in two-dimensional images. Hence, representative detail images of the single layer material in position A and the two layer material in position C in a single plane and three different depths are shown in Fig. 9. The first images, showing the internal fiber structure for position A, confirms that no shear deformation has taken place internally and the rovings are still oriented perpendicularly to each other. In the second series of images, position C reveals major shear deformation along a partial waviness of individual fibers and rovings, indicating that instead of pure shear, a combination of shear and in-plane bending takes place during draping. Compared to bending, shear forces in organo-sheet forming are relatively high, so that bending deformation usually takes place first, before the material is forced into a sheared state or sufficient relaxation of the polymeric matrix is possible [11]. Hence, less pronounced shear and higher in-plane bending may be a side effect in high-speed organo-sheet forming with cold tools that needs to be taken into consideration in further studies. A pronounced waviness of the fibers may impair the mechanical properties of CFRT parts as shown in [31, 32]. However, as the waviness is present for both low and high forming speeds, no relation of higher forming speeds and potentially increased waviness can be identified at this moment.
None of the images, as well as the complete, scanned volumes, show any indicators (sudden changes in fiber paths, sudden voids in extrapolated fiber paths, obvious major defects) for potential fiber damage.
3.4 Differential Scanning Calorimetry
The melting peak of the matrix material has been measured in the DSC analysis to 163 °C (heating rate of 0.167 Ks−1) and the melting process is complete at a temperature of 175 °C, independently of the used heating rate (tested heating rates of 0.083–0.333 Ks−1). At low cooling speeds of 0.167 Ks−1, the recrystallization peak is located at 125 °C and drops to about 90 °C at higher cooling rates dT/dt of about 7 Ks−1 (see Fig. 10). For the cooling due to contact to the tools, even higher cooling rates of up to 1000 Ks−1 in the skin regions (1 Ks−1 in the core regions) are generally assumed [25, 33], so that recrystallization takes place at temperatures at below 90 °C. For the giving forming case, two conclusions can be drawn from this. First, the general forming of organo-sheets can be expected to be reliably possible even at low tool temperatures, as the recrystallization is shifted to temperatures below 90 °C (PP) offering wide temperature range for actual processing. Second, regarding surface qualities, possible material flow in the skin regions is of major importance and here different forming velocities play a major role. At high forming speeds, the forming process is much further advanced when crystallization of the skin layers takes place. Already re-solidified regions are more likely to experience the formation of additional defects, as strain and stresses in solid polymer regions may cause local ruptures and fractures. However, this is only one contributor to the observed differences in surface qualities for the different forming velocities. In addition to different thermal situations, the resulting forces and forming energies are higher at higher velocities, resulting in higher possible levels of polymer flow, before a re-solidification takes place, so that forming and consolidation can advance further during comparable processing windows.
4 Conclusion
This study shows the general feasibility of a combination of cold tools and high forming speeds to process continuous fiber reinforced thermoplastics into parts. The setup is viable for usage in low-cost stamping machinery and may significantly reduce tooling and processing costs. While each of the used microscopy methods, laser scanning, light microscopy and computer tomography, on their own are limited in the effects, which can be shown, their combined results draw a clear picture. Low forming speeds in the range of established use (0–0.5 ms−1) only yield mediocre degrees of consolidation and limited surface qualities with a cold tooling, but reasonable degrees of consolidation and better surface qualities, up to the point, where no visible surface defects appear anymore, can be reached with sufficiently high forming speeds (3 ms−1). As the DSC measurements show, crystallization processes take some time to fully develop and hence, a viscoelastic flow of polypropylene can still take place below 100 °C and in order to use this effect to its maximum extent, forming processes must be fast, allowing for major deformation and relaxation before major crystallization takes place.
At high forming speeds, the mechanical behavior of the polymer melt can be expected to be more elastic and less viscous, leading to a higher degree of force transition normal to the fibers. Hence, the peak stresses reached are higher, which can potentially cause local ruptures in the matrix or fiber breakage. In this study, no fiber damage appears at forming speeds of up to 3 ms−1. Future research must still take this potential problem and restriction into account and evaluate, which maximum forming speeds are viable in order to still avoid major material damage.
As in all related processes, the usage of a correct tooling geometry is of high importance, taking local shear thickening into account in order to allow for a homogeneous material compression during processing. Hence, extensive knowledge on the material forming behavior at high rates of deformation and high cooling rates is necessary to properly model the material behavior and create adequate tooling geometries. Some recent studies have made some advances in order to allow for forming behavior measurements of CFRTs at near processing conditions [9,10,11], reaching high rates of deformation and trying to reach material states and thermal histories comparable to actual processing and such measurements are the pre-requisite for correct modeling of high-speed forming of CFRTs with the use of a cold tooling. A different valid approach may be the use of a more flexible patrix made of silicone rubber, which would cause a more homogeneous pressure distribution when the tooling geometry is not perfectly taking shear thickening into account, however, this may only work when the surface quality only needs to be optimal on the side of the metal matrix. In addition, this approach will vastly influence the overall cooling behavior and may be restricted to material setups with low thicknesses to still allow for sufficiently high cooling speeds. Overall, this approach shows significant potential to create high-quality CFRT parts with reduced tooling and processing costs. Extensive additional research is necessary in order to quantify all influencing factors and be able to properly measure, model and simulate the material forming behavior under the given conditions.
References
Agarwal BD, Broutman LJ, Chandrashekhara K. Analysis and Performance of Fiber Composites. 4th Edition, 2017, John Wiley & Sons, Inc., Hoboken; 5–12
Thomason JL. The influence of fibre length and concentration on the properties of glass fibre reinforced polypropylene: 5. Injection moulded long and short fibre PP, Composites Part A: Applied Sci-ence and Manufacturing 33 (2002) 12; 1641-1652
Thomason, J.L., Vlug, M.A.: Influence of fibre length and concentration on the properties of glass fibre-reinforced polypropylene: 1. Tensile and flexural modulus, Composites Part A: Applied Science and Manufacturing. 27(6), 477–484 (1996)
Thomason, J.L., Vlug, M.A., Schipper, G., Krikor, H.G.L.T.: Influence of fibre length and concentration on the properties of glass fibre-reinforced polypropylene: Part 3. Strength and strain at failure, Composites Part A: Applied Science and Manufacturing. 27(11), 1075–1084 (1996)
Thomason, J.L., Vlug, M.A.: Influence of fibre length and concentration on the properties of glass fibre-reinforced polypropylene: 4. Impact properties, Composites Part A: Applied Science and Manufacturing. 28(3), 277–288 (1997)
Sommer, M., Edelmann, K., Wöginger, A., Christmann, M., Mack, J., Medina, L.: Thermoplastische Prepregs und Halbzeuge. In: Neitzel, M., Mitschang, P., Breuer, U. (eds.) Handbuch Verbundwerkstoffe, pp. 147–199. Munich, Carl Hanser Verlag (2014)
Yousefpour, A., Hojjati, M., Immarigeon, J.-P.: Fusion Bonding/Welding of Thermoplastic Composites. Journal of Thermoplastic Composite Materials. 17, 303–341 (2004)
Kraus T, Kühnel M, Witten E. „Composites Marktbericht 2016.“ 2016
Mattner, T., Körbel, W., Wrensch, M., Drummer, D.: Compensation of edge effects in picture frame testing of continuous fiber reinforced thermoplastics. Compos. Part B. 142, 95–101 (2018)
Ropers, S., Kardos, M., Osswald, T.A.: A thermo-viscoelastic approach for the characterization and modeling of the bending behavior of thermoplastic composites. Compos. Part A. 90, 22–32 (2016)
Mattner, T., Drummer, D.: A new approach for assessing the deflection and bending properties of continuous fiber reinforced thermoplastics under processing conditions. Polym. Test. 74, 77–85 (2019)
Ten Thije, R.H.W., Akkerman, R.: A multi-layer triangular membrane finite element for the forming simulation of laminated composites. Compos. Part A. 40, 739–753 (2009)
Wang, P., Hamila, N., Boisse, P.: Thermoforming simulation of multilayer composites with continuous fibres and thermoplastic matrix. Compos. Part B. 52, 127–136 (2013)
Harrison, P., Gomes, R., Curado-Correia, N.: Press forming a 0/90 cross-ply advanced thermoplastic composite using the double-dome benchmark geometry. Compos. Part A. 52, 56–69 (2013)
Zhong-qin, L., Wu-rong, W., Guan-long, C.: A new strategy to optimize variable blank holder force towards improving the forming limits of aluminum sheet metal forming. J. Mater. Process. Technol. 183, 339–346 (2007)
Ahmetoglu, M.A., Kinzel, G., Altan, T.: Forming of aluminum alloys–application of computer simulations and blank holding force control. J. Mater. Process. Technol. 71, 147–151 (1997)
Candra, S., Batan, I.M.L., Berata, W., Pramono, A.S.: Analytical study and FEM simulation of the maximum varying blank holder force to prevent cracking on cylindrical cup deep drawing. Procedia CIRP. 26, 548–553 (2015)
Bussetta, P., Correia, N.: Numerical forming of continuous fibre reinforced composite materials: a review. Composites Part A. 113, 12–31 (2018)
Ehrenstein, G.W.: Faserverbund-Kunststoffe. Carl Hanser Verlag, Munich. 162–174 (2006)
Wakeman, M.D., Zingraff, L., Bourban, P.-E., Månson, J.-A.E., Blanchard, P.: Stamp forming of carbon fibre/PA12 composites – a comparison of. Compos. Sci. Technol. 66, 19–35 (2006)
Trudel-Boucher, D., Fisa, B., Denault, J., Gagnon, P.: Experimental investigation of stamp forming. Compos. Sci. Technol. 66, 555–570 (2005)
Alcock, B., Cabrera, N.O., Barkoula, N.M., Peijs, T.: Direct forming of all-polypropylene composites. Appl. Compos. Mater. 16, 117–134 (2009)
Hou, M., Friedrich, K.: 3-D stamp forming of thermoplastic matrix. Appl. Compos. Mater. 1, 135–153 (1994)
Supaphol, P., Spruiell, J.E.: Crystalline memory effects in isothermal crystallization of syndiotactic polypropylene. J. Appl. Polym. Sci. 75, 337–346 (2000)
Fischer C, Drummer D. Crystallization and Mechanical Properties of Polypropylene under Processing-Relevant Cooling Conditions with Respect to Isothermal Holding Time, In: International Journal of Polymer Science, 2016; 10.1155/2016/5450708
Wafai, H., Lubineau, G., Yudhanto, A., Mulle, M., Schijve, W., Verghese, N.: Effects of the cooling rate on the shear behavior of continuous glass fiber/impact polypropylene composites (GF-IPP). Compos. Part A. 91, 41–52 (2016)
Pereira, M.P., Rolfe, B.F.: Temperature conditions during 'cold' sheet metal stamping. Journal of Materials Processing Technologies. 214, 1749–1758 (2014)
Skåre, T., Krantz, F.: Wear and frictional behaviour of high strength steel in stamping monitored by acoustic emission technique. Wear. 255, 1471–1479 (2003)
Carvelli, V., Pazmino, J., Lomov, S., Verpoest, I.: Deformability of a non-crimp 3D orthogonal weave E-glass composite reinforcement. Compos. Sci. Technol. 73, 9–18 (2012)
Paciornik, S., D’Almeida, J.R.M.: Measurement of void content and distribution in composite materials through digital microscopy. J. Compos. Mater. 43, 101–112 (2009)
Hsiao, H.M., Daniel, I.M.: Elastic properties of composites with fiber waviness. Composites Part A. 27, 931–941 (1996)
Hsiao, H.M., Daniel, I.M.: Effect of fiber waviness on stiffness and strength reduction of unidirectional composites under compressive loading. Compos. Sci. Technol. 56, 581–593 (1996)
Rhoades, A.M., Williams, J.L., Androsch, R.: Crystallization kinetics of polyamide 66 at processing-relevant cooling conditions and high supercooling. Thermochim. Acta. 603, 103–109 (2015)
Acknowledgements
Part of this work was carried out as part of the research project “OPTIMUM” (funding no. 19I18014F) funded by the German Federal Ministry for Economic Affairs and Energy according to a decision of the German Federal Parliament and supervised by TÜV Rheinland Consulting GmbH.
Contribution Statement
All authors contributed to the study conception and design. Christian Gröschel, Tobias Kleffel and Tobias Mattner built the processing equipment. Material preparation, data collection and analysis were performed by Tobias Mattner and Julian Popp. The first draft of the manuscript was written by Tobias Mattner and all authors commented on previous versions of the manuscript. All authors read and approved the final manuscript.
Funding
Open Access funding provided by Projekt DEAL.
Author information
Authors and Affiliations
Corresponding author
Additional information
Publisher’s Note
Springer Nature remains neutral with regard to jurisdictional claims in published maps and institutional affiliations.
Rights and permissions
Open Access This article is licensed under a Creative Commons Attribution 4.0 International License, which permits use, sharing, adaptation, distribution and reproduction in any medium or format, as long as you give appropriate credit to the original author(s) and the source, provide a link to the Creative Commons licence, and indicate if changes were made. The images or other third party material in this article are included in the article's Creative Commons licence, unless indicated otherwise in a credit line to the material. If material is not included in the article's Creative Commons licence and your intended use is not permitted by statutory regulation or exceeds the permitted use, you will need to obtain permission directly from the copyright holder. To view a copy of this licence, visit http://creativecommons.org/licenses/by/4.0/.
About this article

Cite this article
Mattner, T., Popp, J., Kleffel, T. et al. High-Speed Forming of Continuous Fiber Reinforced Thermoplastics. Appl Compos Mater 27, 37–54 (2020). https://doi.org/10.1007/s10443-020-09794-7
Received:
Accepted:
Published:
Issue Date:
DOI: https://doi.org/10.1007/s10443-020-09794-7