

Abstract
Selection reasonable processing parameters for the metallic product by selective laser melting (SLM) is a significant issue to improve the performance of the final product. The optimization for the performance of the product is caused by the comprehensive effect of multiple processing parameters instead of a single parameter. It is urgent to propose a method for evaluating this comprehensive effect, furthermore, providing reasonable processing parameters. In this study, the mesoscopic features (molten pool morphology, free surface, porosity distribution, etc.) under different processing parameters are analyzed. Meanwhile, a powder scale thermal-fluid coupled model is established considering the randomly distributed powder bed and the complex physical phenomena within the molten pool. The simulation results are compared with the results characterized by multiple experimental methods. The integration of simulation and experiment results show that a fast scanning velocity or a large hatch spacing would decline the quality of the final product. A high energy density could decrease the roughness of the free surface but increase the porosity. Selecting a moderate energy density through a comprehensive comparison of multiple indicators is critical to evaluate the quality of metallic products by SLM.
Export citation and abstract BibTeX RIS
Nomenclature
| t | Time |
 | Flow velocity |
| α | Volume fraction |
 | Volume averaged density |
| β | Liquid fraction |
| T | Temperature |
| p | Pressure |
 | Gravity acceleration |
 | Volume averaged dynamic viscosity |
 | Damping force |
 | Surface tension |
| σ | Surface tension coefficient |
| ζ | Curvature |
 | Unit normal vector |
 | Marangoni shear force |
| H | Enthalpy |
| ΔH | Latent heat |
| h | Sensible enthalpy |
| Lm | Latent heat of melting |
| cp | Specific heat at constant pressure |
 | Volume thermal conductivity |
| SL | Heat source |
| η | Absorption coefficient |
| d | Effective affecting depth of the heat source |
| R | The beam radius |
| P | Laser power |
| V | Scanning velocity |
| x | x coordinates |
| y | y coordinates |
| ε | Emissivity |
| τ | Boltzmann constant |
 | Tangential speed vector |
 | Normal speed vector |
 | Tangential direction |
| 1 | Gaseous phase |
| 2 | Metallic phase |
| s | Solid metal |
| l | Liquid metal |
| ref | Reference |
| total | Total calculation |
| ∞ | Environment |
| 1st | First track |
| 2nd | Second track |
1. Introduction
Additive manufacturing (AM) of metal is widely viewed as a feasible manufacturing technique in today's industrial field [1, 2]. Selective laser melting (SLM), as one of the AM techniques, is capable of manufacturing products with complex shapes [3]. Improvement of the performance of the SLM-fabricated metal products is an important issue in current research, which is affected by multiple processing parameters during SLM.
Experiments are widely used to evaluate the quality of SLM-fabricated products under different processing parameters. For instance, Yang et al [4] studied the influence of the processing parameters on the vertical surface roughness of the AlSi10Mg parts fabricated by SLM. They found that with the same linear energy density, the surface roughness was improved with higher laser power by the experiments. Mohammadi [5] studied the influence of the input energy on the surface roughness of the aluminum alloy specimens in direct metal laser sintering (DMLS) but was limited to the build plane. Yi et al [6] investigated the effect of the laser energy density on the porosity and the mechanical properties of the Inconel 718 samples fabricated by SLM. Trapp et al [7] presented the experimental methods to investigate the effects of the laser power and the scanning speed on the effective absorption and the keyhole formation during SLM. Cunningham et al [8] and Zhao et al [9] used ultrahigh-speed synchrotron x-ray imaging to quantify the phenomenon of the keyholes during SLM. They showed that the excessive input energy introduced the near-spherical porosities underneath the solidified track, sharing the similar traits with the experimental observations. Although the experimental results allow us to visually see the internal defects, the surface topography, the molten pool morphology, etc., they can only analyze the phenomenon qualitatively without revealing the heat and mass transfer mechanism during the SLM process.
In order to solve the problems in experiments, simulation methods have to be used as crucial approaches to reveal the mechanism of the physical phenomena during SLM then as precursors for optimizing the processing parameters. To date, researchers have developed the simulation methods both in the macroscale and in the mesoscale. For instance, Bruna-Rosso et al [10] developed a finite element modeling to simulate the melt pool geometry and the related levels of the fusion at millimeter scale. Du et al [11] established a macro finite element model to predict the temperature field of the AlSi10Mg molten pool in the SLM process. Loh et al [12] created the powder-to-solid transition together with an effective method to achieve the volume shrinkage and material removal through the finite element method (FEM) and experimental validation. Our previous research work also used the FEM to simulate the thermal behavior of the SLM-fabricated metallic samples and revealed the effect of processing parameters on the as-built quality and the molten pool size of both the AlSi10Mg struts and the 316L stainless steel [13, 14]. Nevertheless, the above models were simplified by ignoring the flow, heat and mass transfer within the powder bed, thus could hardly reflect the real physical phenomena during the SLM process. Recently, some studies have been concentrated on the thermodynamic behavior within the molten pool of SLM-fabricated metallic powder using a mesoscopic model at a powder scale, typically using the computational fluid dynamics (CFD) method. For example, Qiu et al [15] and Yu [16] presented a powder-scale model to explore the melt flow into the surface structure and the porosity during the SLM process. Xia et al [17] established a finite volume method (FVM) to investigate the heat and mass transfer, and the surface quality within the molten pool during SLM. Tseng et al [18] used numerical and experimental methods to reveal the effects of the surface tension, Marangoni shear, and the recoil forces on the interfacial morphology of the SLM-produced Ti–6Al–4V samples. They used the regularly packed powder-bed model and demonstrated that the processing parameters (layer thickness, hatch spacing and scanning velocity) had strong influences on the surface quality and the porosity. Actually, the realistic powder-bed is characterized by a random size distribution of the metallic powder, showing a naturally packed feature of the particles. The regularly packed powder-bed models used in the above studies could not approach the realistic condition of the powder bed. Therefore, Wu et al [19] established a randomly distributed powder bed model to investigate the molten pool behavior and the porosity development of the formation of stainless steel during SLM. They considered the random distribution of the powder bed, but only simulated the formation of a single track. It is difficult to reflect the impact of the processing parameters on the performance of the final metallic product.
Overall, the selection of reasonable processing parameters during SLM for the metallic product is one of the ultimate objectives of AM. In previous research, on one hand, the influence of the single-processing parameter on the quality of the SLM-fabricated products is analyzed by experiment methods qualitatively without discussing the heat and mass transfer mechanism during the SLM process. On the other hand, although the published research reported the macroscopic and mesoscopic simulation methods to reveal the mechanism during SLM and analyzed the influences of single-processing parameters on the quality of the final products, there are still differences between the real working conditions and the simulation conditions. For example, a randomly distributed powder bed model should be constructed in simulation, and more than one track should be considered to analyze the effect of the processing parameters on the quality of the product. Moreover, in most of the simulation works, it is not sufficient comparing the differences between the experimental and the simulation results, which cannot prove the correctness of the simulation model. In addition, the performance of the final SLM-fabricated product is caused not only by one single processing parameter, it is a result of the comprehensive effect of all the processing parameters actually. In order to solve the problems above, a method for evaluating the comprehensive effect is proposed based on an integration of mesoscale simulation and experiment characterization, furthermore, the optimization interval of the SLM processing parameters is provided. This study proposes a method for evaluating the comprehensive effect of the processing parameters based on an integration of mesoscale simulation and experimental characterization and will be a guidance for the quality evaluation of a SLM-fabricated metallic product in a quantitative and efficient manner.
2. Model
2.1. Physical model
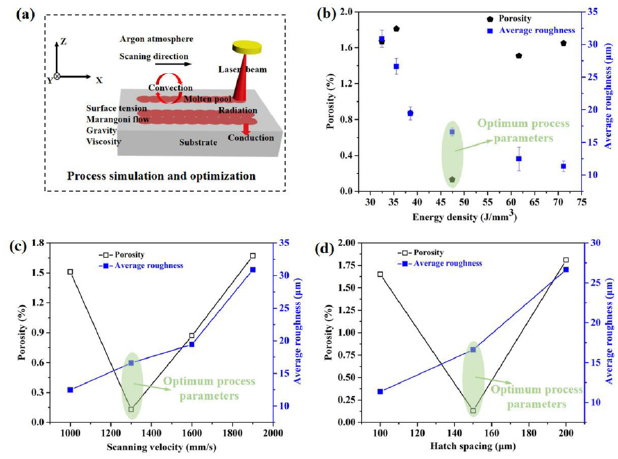
SLM of AlSi10Mg metallic powder is usually a non-equilibrium metallurgical process within a very short time, which involves phase transition, heat transfer and mass transfer, etc [20, 21]. Figure 1(a) depicts a schematic of the AlSi10Mg metallic powder during the SLM process. The environment consists of an argon (Ar) atmosphere, a metal substrate and a layer of AlSi10Mg powder deposited on the metal substrate. A part of the heat can be dissipated by convection and radiation when the surface of the powder bed is irradiated with a laser beam. The remaining energy of the laser is absorbed by the powder and transfers to the substrate. As a result, localized melting and rapid heating occur, and metallurgical bonds between adjacent tracks are formed when the melt pool has migrated far from the heat source by the laser. Meanwhile, the melted metal fluctuates within the molten pool are driven by surface tension, Marangoni effect, gravity, hydrostatic pressure, etc. The interface between argon and the molten pool affects the quality of the final product, which is called free surface [22]. It is necessary to build a powder scale model to make an accordance with the real operating conditions, which takes the coupled thermal-fluid behaviors of the environment argon atmosphere, the molten metallic powder and the solid metal into consideration. Figure 1(b) establishes a geometry model of the AlSi10Mg metallic powder during the SLM process, which consists of a substrate, a powder bed and a gas region. The laser moves from left to right in the first track, and from right to left in the second track. The instance between the central lines of two neighboring scanning channels is defined as the hatch spacing (S). The substrate and the protecting Ar are represented by the blue block and the grey region, respectively. The AlSi10Mg powders are located on the top surface of the substrate by the sphere-like particles.
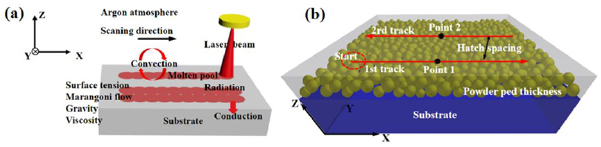
Figure 1. Physical model: (a) schematic of the AlSi10Mg metallic powder during SLM; (b) the 3D geometry model.
Download figure:
Standard image High-resolution image2.2. Mathematical models
On the basis of the above phenomena for the metallic powder during SLM, the following assumptions are made considering the major mechanisms to simplify the calculation [23]:
- (a)the fluid flow in the melt pool is Newtonian and laminar;
- (b)the thermophysical and the fluid properties of AlSi10Mg are functions of temperature.
Following these assumptions, the volume of fluid (VOF) for tracking the free surface (interface between the gas and the metal), the conservation of mass, momentum and energy for both Ar and AlSi10Mg are built for the complex physical phenomena during the SLM process of the AlSi10Mg metallic powder. By using the VOF method, the continuity equation for the volume fraction of gas and metal has the following form:


where t is time,  is the flow velocity, αi is the volume fraction between 0 and 1, the subscript 1 and 2 represents the gaseous and the metallic phases,
  is the volume averaged density computed by

Additionally, due to the fact that the metallic phase undergoes a process of melting and solidification, thus the density of metal should be described as

where the subscripts s and l represent the solid and the liquid metal, the liquid fraction β reflecting the melting and solidification process is expressed as

where Ts and Tl are the solidus and the liquidus temperatures.
The mass conservation equation is written as

The momentum equation taking the energy dissipation in the mushy zone, the interfacial force and Marangoni effect into consideration expressed as

where p is the pressure,  is gravity acceleration,
  is the volume averaged dynamic viscosity relating with temperature computed by

 is the damping force reflecting the energy dissipation written as

where κ is the permeability coefficient and o is a small constant to avoid division by zero.
The surface tension force  illustrates the interfacial forces towards the metallic phase described as

where σ is the surface tension coefficient relating to temperature and ζ is the curvature of the free surface written as

and  is the unit normal vector at the free surface written as

The Marangoni shear force  is described as

The recoil vapor pressure  is described as

where p 0 is the ambient pressure, Lv is the latent heat of vaporization, Tv is the evaporation temperature, M is the molar mass, and R is the universal gas constant.
The energy conservation equation considering the heat absorption from the laser is written as

where H is the mass-averaged variable treated by the VOF model written as

where the enthalpy Hi for each phase is computed as the sum of the sensible enthalpy hi and the latent heat ΔHi

where Lm is the latent heat of the melting of AlSi10Mg, hi is based on the specific heat of each phase as

where href is the reference enthalpy, Tref is the reference temperature and cp is the specific heat at constant pressure.
 is the volume thermal conductivity expressed as

Furthermore, the specific heat and the thermal conductivity of the metallic phase considering the melting and solidification process should be computed by


A rotary body heat source is adopted to describe the heat absorption from the moving laser beam. The affecting radius of the heat source varies as Gaussian attenuation in depth direction [24]. Meanwhile, it is worth noting that the heat could only be absorbed by the metal phase and the gas phase in the laser action region actually. Therefore, we develop the heat source SL as

where η is the absorption coefficient, d is the effective affecting depth of the heat source and selected as the powder bed thickness, R is the beam radius, P is the laser power, V is the scanning velocity, x1st and x2nd are the starting x coordinates for the first and second tracks, y 1st and y 2nd are the starting y coordinates for the first and second tracks, ttotal is the total calculation time for the powder-scale multi-physics simulation of the multi-track SLM process.
The evaporation heat loss is

where  is the volume heat capacity expressed as

The initial and boundary conditions should be given to solute the governing equations. The initial AlSi10Mg and ambient Argon temperatures are regarded as room temperature. On the bottom and lateral surfaces of the substrate, the boundary conditions are given by the heat flux considering convection and radiation

where ε is the emissivity, τ is Boltzmann constant and  is the environment temperature.
On the top and lateral surfaces of the zone within the gas, the boundary conditions are given by both the heat flux equation (25) and the pressure outlet condition. At the free surface, the shear stress and normal pressure should balance as the boundary conditions, which are


where  and
and  are the tangential and normal speed vectors, and
  is the tangential direction at the free surface.
3. Material properties
In this study, the chemical composition of AlSi10Mg powder is shown in table 1. The size of the particle with the distribution for the powders is shown in figure 2. The particle size distribution, i.e. D10, D50 and D90 of the powder, are 22.51, 26.12 and 30.45 µm as shown in figure 2(b). The thermal conductivity, the special heat, the viscosity and the mass density of AlSi10Mg are the temperature dependent functions and calculated by fitting the data from [25]. Other material properties of AlSi10Mg are shown in table 2 and the thermophysical and the fluid properties of Ar are shown in table 3.
Table 1. Composition of AlSi10Mg powder.
| Element | Al | Si | Mg | Fe | Mn | Ni | Ti | Cu |
|---|---|---|---|---|---|---|---|---|
| Composition (wt%) | Balance | 10.2 | 0.35 | 0.5 | 0.5 | 0.05 | 0.12 | 0.004 |
Table 2. Material properties of AlSi10Mg [25, 26].
| Property | Unit | Value |
|---|---|---|
| η | — | 0.09 |
| ε | — | 0.4 |
| κ | Kg · m−3 · s−1 | 106 |
| hc | W · m−1 · K−1 | 82 |
| Lm | J kg−1 | 3.7 × 10⁵ |
| Lv | J kg−1 | 1.08 × 10⁷ |
| Ts | K | 830 |
| Tl | K | 869 |
| Tv | K | 2743 |
| σ | N m−1 | 1.000 726–1.52 × 10⁻⁴T |
Table 3. Thermophysical and fluid properties of Ar.
| Property | Unit | Value |
|---|---|---|
| ρ1 | kg m−3 | 1.6228 |
| cp,1 | J · kg−1 · K−1 | 520.64 |
| k1 | W · m−1 · K−1 | 0.0158 |
| µ1 | kg · m−1 · s−1 | 2.125 × 10⁵ |

Figure 2. Size of the particle with distribution for powders.
Download figure:
Standard image High-resolution image4. Experimental procedures
AlSi10Mg powder, as the starting material, was used to fabricate cubic samples with a dimension of 10 × 10 × 10 mm in this study. The AlSi10Mg samples were built using an EOS M290 system with an available building space of 250 × 250 × 325 mm3. The SLM system was equipped with a 400 W Yb-fiber laser and a 100 µm laser spot size. The manufacturing process was conducted under an argon atmosphere. The metallographic samples were prepared using conventional methods (ground, polished, and etched), and observed using an Axio Scope A1 optical microscope (OM) and a JSM-7610F Plus scanning electron microscope (SEM) to reveal the size, the distribution and the morphology for the micro-structures of the cross-sections in the products. The porosity was measured using micrographs to study the large areas and the porosity area fraction quantified using ImageJ. The morphology and the roughness of the top surface of the as-fabricated samples were measured by a KEYENCE VK-X Series laser scanning confocal microscope (LSCM). The laser power, the powder bed thickness and the radius of laser beam spot size were 370 W, 40 µm and 50 µm, respectively. Four scanning velocities and three hatch spacing values used during SLM are shown in table 4.
Table 4. SLM processing parameters.
| No. | V (mm s−1) | S (µm) |
|---|---|---|
| 1 | 1000 | 150 |
| 2 | 1300 | 150 |
| 3 | 1600 | 150 |
| 4 | 1900 | 150 |
| 5 | 1300 | 100 |
| 6 | 1300 | 200 |
5. Results and discussion
5.1. Simulation process
In the simulation, a computation domain is shown in figure 1(b). The geometry model is established with a size of 600 × 500 × 220 µm3, which consists of a 120 µm tall substrate, a 40 µm tall powder bed and a 60 µm tall gas region. The temperature and the volume fraction of the powder bed are initialized by our FORTRAN codes. The random particle coordinates in the powder bed are obtained by using the particle size and the distribution observed in the experiment with a discrete element method (DEM) [27]. The starting coordinates for the first and second tracks are shown in table 5 corresponding to the processing conditions in table 4. The FORTRAN codes are written for the temperature dependent material properties and the source terms in the governing equations. Fluent is used to solve the powder scale multi-physics mathematical model for the flow, heat and mass transfer of AlSi10Mg and Ar during SLM. The mesh size for the initial gas region, the powder bed and the substrate are 6, 4 and 6 µm, respectively. The number of cells is about 750 000. The physical time varies from 520 to 1000 µs, and the computation time on a desktop computer with an Intel Core E5-2699 v4 using 36 cores varies from about 58 to 102 h dependent on the variable scanning velocity.
Table 5. Starting coordinates for the first and second tracks.
| No. | x1st (µm) | y 1st (µm) | x2nd (µm) | y 2nd (µm) |
|---|---|---|---|---|
| 1 | 50 | 175 | 550 | 325 |
| 2 | 50 | 175 | 550 | 325 |
| 3 | 50 | 175 | 550 | 325 |
| 4 | 50 | 175 | 550 | 325 |
| 5 | 80 | 220 | 520 | 320 |
| 6 | 50 | 150 | 550 | 350 |
5.2. Morphology of molten pool
During the SLM process, the deposition quality of each track is important for the final product and affected severely by the processing parameters. Figure 3 shows the morphology (shape and size) of the molten pools in the first track of No. 1–4 in which the scanning velocity varies from slower to faster. Figure 3 shows both the simulation results of the liquid fractions on the Y–Z plane in the first track at time ttotal/4, which could represent the shapes of the molten pools and the corresponding OM results, which are depicted with smaller pictures in the bottom right corners. The molten pools calculated by the simulation and observed by the experiment are shaped with black dashes. The values of these two sizes are given quantitatively in figure 4 for both the simulation and the experimental results. As the scanning velocity increased from 1300 to 1900 mm s−1, the simulated width of the melt pool decreased from 194.2 to 120.7 µm and the depth reduced from 89.7 to 68.9 µm. The experimental results show that when the scanning velocity increased from 1300 to 1900 mm s−1, the measured width of the melt pool decreased from 187.2 to 117.2 µm and the depth reduced from 88.2 to 72.4 µm. As seen in figure 4, the deviation of the numerical modeling from the experiment was less than 4%. The simulation sizes are in good agreement with the experimental ones. Compared with the previous work [28, 29], this simulation model is closer to the actual manufacturing process due to the factors such as recoil pressure, molten pool flow and surface tension etc. It can be seen that the width and the depth of the molten pool get smaller with the increasing of the scanning velocity. This phenomenon could be explained by equation (22). It tells that the heat source would increase when the scanning velocity decreases, leading to more and more heat transfers to the metallic powders. The temperature of the powders will increase more quickly with a slower scanning velocity. Thus, the zone with the liquid metal gets wider when the scanning velocity decreases.
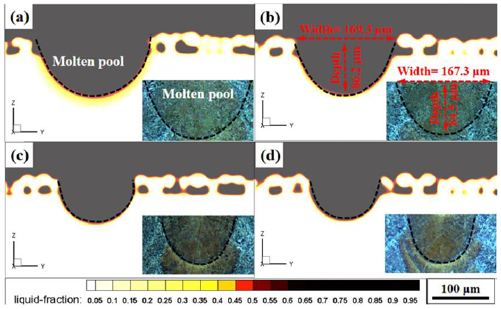
Figure 3. The simulation and experimental results of the molten pool morphology: (a) No. 1; (b) No. 2; (c) No. 3; (d) No. 4.
Download figure:
Standard image High-resolution image
Figure 4. The size of the molten pool under different laser scanning speeds in the simulation and experiments.
Download figure:
Standard image High-resolution image5.3. Temperature history
The temperature profile along the scanning direction during SLM is another important factor influencing the quality of the final product. Figure 5 shows the temperature histories of the middle points at both the first and the second tracks. Figure 5(a) describes the effects of the scanning velocity on the temperature histories. It shows that the peak temperature goes higher with the decreasing of the scanning velocity. The peak temperature at the midpoint of the first track was calculated to be 1860, 1723, 1644, and 1590 K, for a scanning velocity of 1000, 1300, 1600, and 1900 mm s−1, respectively. Similarly, the peak temperature at the midpoint of the second track was calculated to be 1983, 1886, 1790, and 1725 K, respectively (see figure 5(a)). The solidification position of the first track will re-melt once the second track starting. The heat from the laser will transfer to the first track again and affect the cooling rate of the powder in the first track. Furthermore, the smaller the scanning velocity, the greater the degree of re-melting occurs. It can be considered that the internal porosity formed from the re-melting of the solid would be lower with the smaller scanning velocity, however, it is also highly likely to cause over-melting. Figure 5(b) describes the effects of the hatch spacing on the temperature histories. The peak temperature at the midpoint of the first track was calculated to be 1700, 1723, and 1756 K, for a hatch spacing of 100, 150, and 200 µm, respectively. Likewise, the peak temperature at the midpoint of the second track was calculated to be 1860, 1886, and 1882 K, respectively. It shows that the peak temperature and the temperature gradient tend to be the same when the hatch spacing increases, indicating that when the hatch spacing gets larger, the mutual influence of the temperature distributions between adjacent scanning channels is reduced, and the energy exchange between them is weakened.

Figure 5. Simulation results of the temperature histories under different process parameters: (a) No. 1–4; (b) Nos 5, 2 and 6.
Download figure:
Standard image High-resolution image5.4. Anatomy of free surface
The surface quality is an important indicator for the quality evaluation of the products. In order to understand the change of surface quality with different laser processing conditions, the free surface morphologies of the as-produced samples were investigated. Figure 6 shows the free surface structures by SEM of the samples fabricated under scanning velocities of 1000, 1300, 1600 and 1900 mm s−1. As shown in figure 6(a), at a lower V of 1000 mm s−1, the scan tracks showing the flat surface and overlapped overmuch with the adjacent tracks. When V increases to 1300 mm s−1, the free surface morphologies showing the laser scanned tracks are evenly lined up and regularly overlapped with the neighboring tracks (figure 6(b)). At a higher V of 1600 mm s−1, the surface structure produces a 'balling' effect and cave-like pores because the high scanning velocity promotes instability in the molten pool and leading to the discontinuity in the scan tracks (figure 6(c)). When V increases to 1900 mm s−1, the tracks become increasingly irregular-shaped (micro-humps) and even contain a few pores and un-melted particles (figure 6(d)).

Figure 6. SEM images showing the typical morphologies of the free surface of: (a) No. 1; (b) No. 2; (c) No. 3; (d) No. 4.
Download figure:
Standard image High-resolution imageThe typical surface morphologies of SLM-processed samples under various hatch spacing are shown in figure 7. It was obvious that the formation of the defects (micro-humps and interior porosity) in the SLM-processed samples was strongly influenced by the applied hatch spacing. As shown in figures 7(a) and (b), the smooth and coherent metallurgical bonded surface without any discontinuity and porosity were observed on the free surface of the samples as the S of 100 and 150 µm. In contrast, an amount of cave-like pores, some insufficient melting powder and regularly overlapped with the neighboring tracks, were presented on the surface of the figure 7(d). As a result, the higher hatch spacing leads to poor metallurgical bonding of the surface structures of the SLM-processed samples.
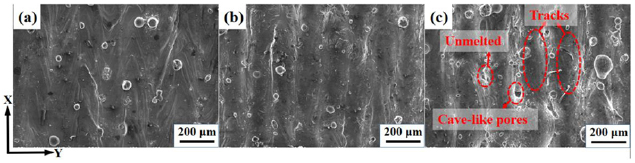
Figure 7. SEM images showing the typical morphologies of the free surface of: (a) No. 5; (b) No. 2; (c) No. 6.
Download figure:
Standard image High-resolution imageIn order to illustrate the phenomena in figures 6 and 7, the morphology of the free surfaces with the temperature distributions at time = ttotal (figures 8(a)–(d), 9(a)–(c)) and the velocity fields near the laser beam spot at this time (figures 8(e)–(h) and 9(d)–(f)) under different processing parameters are obtained from simulation. Firstly, the commonality of the morphology of the free surface under different processing parameters is described. The melted particles are driven by the surface tension and the hydrostatic pressure then pulled towards the substrate, which is known as the 'wetting' effect, leading to the melted metal bonds with the substrate closely and the volume shrinkage occuring as shown in figure 6(d). Due to that, the surface tension coefficient is a temperature dependent function, Marangoni effect occurs forming the ripples on the free surface, which drives the fluid to flow from the high temperature zone to the low temperature zone. Secondly, the effect of the scanning velocity on the morphology of the free surface is analyzed as follows. In figure 8(a), when the scanning velocity is 1000 mm s−1, the powder has a high degree of liquefaction and a smooth free surface form, but the direction of the ripple is diverse, resulting in complicated energy transfer between the two scanning channels. In figure 8(b), when the scanning velocity is 1300 mm s−1, a smooth free surface also forms and the direction of the ripple is monotonous, and the energy exchange between the scanning channels is balanced. In figure 8(c), when the scanning velocity is 1600 mm s−1, in order to make the system of the molten metal surface and the surrounding medium surface have the minimum free energy, the surface shape of the molten metal is converted to the spherical surface driven by the surface tension, i.e. the 'balling' effect, the roughness of the free surface becomes larger. The cave-like pores as shown in figures 6(c) and 8(c) begin to form due to that the unstable melt metal flows away from the scanning direction and is solidified in the gas before bonding with the previous layer [15]. In figure 8(d), when the scanning velocity is 1900 mm s−1, the energy input from the laser is reduced, the un-melting particles and the cave-like pores appear between the scanning channels resulting in the free surface rougher. From figures 8(e)–(h), we can see that the velocity magnitude in the molten pool becomes smaller with the higher scanning velocity, because the energy input from the laser is weakened using this processing parameter resulting in lower kinetic energy of the conversion. The molten pool is unstable near the laser beam spot with the formation and collapse of the depressed portion, thus the movement of the molten material becomes complicated and the flow direction is diverse, especially at the defective points. Marangoni flow can be seen clearly in these figures. Finally, from figure 9 the effect of the hatch spacing on the morphology of the free surface is analyzed as following. When the hatch spacing increases, the overlapping area between the adjacent scanning channels is reduced and the influence from the flow field in the second track on that in the first track is weakened. As the hatch spacing increases, the 'balling' effect even un-melting particles occur on the free surface, resulting in larger surface roughness. These simulation results are also in good agreement with the experimental findings reported in the literature [4].
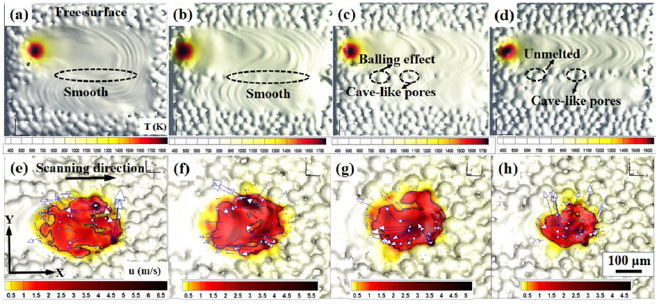
Figure 8. Numerical results of the temperature distributions (a)–(d) and velocity distributions (e)–(h) at the free surface under different scan speeds. (a) and (e) No. 1; (b) and (f) No. 2; (c) and (g) No. 3; (d) and (h) No. 4.
Download figure:
Standard image High-resolution image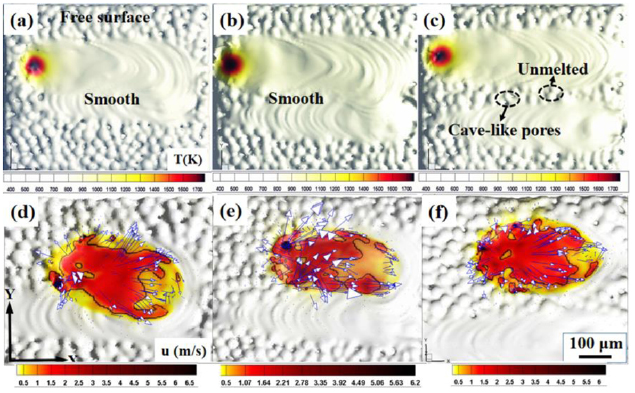
Figure 9. Numerical results of the temperature distributions (a)–(c) and velocity distributions (d)–(f) at the free surface under different hatch spacing. (a) and (d) No. 5; (b) and (e) No. 2; (c) and (f) No. 6.
Download figure:
Standard image High-resolution image5.5. Porosity formation
Figure 10 shows the influence of the scanning velocity variation on the porosity of the AlSi10Mg samples. As shown in figure 10(a), the results indicate that the samples with a scanning speed of 1000 mm s−1 exhibited a relatively high porosity of 1.51%. This is due to the excessive energy leads to the extensive formation of the metallurgical pores at a slower velocity (1000 mm s−1). The porosity is particularly low (0.13%) when the laser scanning velocity increased to 1300 mm s−1. Continuing increasing the scanning velocity leads to the number of the pores growing (increased to 0.87% and 1.57%, respectively). Moreover, it is noted that the pores containing a few un-melted powder particles can be observed in figure 10(d). The influence of the hatch spacing on the porosity development is also shown in figures 10(e)–(g). Obviously, increasing the hatch spacing above or below value of 150 µm leads to that the fraction and the size of pores increase (increased to 1.65% and 1.81%, respectively). Particularly, when the hatch spacing is below 150 µm, the porosity level increases rapidly (figure 10(e)). In addition, when the hatch spacing increases to 200 µm, the pores present obvious un-melted or partially melted powder particles within them (figure 10(g)). As reported by Yusuf et al [30], the laser energy absorbed per unit area decreases with increasing hatch spacing.

Figure 10. Optical micrographs of the porosity evolution in AlSi10Mg under different processing conditions: (a) No. 1; (b) No. 2; (c) No. 3; (d) No. 4, (e) No. 5; (f) No. 2; (g) No. 6.
Download figure:
Standard image High-resolution imageFigures 11 and 12 show the morphology of the molten pool of the Y–Z cross-section after the laser beam passing two channels under different processing parameters. D is defined as the thickness of the overlapping zone between two channels and LT represents the powder bed thickness. From figures 11(a) and (b), we can see that the powder can be melted effectively (D > 1.5LT and D > 2LT, respectively) using the scanning velocity as 1000 mm s−1 and 1300 mm s−1, but the solidification zone in the first track would be re-melting when the laser moves in the second track with bringing heat again influencing on the shape of the molten pool. From figures 11(c) and (d), D is smaller than LT, indicating that the powder could not be fully melted using these processing parameters, and the pores full of gases could be found in the overlapping zones. From figure 12, we can see that the deviation molten pool occurs resulting in the direction of the heat and mass transfer inconsistent with expectations when using a small hatch spacing. When the hatch spacing is large, the un-melting particles between the two scanning channels appear due to the lower input energy and the inadequate flow in the overlapping zone leading to the gas flow into it. In general, the processing parameter of No. 2 is the best one for eliminating pores.
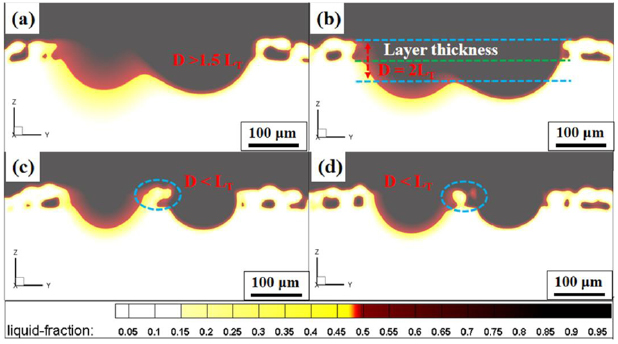
Figure 11. Simulation results of the porosity formation at different scan speeds: (a) No. 1; (b) No. 2; (c) No. 3; (d) No. 4.
Download figure:
Standard image High-resolution image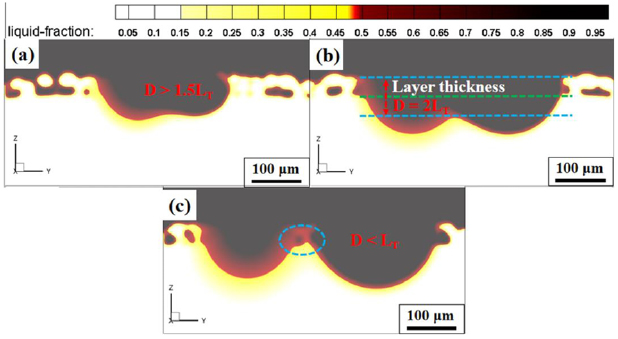
Figure 12. Simulation results of the porosity formation at different hatch spacing: (a) No. 5; (b) No. 2; (c) No. 6.
Download figure:
Standard image High-resolution image5.6. Effect of energy density
The surface quality and the porosity of the SLM-fabricated products are two of the main factors in evaluation for mechanical properties in application. The energy density (E) is defined here to evaluate the quality of the AlSi10Mg product, which is

The SLM process is affected by different major processing parameters. The same laser power (P) and layer thickness (LT) are used in this work. Therefore, the effect of energy density indicates the combined effect of scanning speed and hatch space based on the equation (28). Figure 13 shows the relation between the energy density with the average roughness of the free surface with both the simulation and experimental results. It indicates that the average roughness decreases when the energy density gets larger. When the value of E is 32.5 J mm−3, the average roughness reaches to the maximum value of 30.89 µm. The value of average roughness decreases to 11.34 µm as E increases to 71.2 J mm−3. The 'balling' effect occurs due to the fact that the liquid phase is insufficient at a low value of E, resulting in poor fluidity of the powder; meanwhile, the liquid lifetime of the molten pool is short. When the value of E increases, the powder bed undergoes melting to form an appropriate amount of liquid phase. In this case, the viscosity and the surface tension coefficient of the melt pool are lowered, caused by the temperature dependent functions. Thus the temperature in the molten pool rises with a larger liquid fraction, as equation (5) shows. The viscous shear decreases under this situation leading a smaller Marangoni shear as seen in equation (26). Then the solidification time of the molten pool is longer resulting in the neighboring tracks with a better metallurgical bonding quality. These phenomena are similar to those previous reported by the literature [31, 32]. They revealed that the relation between energy input and surface morphologies during the additive manufacturing of parts. Overall, the numerical results from the present powder scale multi-physics model are comparable with experimental observations. The simulation model can reproduce the surface morphologies well in different processing conditions. The mesoscopic scale model and computational framework can be further predicted and used to investigate other phenomena that often occur in the SLM process to understand the underlying mechanism and to improve the surface morphologies and pore defects.
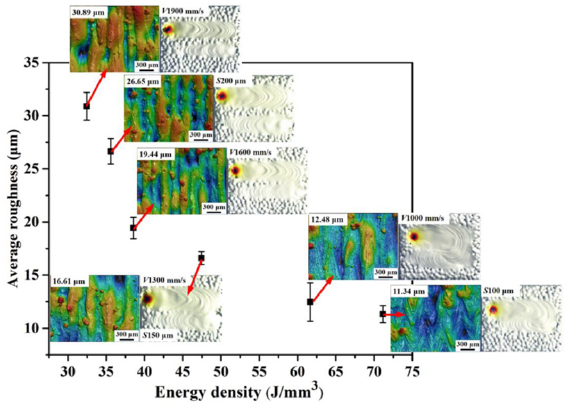
Figure 13. Validation of the influence of energy density on surface roughness by simulation and experimental results.
Download figure:
Standard image High-resolution imageFigure 14 shows the relation between the energy density with the porosity of the AlSi10Mg product with both the simulation and experimental results on the cross-sections. It indicates that with the increase of E, the porosity of the samples decreases first and then increases. Both the area fraction and the size of pores decrease (from 1.8% to 0.13%) continuously with increasing E from 32.5 to 47.4 J mm−3. Moreover, it is noted that the pores observed show obvious un-melted or partially melted powder particles (which are usually spherical) within them (see figures 10(d) and (g)). However, when the value of E is above 47.4 J mm−3, the porosity level rises (from 0.13% to 1.65%) rapidly and the pores become more elongated. Combining with the results in figures 8 and 9, despite a dense part with a small porosity being produced by increasing the energy density, it should not exceed a critical value, otherwise, the flow velocity in the molten pool will increase within a certain time leading to an unstable flow near the laser beam spot. Moreover, due to the competitive effects of the damping force, the surface tension and Marangoni shear, the flow near the laser beam spot in the molten pool showing high instability leads to the formation of more pores during the SLM process. Furthermore, the formation of pores was chiefly due to incomplete re-melting of metal powder under the activity of a high scanning velocity or large hatch spacing. On the other side, it was possible that such a high scanning velocity or large hatch spacing tended to result in a limited amount of molten liquid and a short lifespan of pool, which provided an insufficient time for molten liquid material to merge into the adjacently as-built layer before solidification happened [17]. Consequently, an appropriate laser process parameter played an important role in controlling the inter-layer porosity and the metallurgical bonding properties of neighboring layers during the SLM process.
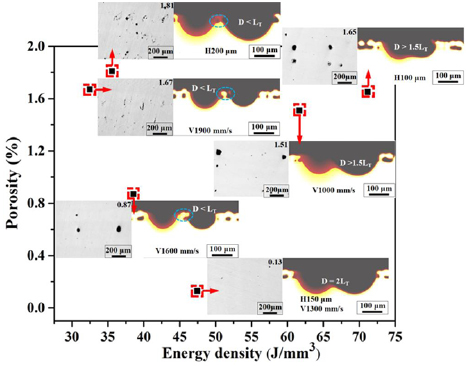
Figure 14. Validation of the influence of energy density on porosity by simulation and experimental results.
Download figure:
Standard image High-resolution imageTaking the results in figures 13 and 14 into consideration, a process map with a schematic diagram of the SLM process for AlSi10Mg powders can be acquired as shown in figure 15. The interactive area between two adjacent scan tracks overlapping phenomena that cause powder fusion (see figure 15(a)). Obviously, several manufacturing regions exist, which correspond to different porosity, surface roughness, and hence mechanical properties of the SLM-fabricated parts. Significantly low energy input can lead to excessive porosity and surface roughness of the SLM-produced parts (see figure 15(b)). Although high energy input can obtain a smooth surface topography, its porosity is still high due to over-melting. As shown in equation (28), the large hatch spacing (200 µm) and high scanning velocity (1900 mm s−1) result in low energy input. This causes limited fusion of the powders resulting in distinct scan tracks and pronounced surface balling (see figures 8 and 9). In contrast, the high energy input is obtained with low scanning velocity (1000 mm s−1) and small hatch spacing (100 µm). The high energy density is delivered causing excessive powder fusion. This result in the powder has a high degree of liquefaction and a smooth free surface forms, but the direction of the ripple is diverse, resulting in complicated energy transfer between the two scanning channels. At the same time, the excessive energy input leads to the extensive formation of the metallurgical pores during the SLM process. An optimized region is obtained, in the region, the scanning velocity and hatch spacing enable adequate fusion of the powders, resulting in final parts with high density and improved surface finish. Actually, the as-fabricated samples with very low porosity (high relative density of 99.87%) and good surface roughness (16.6 µm) were obtained at a hatch spacing of 150 µm, scanning velocity of 1300 mm s−1, and energy density of 47.4 J mm−3. In conclusion, a method for evaluating the comprehensive effect of the processing parameters based on an integration of mesoscale simulation and experimental characterization is proposed to guide the quality evaluation of SLM-fabricated metallic product in a quantitative and efficient manner.
Figure 15. Schematic of the SLM process integrated with the optimum process conditions that relate scanning velocity, hatch spacing and energy density.
Download figure:
Standard image High-resolution image
6. Conclusions
In this study, a method for evaluating the comprehensive effect of multiple processing parameters during SLM is proposed based on an integration of mesoscale simulation and experimental characterization. The physical mechanism during the AlSi10Mg AM process can be clearly analyzed and the optimization interval of the SLM processing parameters can be provided using this method. The integration of simulation and experiment results show that:
- (a)The physical mechanism of metal during SLM relates not only with the heat transfer in metal and gas, but also close to the flow in the molten pool. The morphology of the free surface is driven by surface tension, Marangoni shear, gravity, etc. The performance of the final metallic product is a result of the thermal-fluid coupled behavior during SLM.
- (b)The processing parameters affect the surface morphology and the porosity in the AlSi10Mg products. When the scanning velocity or the hatch spacing increase, the 'balling' effect comes easily, and the cave-like pores and the un-melting region begin to appear. However, the size of the molten pool grows when the scanning velocity decreases to some degree. The quality of the final product would be declined using fast scanning velocity, large hatch spacing or too slow scanning velocity.
- (c)The quality of the AlSi10Mg product by the SLM process relates closely to the energy density, which is an index for evaluating the comprehensive effect of multiple processing parameters. Although the roughness of the free surface is small with a large energy density, the relative density of the product decreases. Therefore, it is necessary to choose a moderate energy density through comprehensive comparison of multiple indicators to improve the quality of the SLM-fabricated metallic product.
Acknowledgments
This work was supported by the National Natural Science Foundation of China (11802020, 11802018 and 11732002) and the China Postdoctoral Science Foundation (2018M630079).