


1 Introduction
A remarkable feature of turbulent flows is that, amid the inherent disorder in both time and space, they frequently give rise to a surprisingly organized flow motion on very large scales. Such very-large-scale structures in the fully turbulent regime have been reported, for example, for turbulent boundary layers (Hutchins & Marusic Reference Hutchins and Marusic2007a), plane Couette flow (Lee & Moser Reference Lee and Moser2018) and Taylor–Couette turbulence (Huisman et al. Reference Huisman, Van Der Veen, Sun and Lohse2014). Here we focus on superstructures in turbulent Rayleigh–Bénard convection (RBC), which is an idealized configuration that is widely used to study thermal convection (Ahlers, Grossmann & Lohse Reference Ahlers, Grossmann and Lohse2009; Lohse & Xia Reference Lohse and Xia2010; Chillà & Schumacher Reference Chillà and Schumacher2012; Verma Reference Verma2018). The strength of the non-dimensional thermal driving in RBC is given by the Rayleigh number  $Ra$, while the dimensionless heat transfer is characterized by the Nusselt number
  $Nu$.
$Nu$.
Large-scale organization in convective flows is widespread. An astonishing example is the formation of so-called cloud streets in the atmosphere that can extend for hundreds of kilometres (e.g. Young et al. Reference Young, Kristovich, Hjelmfelt and Foster2002). Studying related features in RBC requires a cell with a large aspect ratio  $\unicode[STIX]{x1D6E4}$. Naturally, this poses a challenge to experiments and simulations. Experimentally (e.g. Fitzjarrald Reference Fitzjarrald1976; Sun et al. Reference Sun, Ren, Song and Xia2005a,Reference Sun, Ren, Song and Xiab; Zhou et al. Reference Zhou, Liu, Li and Zhong2012; Du Puits, Resagk & Thess Reference Du Puits, Resagk and Thess2013; Hogg & Ahlers Reference Hogg and Ahlers2013; Cierpka et al. Reference Cierpka, Kästner, Resagk and Schumacher2019), it is very challenging to extract flow information beyond global parameters or local measurements of turbulence statistics. On the other hand, simulations for large aspect ratios are very costly if the thermal driving is sufficiently strong to achieve a moderately or even a strongly turbulent state. The first to tackle the problem numerically were Hartlep, Tilgner & Busse (Reference Hartlep, Tilgner and Busse2003), and several related studies have since been presented in the literature (Parodi et al. Reference Parodi, von Hardenberg, Passoni, Provenzale and Spiegel2004; Hartlep, Tilgner & Busse Reference Hartlep, Tilgner and Busse2005; Shishkina & Wagner Reference Shishkina and Wagner2005, Reference Shishkina and Wagner2006, Reference Shishkina and Wagner2007; Von Hardenberg et al. Reference Von Hardenberg, Parodi, Passoni, Provenzale and Spiegel2008; Bailon-Cuba, Emran & Schumacher Reference Bailon-Cuba, Emran and Schumacher2010; Emran & Schumacher Reference Emran and Schumacher2015; Sakievich, Peet & Adrian Reference Sakievich, Peet and Adrian2016). Very recently, the available ranges of large-aspect-ratio simulations have been extended significantly in Prandtl number (
 $Pr$) by Pandey, Scheel & Schumacher (Reference Pandey, Scheel and Schumacher2018) and in
  $\unicode[STIX]{x1D6E4}$ as well as in
  $Ra$ by Stevens et al. (Reference Stevens, Blass, Zhu, Verzicco and Lohse2018).
From these papers, it has become clear that in RBC so-called superstructures exist at higher  $Ra$. These superstructures are significantly larger than the convection rolls at onset (see e.g. Drazin & Reid (Reference Drazin and Reid2004)) or as those in the weakly nonlinear regime (Morris et al. Reference Morris, Bodenschatz, Cannell and Ahlers1993). It is widely observed that the superstructure size increases with
  $Ra$ (Fitzjarrald Reference Fitzjarrald1976; Hartlep et al. Reference Hartlep, Tilgner and Busse2003; Pandey et al. Reference Pandey, Scheel and Schumacher2018; Green et al. Reference Green, Vlaykov, Mellado and Wilczek2020), while the
  $Pr$ dependence appears to be more complicated. For the latter, Pandey et al. (Reference Pandey, Scheel and Schumacher2018) report that at
  $Ra=10^{5}$ the largest structures are found for
  $Pr\approx 7$, but
  $Pr$ variations over a significant range at higher
  $Ra$ have not been reported yet. Stevens et al. (Reference Stevens, Blass, Zhu, Verzicco and Lohse2018) showed that very large domain sizes up to
  $\unicode[STIX]{x1D6E4}=64$ are necessary to fully converge the size of the superstructures at
  $Ra=10^{8}$. Finally, Von Hardenberg et al. (Reference Von Hardenberg, Parodi, Passoni, Provenzale and Spiegel2008) and Pandey et al. (Reference Pandey, Scheel and Schumacher2018) demonstrate that superstructures evolve on time scales much longer than the free-fall time scale.
There is no consensus yet on how to best extract and quantify the superstructures in RBC. Researchers have relied on peaks in velocity and/or temperature power spectra (Von Hardenberg et al. Reference Von Hardenberg, Parodi, Passoni, Provenzale and Spiegel2008; Pandey et al. Reference Pandey, Scheel and Schumacher2018; Stevens et al. Reference Stevens, Blass, Zhu, Verzicco and Lohse2018), velocity–temperature co-spectra (Fitzjarrald Reference Fitzjarrald1976; Hartlep et al. Reference Hartlep, Tilgner and Busse2003; Green et al. Reference Green, Vlaykov, Mellado and Wilczek2020) or so-called integral length scales (Parodi et al. Reference Parodi, von Hardenberg, Passoni, Provenzale and Spiegel2004; Stevens et al. Reference Stevens, Blass, Zhu, Verzicco and Lohse2018) to determine the structure size. A puzzling and as yet unexplained observation is that superstructures in the temperature ( $\unicode[STIX]{x1D703}$) field are larger than in the vertical-velocity
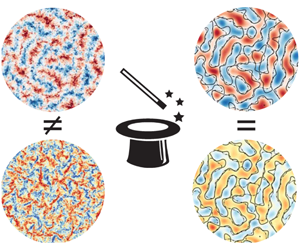
  $w$ field (Pandey et al. Reference Pandey, Scheel and Schumacher2018; Stevens et al. Reference Stevens, Blass, Zhu, Verzicco and Lohse2018) when the structure size is determined based on the peaks in the power spectrum or the corresponding integral length scale. Also, visually, the difference between the temperature and vertical-velocity fields can easily be observed in the snapshots of the flow at mid-height, which are presented in figure 1. This figure reveals that the vertical-velocity field is dominated by significantly smaller structures than the temperature field. Moreover, the correlation between the two quantities appears much lower than one would naively expect, given that the temperature fluctuations provide the driving of
  $w$. These observations seem at odds with the notion that superstructures in RBC form large-scale convection rolls for which temperature and velocity scales should be of the same size.
To address and clarify this issue along with related questions, we use the dataset of Stevens et al. (Reference Stevens, Blass, Zhu, Verzicco and Lohse2018) to assess energy distributions and coherence on a scale-by-scale basis. Before presenting our results in § 3, we provide the relevant details on the dataset of Stevens et al. (Reference Stevens, Blass, Zhu, Verzicco and Lohse2018), together with the parameters of additional simulations performed for this study, in § 2. We summarize our findings in § 4.

Figure 1. Snapshots of the temperature (a) and the vertical-velocity (b) field at mid-height for a simulation in a  $\unicode[STIX]{x1D6E4}=32$ cell with
  $Pr=1$ at
  $Ra=10^{8}$. The diameter of the circles in both panels indicates the superstructure size
  $\hat{l}=6.3$ (see table 1).
2 Dataset
We solve the Boussinesq equations with the second-order staggered finite difference code AFiD. The code has been extensively validated and details of the numerical methods can be found in Verzicco & Orlandi (Reference Verzicco and Orlandi1996), Stevens, Verzicco & Lohse (Reference Stevens, Verzicco and Lohse2010), Stevens, Lohse & Verzicco (Reference Stevens, Lohse and Verzicco2011), van der Poel et al. (Reference van der Poel, Ostilla-Mónico, Donners and Verzicco2015) and Zhu et al. (Reference Zhu, Phillips, Arza, Donners, Ruetsch, Romero, Ostilla-Mónico, Yang, Lohse and Verzicco2018). The governing equations in dimensionless form read:
 $$\begin{eqnarray}\displaystyle & \displaystyle \frac{\unicode[STIX]{x2202}\boldsymbol{u}}{\unicode[STIX]{x2202}t}+\boldsymbol{u}\boldsymbol{\cdot }\unicode[STIX]{x1D735}\boldsymbol{u}=-\unicode[STIX]{x1D735}p+\sqrt{\frac{Pr}{Ra}}\unicode[STIX]{x1D6FB}^{2}\boldsymbol{u}+\unicode[STIX]{x1D703}\hat{z}, & \displaystyle\end{eqnarray}$$
 $$\begin{eqnarray}\displaystyle & \displaystyle \unicode[STIX]{x1D735}\boldsymbol{\cdot }\boldsymbol{u}=0, & \displaystyle\end{eqnarray}$$
 $$\begin{eqnarray}\displaystyle & \displaystyle \frac{\unicode[STIX]{x2202}\unicode[STIX]{x1D703}}{\unicode[STIX]{x2202}t}+\boldsymbol{u}\boldsymbol{\cdot }\unicode[STIX]{x1D735}\unicode[STIX]{x1D703}=\frac{1}{\sqrt{RaPr}}\unicode[STIX]{x1D6FB}^{2}\unicode[STIX]{x1D703}, & \displaystyle\end{eqnarray}$$
 where  $\hat{z}$ is the unit vector pointing in the opposite direction of gravity,
  $\boldsymbol{u}$ the velocity vector normalized by the free-fall velocity
  $\sqrt{g\unicode[STIX]{x1D6FC}\unicode[STIX]{x1D6E5}H}$,
  $t$ the dimensionless time normalized by
  $\sqrt{H/(g\unicode[STIX]{x1D6FC}\unicode[STIX]{x1D6E5})}$,
  $\unicode[STIX]{x1D703}$ the temperature normalized by
  $\unicode[STIX]{x1D6E5}$, and
  $p$ the pressure normalized by
  $g\unicode[STIX]{x1D6FC}\unicode[STIX]{x1D6E5}/H$. The control parameters of the system are
  $Ra=\unicode[STIX]{x1D6FC}g\unicode[STIX]{x1D6E5}H^{3}/(\unicode[STIX]{x1D708}\unicode[STIX]{x1D705})$ and
  $Pr=\unicode[STIX]{x1D708}/\unicode[STIX]{x1D705}$, where
  $\unicode[STIX]{x1D6FC}$ is the thermal expansion coefficient,
  $g$ the gravitational acceleration,
  $\unicode[STIX]{x1D6E5}$ the temperature drop across the container,
  $H$ the height of the fluid domain,
  $\unicode[STIX]{x1D708}$ the kinematic viscosity, and
  $\unicode[STIX]{x1D705}$ the thermal diffusivity of the fluid.
The boundary conditions on the top and bottom plates are no-slip for the velocity and constant for the temperature. Periodic conditions in the horizontal directions are used. In all our simulations,  $Pr$ is fixed to 1 and we analyse data for
  $\unicode[STIX]{x1D6E4}=L/H=32$, where
  $H$ is the vertical distance between the plates and
  $L$ the horizontal extension of the domain. Length scales are normalized by
  $H$ unless specified otherwise and we set
  $H=1$. Coordinates in the wall-parallel direction are denoted by
  $x$ and
  $y$ while the
  $z$-axis points along the wall-normal direction. Horizontal velocity components are denoted
  $v_{x}$ and
  $v_{y}$, respectively. A high spatial resolution in the boundary layer and bulk has been used to ensure that the resolution criteria set by Shishkina et al. (Reference Shishkina, Stevens, Grossmann and Lohse2010) and Stevens et al. (Reference Stevens, Verzicco and Lohse2010) are fulfilled. Details about the simulations can be found in table 1. The simulations for
  $Ra=10^{8}$ and
  $Ra=10^{9}$ have been reported before in Stevens et al. (Reference Stevens, Blass, Zhu, Verzicco and Lohse2018), while the simulations for
  $10^{5}\leqslant Ra\leqslant 10^{7}$ have been performed for this study. The horizontal, vertical and total Reynolds numbers indicated in table 1 represent the volume and time averages of
  $Re_{h}=(\langle v_{x}^{2}+v_{y}^{2}\rangle _{V})^{1/2}(Ra/Pr)^{1/2}$,
  $Re_{w}=(\langle w^{2}\rangle _{V})^{1/2}(Ra/Pr)^{1/2}$ and
  $Re_{t}=(\langle v_{x}^{2}+v_{y}^{2}+w^{2}\rangle _{V})^{1/2}(Ra/Pr)^{1/2}$, respectively. In the following, we decompose instantaneous quantities
  $\tilde{\unicode[STIX]{x1D713}}$ into mean and fluctuating parts according to
  $\tilde{\unicode[STIX]{x1D713}}=\unicode[STIX]{x1D6F9}+\unicode[STIX]{x1D713}$, where
  $\unicode[STIX]{x1D6F9}=\langle \tilde{\unicode[STIX]{x1D713}}\rangle$ with
  $\langle \cdot \rangle$ denoting an average over a wall-parallel plane and time.
Table 1. The columns from left to right indicate the Rayleigh number, the numerical resolution in the horizontal and wall-normal directions ( $N_{x}\times N_{y}\times N_{z}$), the Nusselt number, and the horizontal (
 $Re_{h}=\sqrt{\langle v_{x}^{2}+v_{y}^{2}\rangle _{V}}\sqrt{Ra/Pr}$), vertical (
 $Re_{w}=\sqrt{\langle w^{2}\rangle _{V}}\sqrt{Ra/Pr}$) and total (
 $Re_{t}=\sqrt{\langle v_{x}^{2}+v_{y}^{2}+w^{2}\rangle _{V}}\sqrt{Ra/Pr}$) Reynolds numbers. The length scale
  $\hat{l}$ denotes the superstructure scale based on the coherence spectrum
  $\unicode[STIX]{x1D6FE}_{\unicode[STIX]{x1D703}w}^{2}$ (plotted as triangles in figure 8b) and
  $\unicode[STIX]{x1D6FF}_{\unicode[STIX]{x1D703}}$ is the thermal boundary layer thickness.

3 Results
In presenting our results, we initially (§§ 3.1–3.3) restrict the discussion to a single Rayleigh number ( $Ra=10^{8}$). A detailed discussion of the
  $Ra$ dependence of our findings is then provided in § 3.4.
3.1 Spectral distribution of energy and coherence of temperature and vertical velocity
To evaluate the energy distribution across different scales, we first consider the one-sided power spectra  $\unicode[STIX]{x1D6F7}_{\unicode[STIX]{x1D713}\unicode[STIX]{x1D713}}(k)$, where
  $\unicode[STIX]{x1D713}$ is a zero-mean quantity (velocity or temperature here) and
  $k$ is the radial wavenumber
  $k=\sqrt{k_{x}^{2}+k_{y}^{2}}$. The spectra are computed for horizontal planes and averaged in time. Results for
  $\unicode[STIX]{x1D703}$ and
  $w$ at several distances from the wall are presented in figure 2(a) and (b), respectively. Data are presented in premultiplied form
  $k\unicode[STIX]{x1D6F7}_{\unicode[STIX]{x1D713}\unicode[STIX]{x1D713}}$, such that the area under the curve equals the variance when plotted on a logarithmic scale, according to
 $$\begin{eqnarray}\displaystyle \langle \unicode[STIX]{x1D713}^{2}\rangle =\int _{0}^{\infty }\unicode[STIX]{x1D6F7}_{\unicode[STIX]{x1D713}\unicode[STIX]{x1D713}}\,\text{d}k=\int _{0}^{\infty }k\unicode[STIX]{x1D6F7}_{\unicode[STIX]{x1D713}\unicode[STIX]{x1D713}}\,\text{d}(\log k). & & \displaystyle\end{eqnarray}$$
For reference, the wall-normal temperature and vertical-velocity variance profiles are presented in figures 3(a) and 3(b), respectively. The symbols in these figures mark the positions at which the spectra in figure 2 are computed.

Figure 2. Premultiplied temperature (a) and vertical-velocity (b) power spectra. The premultiplied co-spectrum  $k\unicode[STIX]{x1D6F7}_{\unicode[STIX]{x1D703}w}$ (c) is normalized such that it integrates to the turbulent heat flux. (d) Linear coherence spectrum
  $\unicode[STIX]{x1D6FE}_{\unicode[STIX]{x1D703}w}^{2}$; see (3.2). The dashed and dotted vertical lines indicate
  $k=1$ and
  $k=34$, respectively. The grey shaded area marks the approximate range of superstructure scales
  $k=1\pm 0.4$. The results presented here are computed for
  $Ra=10^{8}$. The colour of the curves indicates the wall distance according to the legend at the foot of the figure.

Figure 3. Wall-normal temperature (a) and vertical-velocity (b) variance profiles for  $Ra=10^{8}$. (c) The corresponding normalized turbulent heat flux. Symbols denote the location of the spectra plotted in figure 2 with corresponding colours.
First, we focus on the situation at mid-height ( $z/H=0.5$), which corresponds to the location of the snapshots shown in figure 1. These results are represented by the red lines in figure 2. Figure 2(a) shows that the temperature spectrum
  $k\unicode[STIX]{x1D6F7}_{\unicode[STIX]{x1D703}\unicode[STIX]{x1D703}}(z/H=0.5)$ has a pronounced peak in the range
  $k\approx 1\pm 0.4$ that corresponds to the superstructures (marked by a grey band as a visual aid in the figure). This peak contains approximately half of the temperature variance at
  $z/H=0.5$, while the remainder of the variance is spread out over a wide range of intermediate and small scales, which individually carry relatively little energy. Figure 2(b) reveals that the corresponding vertical-velocity spectrum
  $k\unicode[STIX]{x1D6F7}_{ww}(z/H=0.5)$ spans approximately the same range of scales as its temperature counterpart overall. However, its shape is significantly different, as it is much more broadband and has a fairly wide peak centred around
  $k\approx 3.5$. It is important to note, though, that there is significant energy in the
  $k\unicode[STIX]{x1D6F7}_{ww}$ spectrum at the scales corresponding to the thermal superstructures, which are marked by grey shading in all panels of figure 2. This implies that velocity structures of the same size as the temperature superstructures indeed exist. Yet, their contribution is overshadowed by stronger velocity fluctuations at smaller scales.
More insight into the correlation between the velocity and temperature structures is obtained by analysing the one-sided co-spectrum  $\unicode[STIX]{x1D6F7}_{\unicode[STIX]{x1D703}w}=\text{Re}(\langle {\mathcal{F}}(\unicode[STIX]{x1D703}){\mathcal{F}}(w)^{\ast }\rangle )$, where
  ${\mathcal{F}}(\cdot )$ indicates the Fourier transform in the horizontal plane and
  $(\cdot )^{\ast }$ the complex conjugate. Figure 2(c) shows that the temperature–velocity co-spectrum
  $k\unicode[STIX]{x1D6F7}_{\unicode[STIX]{x1D703}w}$ at mid-height features a pronounced large-scale peak at
  $k\approx 1$. This indicates that a correlation exists between the large-scale structures in
  $\unicode[STIX]{x1D703}$ and
  $w$. Further,
  $k\unicode[STIX]{x1D6F7}_{\unicode[STIX]{x1D703}w}(z/H=0.5)$ decreases with increasing
  $k$, but scales smaller than the superstructure size nevertheless contribute significantly to the turbulent heat transport. Aside from the degree of correlation between
  $\unicode[STIX]{x1D703}$ and
  $w$, their magnitudes also factor into the co-spectrum at a given scale. In order to focus on the correlation aspect only, we analyse the linear coherence spectrum
 $$\begin{eqnarray}\displaystyle \unicode[STIX]{x1D6FE}_{\unicode[STIX]{x1D703}w}^{2}(k)=\frac{|\unicode[STIX]{x1D6F7}_{\unicode[STIX]{x1D703}w}(k)|^{2}}{\unicode[STIX]{x1D6F7}_{\unicode[STIX]{x1D703}\unicode[STIX]{x1D703}}(k)\unicode[STIX]{x1D6F7}_{ww}(k)}. & & \displaystyle\end{eqnarray}$$
 By definition,  $0\leqslant \unicode[STIX]{x1D6FE}_{\unicode[STIX]{x1D703}w}^{2}\leqslant 1$ and the coherence may be interpreted as the square of a scale-dependent correlation coefficient. From figure 2(d) it is evident that
  $\unicode[STIX]{x1D6FE}_{\unicode[STIX]{x1D703}w}^{2}\geqslant 0.8$ for almost the entire large-scale peak, with a maximum value of
  $\unicode[STIX]{x1D6FE}_{\unicode[STIX]{x1D703}w}^{2}=0.95$ at
  $k=1$ (marked by a dashed line in all panels of figure 2). The coherence quickly drops below
  $\unicode[STIX]{x1D6FE}_{\unicode[STIX]{x1D703}w}^{2}=0.5$ for larger
  $k$. This explains why the overall correlation coefficient between
  $\unicode[STIX]{x1D703}$ and
  $w$, which is essentially an average over the coherence spectrum, is smaller than 0.5 as reported in Stevens et al. (Reference Stevens, Blass, Zhu, Verzicco and Lohse2018).
In order to demonstrate also visually how well the large scales of  $w$ and
  $\unicode[STIX]{x1D703}$ are correlated, we present the snapshots from figure 1 again in figure 4, but this time with the small-scale contributions removed. More specifically, we obtain the large-scale fields
  $\unicode[STIX]{x1D703}_{L}$ and
  $w_{L}$ using a spectral low-pass filter where the cut-off wavenumber
  $k_{cut}=2.5$ is chosen based on the scale at which
  $\unicode[STIX]{x1D6FE}_{\unicode[STIX]{x1D703}w}^{2}(z/H=0.5)$ drops below 0.5. Figure 4 convincingly shows that there is indeed a very good correspondence between patterns at the superstructure scale in temperature and vertical-velocity fields, not only in size but also in location.

Figure 4. Same snapshots of temperature (a) and vertical velocity (b) at mid-height as presented in figure 1, but this time filtered with a spectral low-pass filter with cut-off wavenumber  $k_{cut}=2.5$.
To summarize, we have shown that patterns corresponding to the thermal superstructures also exist in the vertical velocity. For the vertical velocity, though, the contribution of the superstructures in the  $k\unicode[STIX]{x1D6F7}_{ww}$ spectrum is subdominant in the sense that it does not result in a spectral peak. This has previously led to the notion that the superstructures in the velocity field are smaller than in the temperature field, whereas it is really the size of the most energetic structures, as measured by the spectral peak, that is different. We will revisit the reasons for the different spectral distributions of
  $\unicode[STIX]{x1D703}$ and
  $w$ in § 3.2, but we first discuss the height dependence of the trends discussed so far.
Apart from the results at mid-height, figure 2 also contains data at seven different wall-normal locations that span the full domain down to the thermal boundary layer thickness  $\unicode[STIX]{x1D6FF}_{\unicode[STIX]{x1D703}}=1/(2Nu)$. Remarkably, curves at all
  $z$-positions collapse around the peak at
  $k=1$ for the temperature spectra in figure 2(a). This suggests that there is very little evolution of the large-scale thermal structures along the vertical direction. Similarly, also the coherence between
  $\unicode[STIX]{x1D703}$ and
  $w$ (figure 2d) is almost independent of
  $z$ at the largest scales. In contrast, there is a pronounced increase in
  $k\unicode[STIX]{x1D6F7}_{ww}$ around
  $k\approx 1$ with increasing distance away from the wall – a natural consequence of the impermeability condition at the wall. It is this increase in
  $k\unicode[STIX]{x1D6F7}_{ww}$ that also drives a growth of the large-scale peak of the co-spectrum as
  $z$ increases, as shown in figure 2(c).
What is striking about the  $k\unicode[STIX]{x1D6F7}_{\unicode[STIX]{x1D703}\unicode[STIX]{x1D703}}$ spectra (figure 2a) is that at heights of the order of
  $\unicode[STIX]{x1D6FF}_{\unicode[STIX]{x1D703}}$ there exists a second strong peak in addition to the one caused by the superstructures. This small-scale peak is located at
  $k\approx 34$ (indicated by the dotted lines in figure 2), which corresponds to a typical small-scale structure size of approximately
  $11\unicode[STIX]{x1D6FF}_{\unicode[STIX]{x1D703}}$. Upon comparison with figure 3(a), it becomes clear that this peak carries the energy that leads to the maximum of
  $\langle \unicode[STIX]{x1D703}^{2}\rangle$ at
  $z=\unicode[STIX]{x1D6FF}_{\unicode[STIX]{x1D703}}$. A similar small-scale peak is also observed for
  $k\unicode[STIX]{x1D6F7}_{ww}$ in figure 2(b), even though it is located at slightly larger
  $k$ in this case. For
  $k\unicode[STIX]{x1D6F7}_{ww}$, this peak broadens towards intermediate scales with increasing
  $z$ and the increase of
  $\langle w^{2}\rangle$ with increasing
  $z$ (see figure 3b) is mostly associated with increasing energy content at intermediate scales
  $k\approx 10$. It is further interesting to note that the spectral decomposition of
  $k\unicode[STIX]{x1D6F7}_{\unicode[STIX]{x1D703}w}$ shifts from small-scale-dominated (
 $z\lessapprox 3\unicode[STIX]{x1D6FF}_{\unicode[STIX]{x1D703}}$) over broadband (
 $0.1H\lessapprox z\lessapprox 0.2H$) to a maximum at large scales for
  $z\gtrapprox 0.2H$. At the same time, the overall heat transport
  $\langle \unicode[STIX]{x1D703}w\rangle$ stays approximately constant beyond
  $z\approx 2\unicode[STIX]{x1D6FF}_{\unicode[STIX]{x1D703}}$ (see figure 3c). In connection, these observations appear consistent with the concept of merging plumes. This was advocated by, for example, Parodi et al. (Reference Parodi, von Hardenberg, Passoni, Provenzale and Spiegel2004), who found that the structure size increases going away from the wall while the flux remains constant.
3.2 Production of temperature and vertical-velocity fluctuations
In order to uncover the origin of the different spectral distributions of temperature and vertical velocity that became apparent in figure 2(a,b), we now study the variance production terms of the respective variance budgets. These production terms are (Deardorff & Willis Reference Deardorff and Willis1967; Kerr Reference Kerr2001; Togni, Cimarelli & De Angelis Reference Togni, Cimarelli and De Angelis2015)
 $$\begin{eqnarray}\displaystyle S_{\unicode[STIX]{x1D703}}=-2\langle \unicode[STIX]{x1D703}w\rangle \frac{\text{d}\unicode[STIX]{x1D6E9}}{\text{d}z} & & \displaystyle\end{eqnarray}$$
 for  $\langle \unicode[STIX]{x1D703}^{2}\rangle$ and
 $$\begin{eqnarray}\displaystyle S_{w}=\langle \unicode[STIX]{x1D703}w\rangle & & \displaystyle\end{eqnarray}$$
 for  $\langle w^{2}\rangle$. A trivial but nevertheless important implication that arises from comparing (3.3) and (3.4) is that
  $\langle \unicode[STIX]{x1D703}w\rangle$ generates
  $w$ variance directly, while temperature variance is only produced in the presence of a mean gradient
  $\text{d}\unicode[STIX]{x1D6E9}/\text{d}z$. Consequently,
  $S_{\unicode[STIX]{x1D703}}>0$ is restricted to the thermal boundary layer (
 $z\lessapprox \unicode[STIX]{x1D6FF}_{\unicode[STIX]{x1D703}}$) since a significant mean temperature gradient exists only there. This close to the wall
  $\langle \unicode[STIX]{x1D703}w\rangle$ is predominantly a small-scale quantity as evidenced by
  $k\unicode[STIX]{x1D6F7}_{\unicode[STIX]{x1D703}w}(z=\unicode[STIX]{x1D6FF}_{\unicode[STIX]{x1D703}})$ in figure 2(c), such that
  $S_{\unicode[STIX]{x1D703}}$ is localized not only in space but also in scale. On the contrary,
  $\langle \unicode[STIX]{x1D703}w\rangle$ is almost independent of
  $z$ outside of the thermal boundary layer; see figure 3(c). Hence, also
  $S_{w}$ is widely distributed across the bulk of the flow. To better understand the spectral distribution of
  $S_{w}$, we present the data from figure 2(c) in cumulative form in figure 5. This figure reveals that, even at
  $z/H=0.5$, the large-scale peak of
  $\unicode[STIX]{x1D6F7}_{\unicode[STIX]{x1D703}w}$ only contributes approximately 30 % of the total flux
  $\langle \unicode[STIX]{x1D703}w\rangle$. In the central region of the flow, the bulk of the
  $\langle w^{2}\rangle$ production occurs at intermediate scales (say
  $2\lessapprox k\lessapprox 10$). This coincides with the scales at which
  $k\unicode[STIX]{x1D6F7}_{ww}$ peaks at these wall distances; see figure 2(b). This further explains why the superstructure contribution is not reflected as a spectral peak in the
  $k\unicode[STIX]{x1D6F7}_{ww}$ spectrum.

Figure 5. Cumulative co-spectrum  $\int _{0}^{k}\unicode[STIX]{x1D6F7}_{\unicode[STIX]{x1D703}w}\,\text{d}k^{\prime }$ for
  $Ra=10^{8}$. The corresponding co-spectra
  $k\unicode[STIX]{x1D6F7}_{\unicode[STIX]{x1D703}w}$ are shown in figure 2(c). The normalization is chosen such that the spectra add up to the relative contribution of turbulent transport to
  $Nu$ at each wall height.
While the analysis of the production terms provides essential insight into the reasons for the different spectral decompositions of  $\langle \unicode[STIX]{x1D703}^{2}\rangle$ and
  $\langle w^{2}\rangle$, other aspects cannot be addressed on this basis alone. Specifically, understanding the apparently very efficient organization of small-scale temperature fluctuations into thermal superstructures requires the analysis of inter-scale energy transfer. Such an undertaking is beyond the scope of the present work. We note, however, that an inverse (i.e. from smaller to larger scales) energy transfer is indeed observed in certain regions of the flow for both velocity and temperature when horizontally averaged budgets are considered (see e.g. Togni et al. Reference Togni, Cimarelli and De Angelis2015; Green et al. Reference Green, Vlaykov, Mellado and Wilczek2020).
3.3 Wall-normal coherence of superstructures
So far, we have only considered the correlation between vertical velocity and temperature at a given wall-normal location. Another important aspect is the wall-normal coherence of superstructures. There exists qualitative evidence from comparing snapshots at different heights (Stevens et al. Reference Stevens, Blass, Zhu, Verzicco and Lohse2018) all the way down to the skin friction field (Pandey et al. Reference Pandey, Scheel and Schumacher2018) that an imprint of the large-scale structures is visible in the boundary layers. To corroborate these findings in a more systematic and quantitative manner, we again turn to the linear coherence spectrum. However, this time we do not evaluate coherence between different fields, but now we evaluate the same fields at different heights  $z$ and
  $z_{R}$ according to
 $$\begin{eqnarray}\displaystyle \unicode[STIX]{x1D6FE}_{\unicode[STIX]{x1D713}\unicode[STIX]{x1D713}}^{2}(z_{R};z,k)=\frac{|\langle {\mathcal{F}}(\unicode[STIX]{x1D713}(z_{R})){\mathcal{F}}(\unicode[STIX]{x1D713}(z))^{\ast }\rangle |^{2}}{\unicode[STIX]{x1D6F7}_{\unicode[STIX]{x1D713}\unicode[STIX]{x1D713}}(z_{R},k)\unicode[STIX]{x1D6F7}_{\unicode[STIX]{x1D713}\unicode[STIX]{x1D713}}(z;k)}. & & \displaystyle\end{eqnarray}$$
 We fix the reference height at  $z_{R}=\unicode[STIX]{x1D6FF}_{\unicode[STIX]{x1D703}}$. Consequently,
  $\unicode[STIX]{x1D6FE}_{\unicode[STIX]{x1D713}\unicode[STIX]{x1D713}}^{2}(z_{R}=\unicode[STIX]{x1D6FF}_{\unicode[STIX]{x1D703}};z,k)$ is a measure of how correlated structures in field
  $\unicode[STIX]{x1D713}$ at scale
  $k$ and height
  $z$ are with fluctuations of the same scale at boundary layer height of the same field.
Results are presented for temperature and vertical velocity in figures 6(a) and 6(b), respectively. By definition, the result at  $z=\unicode[STIX]{x1D6FF}_{\unicode[STIX]{x1D703}}$ is the correlation with the reference itself and therefore
  $\unicode[STIX]{x1D6FE}_{\unicode[STIX]{x1D713}\unicode[STIX]{x1D713}}^{2}(z_{R}=\unicode[STIX]{x1D6FF}_{\unicode[STIX]{x1D703}};\unicode[STIX]{x1D6FF}_{\unicode[STIX]{x1D703}},k)=1$ trivially. In the superstructure peak (
 $k=1\pm 0.4$, marked by grey shading in figure 6)
  $\unicode[STIX]{x1D6FE}_{\unicode[STIX]{x1D713}\unicode[STIX]{x1D713}}^{2}(z_{R}=\unicode[STIX]{x1D6FF}_{\unicode[STIX]{x1D703}};z,k)$ is close to one, even at mid-height. This holds for both temperature and vertical velocity and implies a very strong degree of spatial coherence for the largest structures in both fields. Differences between
  $\unicode[STIX]{x1D703}$ and
  $w$ only occur at smaller scales. Beyond
  $z=2\unicode[STIX]{x1D6FF}_{\unicode[STIX]{x1D703}}$ the spatial coherence of
  $\unicode[STIX]{x1D703}$ decreases very quickly as a function of
  $k$, but has a limited
  $z$ dependence. In contrast, curves for
  $\unicode[STIX]{x1D6FE}_{ww}^{2}$ in figure 6(b) show significant variation with
  $z$, with the decline occurring at progressively smaller
  $k$ with increasing
  $z$. Apart from quantifying the correlation,
  $\unicode[STIX]{x1D6FE}_{\unicode[STIX]{x1D713}\unicode[STIX]{x1D713}}^{2}(z_{R}=\unicode[STIX]{x1D6FF}_{\unicode[STIX]{x1D703}})$ also provides information about the self-similarity of structures that are connected or ‘attached’ to the thermal boundary layer. This is of interest, since previous authors (e.g. Ahlers, Bodenschatz & He Reference Ahlers, Bodenschatz and He2014; He et al. Reference He, van Gils, Bodenschatz and Ahlers2014) have referred to the attached-eddy framework (Townsend Reference Townsend1976; Perry & Chong Reference Perry and Chong1982; Marusic & Monty Reference Marusic and Monty2019), which assumes the existence of self-similar wall-attached structures, in the interpretation of their results. For the coherence spectrum, self-similarity implies that curves of
  $\unicode[STIX]{x1D6FE}_{\unicode[STIX]{x1D713}\unicode[STIX]{x1D713}}^{2}(z_{R}=\unicode[STIX]{x1D6FF}_{\unicode[STIX]{x1D703}})$ should collapse if plotted against
  $zk$, that is, if the scale is normalized by the distance from the wall (see Baars, Hutchins & Marusic Reference Baars, Hutchins and Marusic2017; Krug et al. Reference Krug, Baars, Hutchins and Marusic2019). We test this for temperature and vertical velocity in figure 6(c,d). Clearly, self-similarity is not observed for the temperature (figure 6c). However, figure 6(d) shows that the data for
  $w$ indeed collapse to a reasonable degree for
  $3\unicode[STIX]{x1D6FF}_{\unicode[STIX]{x1D703}}\lessapprox z\lessapprox 0.3H$.

Figure 6. Spatial coherence spectra of temperature (a) and vertical velocity (b) with the reference plane at  $z_{R}=\unicode[STIX]{x1D6FF}_{\unicode[STIX]{x1D703}}$. The data from panels (a) and (b) are plotted again in (c) and (d), respectively, as a function of
  $zk$ instead of
  $k$. All results shown are for
  $Ra=10^{8}$.
To check if self-similarity scaling in this range is a property of the velocity field in general, we additionally present results for  $\unicode[STIX]{x1D6FE}_{vv}^{2}(z_{R}=\unicode[STIX]{x1D6FF}_{\unicode[STIX]{x1D703}})$, where
  $v$ is the horizontal velocity component, in figure 7. The vertical coherence of
  $v$ also exhibits the same superstructure peak as observed for the other quantities, which can be seen in figure 7(a). Only its magnitude decreases with increasing
  $z$ and is close to zero at mid-height. This is consistent with the roll structures not having a horizontal component at
  $z/H\approx 0.5$ and also the spectral energy
  $\unicode[STIX]{x1D6F7}_{vv}(k=1\pm 0.4)$ (not shown) is minimal there. As figure 7(b) shows,
  $\unicode[STIX]{x1D6FE}_{vv}^{2}(z_{R}=\unicode[STIX]{x1D6FF}_{\unicode[STIX]{x1D703}})$ displays the same collapse when plotted versus
  $zk$ and in the same range of
  $z$ as previously observed for
  $w$. This means that for the velocity fields in a significant part of the domain (at least
  $3\unicode[STIX]{x1D6FF}_{\unicode[STIX]{x1D703}}\lessapprox z\lessapprox 0.3H$) structures attached to the boundary layer display self-similar behaviour. The same trends are observed at different
  $Ra$ but are not shown here for brevity.

Figure 7. Spatial coherence spectra of horizontal velocity  $v$ as a function of (a)
  $k$ and (b)
  $zk$. The reference height is
  $z_{R}=\unicode[STIX]{x1D6FF}_{\unicode[STIX]{x1D703}}$ and
  $Ra=10^{8}$.
3.4 Rayleigh-number trends
As a final point, we study the  $Ra$ dependence of the properties discussed in § 3.1. To this end, we present results for
  $\unicode[STIX]{x1D6FE}_{\unicode[STIX]{x1D703}w}^{2}$ evaluated at mid-height for
  $10^{5}\leqslant Ra\leqslant 10^{9}$ in figure 8(a). The magnitude and the shape of the large-scale peak are nearly independent of
  $Ra$. However, the peak location shifts towards smaller
  $k$ with increasing
  $Ra$. The corresponding increase in the large-scale structure is quantified in figure 8(b), where the triangles indicate the structure size (
 $\hat{l}=2\unicode[STIX]{x03C0}/\hat{k}$) corresponding to the peak in the coherence. Here, the peak location
  $\hat{k}$ is obtained from fitting a parabola to three points centred around the peak of
  $\unicode[STIX]{x1D6FE}_{\unicode[STIX]{x1D703}w}^{2}$ and the results are also listed in table 1. Evidently,
  $\hat{l}$ is significantly larger than the wavelength of the structure at the onset of convection, which is ≈2 (e.g. Drazin & Reid Reference Drazin and Reid2004). Additionally, length scales corresponding to the spectral peak in
  $\unicode[STIX]{x1D6F7}_{\unicode[STIX]{x1D703}\unicode[STIX]{x1D703}}$ (circles),
  $\unicode[STIX]{x1D6F7}_{ww}$ (filled squares) and
  $k\unicode[STIX]{x1D6F7}_{ww}$ (open squares) are included in figure 8(b) and the corresponding spectra are shown in figure 8(c,d). The spectral peak from the temperature spectrum corresponds to slightly larger length scales compared to the results based on
  $\unicode[STIX]{x1D6FE}_{\unicode[STIX]{x1D703}w}^{2}$, but the differences are quite small. Owing to its broadband nature, the spectral peaks for the vertical velocity are found at different locations in the regular and premultiplied spectra. The maximum of
  $\unicode[STIX]{x1D6F7}_{ww}$ only agrees with the results based on coherence and temperature at
  $Ra=10^{5}$. For higher
  $Ra$ fluctuations at intermediate length scales dominate the velocity spectrum. Therefore, the use of the velocity spectra leads to significantly lower estimates for
  $\hat{l}$ than the temperature spectra at higher
  $Ra$, as mentioned in § 3.1.

Figure 8. (a) Coherence spectrum at mid-height for  $10^{5}\leqslant Ra\leqslant 10^{9}$; see panel (b) for the colour code. Stars indicate the wavenumber corresponding to
  $10\unicode[STIX]{x1D702}$ at the respective
  $Ra$. (b) Wavelength
  $\hat{l}$ of the spectral peaks of
  $\unicode[STIX]{x1D6FE}_{\unicode[STIX]{x1D703}w}^{2}$ (triangles),
  $\unicode[STIX]{x1D6F7}_{\unicode[STIX]{x1D703}\unicode[STIX]{x1D703}}$ (circles),
  $\unicode[STIX]{x1D6F7}_{ww}$ (filled squares),
  $k\unicode[STIX]{x1D6F7}_{ww}$ (open squares) and
  $k\unicode[STIX]{x1D6F7}_{\unicode[STIX]{x1D703}w}$ (black dots). The corresponding spectra
  $k\unicode[STIX]{x1D6F7}_{\unicode[STIX]{x1D703}\unicode[STIX]{x1D703}}$ and
  $k\unicode[STIX]{x1D6F7}_{ww}$ are shown in panels (c) and (d) with symbols marking the peak locations as described for panel (b). The inset in panel (b) additionally shows the aspect-ratio dependence of
  $\hat{l}$ based on
  $\unicode[STIX]{x1D6FE}_{\unicode[STIX]{x1D703}w}^{2}$ at
  $Ra=10^{8}$; see the Appendix for details.
The dependence of the superstructure size on the aspect ratio  $\unicode[STIX]{x1D6E4}$ of the periodic domain was already discussed in Stevens et al. (Reference Stevens, Blass, Zhu, Verzicco and Lohse2018). From their results, it appears that the superstructure size based on the peak in
  $\unicode[STIX]{x1D6F7}_{\unicode[STIX]{x1D703}\unicode[STIX]{x1D703}}$ increases monotonically (albeit slowly for
  $\unicode[STIX]{x1D6E4}>16$) with increasing
  $\unicode[STIX]{x1D6E4}$. The inset of figure 8(b) shows that
  $\hat{l}$ based on
  $\unicode[STIX]{x1D6FE}_{\unicode[STIX]{x1D703}w}^{2}$ decreases slightly if
  $\unicode[STIX]{x1D6E4}$ is increased from 16 to 64. This difference is not rooted in the fact that a different metric is employed here, but is caused by an error in the computation of the spectra presented in Stevens et al. (Reference Stevens, Blass, Zhu, Verzicco and Lohse2018). We plot the recomputed spectra in the Appendix and these show that the temperature spectral peak indeed exhibits the same trend as the one observed for
  $\unicode[STIX]{x1D6FE}_{\unicode[STIX]{x1D703}w}^{2}$.
The concept of a convection roll, i.e. a thermally driven velocity structure, suggests a definition of the superstructure size in RBC as the scale where the correlation between temperature and velocity fields is maximum. We therefore argue that conceptually the most straightforward way to define the superstructure size is via the coherence spectrum. It should be noted that the coherence peak is not necessarily coincident with the peak of the co-spectrum due to the different distributions of  $\unicode[STIX]{x1D6F7}_{\unicode[STIX]{x1D703}\unicode[STIX]{x1D703}}$ and
  $\unicode[STIX]{x1D6F7}_{ww}$. In practice, however, the peaks of
  $\unicode[STIX]{x1D6FE}_{\unicode[STIX]{x1D703}w}^{2}$ and
  $k\unicode[STIX]{x1D6F7}_{\unicode[STIX]{x1D703}w}$ coincide within measurement accuracy for the cases presented here (see figure 8b). This seems to be a consequence of the sharp drop-off of
  $\unicode[STIX]{x1D6FE}_{\unicode[STIX]{x1D703}w}^{2}$ and
  $\unicode[STIX]{x1D6F7}_{\unicode[STIX]{x1D703}\unicode[STIX]{x1D703}}$ with increasing
  $k$ which outweighs the increase in
  $\unicode[STIX]{x1D6F7}_{ww}$. The situation may change, however, e.g. for different
  $Pr$ numbers. Some caution is therefore advised in this matter. For a case in point, we note that the small-scale peak in
  $k\unicode[STIX]{x1D6F7}_{\unicode[STIX]{x1D703}w}$ at
  $z=\unicode[STIX]{x1D6FF}_{\unicode[STIX]{x1D703}}$ (figure 2c) is without counterpart in
  $\unicode[STIX]{x1D6FE}_{\unicode[STIX]{x1D703}w}^{2}$ (figure 2c). This indicates that the peak in turbulent transport is predominantly driven by magnitude, not coherence. The peaks of the
  $\unicode[STIX]{x1D6F7}_{ww}$ and the
  $k\unicode[STIX]{x1D6F7}_{ww}$ spectra may be misleading as indicators for superstructure size since the velocity spectra are dominated by motions at intermediate length scales.
As an aside, we discuss the increase of  $\unicode[STIX]{x1D6FE}_{\unicode[STIX]{x1D703}w}^{2}$ that is seen to occur at high
  $k$ in figure 8(a). This increase at small scales occurs for lower values of
  $k$ and is stronger for lower
  $Ra$. A comparison with figure 8(c,d) reveals that there is only minimal energy at these small scales. These observations are consistent with the notion that the higher values of
  $\unicode[STIX]{x1D6FE}_{\unicode[STIX]{x1D703}w}^{2}$ mark the transition to a viscous-dominated regime. In the viscous regime, the correlation between
  $\unicode[STIX]{x1D703}$ and
  $w$ is high because the balance is predominantly between buoyancy and viscous forces. This is similar to the situation at the onset of convection, where the correlation between velocity and temperature fluctuations is very high (Bodenschatz, Pesch & Ahlers Reference Bodenschatz, Pesch and Ahlers2000). To lend support to this understanding, we added the length scale
  $10\unicode[STIX]{x1D702}$ as a reference scale for the viscous regime in figure 8. Here,
  $\unicode[STIX]{x1D702}=(\unicode[STIX]{x1D708}^{3}/\langle \unicode[STIX]{x1D700}\rangle _{V})^{1/4}$ is the Kolmogorov length scale and
  $\langle \unicode[STIX]{x1D700}\rangle _{V}$ is the volume-averaged dissipation rate obtained from the identity
  $\langle \unicode[STIX]{x1D700}\rangle _{V}=(Nu-1)/\sqrt{RaPr}$. It is seen in figure 8(a) that the scale at which the high-wavenumber increase of
  $\unicode[STIX]{x1D6FE}_{\unicode[STIX]{x1D703}w}^{2}$ occurs roughly coincides with
  $10\unicode[STIX]{x1D702}$ for
  $Ra>10^{6}$, just as expected from the above. The agreement is less good for the (marginally turbulent) cases at even lower
  $Ra$, where the increase in
  $\unicode[STIX]{x1D6FE}_{\unicode[STIX]{x1D703}w}^{2}$ starts at scales significantly larger than
  $10\unicode[STIX]{x1D702}$.

Figure 9. (a) Premultiplied temperature power spectra  $k\unicode[STIX]{x1D6F7}_{\unicode[STIX]{x1D703}\unicode[STIX]{x1D703}}$ at
  $z=\unicode[STIX]{x1D6FF}_{\unicode[STIX]{x1D703}}$ for
  $10^{5}\leqslant Ra\leqslant 10^{9}$. Symbols mark the location of the small-scale peak determined as the maximum of
  $k\unicode[STIX]{x1D6F7}_{\unicode[STIX]{x1D703}\unicode[STIX]{x1D703}}(k)$ for
  $k>2$. Note that, at the lower
  $Ra$, this peak does not correspond to a global maximum of
  $k\unicode[STIX]{x1D6F7}_{\unicode[STIX]{x1D703}\unicode[STIX]{x1D703}}$. (b) Length scale
  $\hat{l}_{\unicode[STIX]{x1D6FF}}$ associated with the small-scale peak of
  $k\unicode[STIX]{x1D6F7}_{\unicode[STIX]{x1D703}\unicode[STIX]{x1D703}}$ (circles),
  $k\unicode[STIX]{x1D6F7}_{ww}$ (squares) and
  $k\unicode[STIX]{x1D6F7}_{\unicode[STIX]{x1D703}w}$ (triangles) normalized with the thermal boundary layer thickness
  $\unicode[STIX]{x1D6FF}_{\unicode[STIX]{x1D703}}$. The dashed line is at 11.5 for reference.
The  $Ra$ dependence of the near-wall characteristics of the temperature field are displayed in figure 9 in which
  $k\unicode[STIX]{x1D6F7}_{\unicode[STIX]{x1D703}\unicode[STIX]{x1D703}}$ is plotted at
  $z=\unicode[STIX]{x1D6FF}_{\unicode[STIX]{x1D703}}$ for each
  $Ra$. This figure shows that the small-scale peak contributes an increasingly larger part of the total energy with increasing
  $Ra$. At the same time, the scale separation between the small scales and the large-scale superstructures increases with increasing thermal driving. We define the length scale of the small-scale structures as
  $\hat{l}_{\unicode[STIX]{x1D6FF}}=2\unicode[STIX]{x03C0}/\hat{k}_{\unicode[STIX]{x1D6FF}}$, where
  $\hat{k}_{\unicode[STIX]{x1D6FF}}$ is the location of the high-
 $k$ peak. Figure 9(b) shows that
  $\hat{l}_{\unicode[STIX]{x1D6FF}}$ is approximately constant for
  $10^{5}\leqslant Ra\leqslant 10^{9}$, when normalized with the boundary layer thickness
  $\unicode[STIX]{x1D6FF}_{\unicode[STIX]{x1D703}}$. The magnitude of the ratio
  $\hat{l}_{\unicode[STIX]{x1D6FF}}/\unicode[STIX]{x1D6FF}_{\unicode[STIX]{x1D703}}$ differs slightly depending on the quantity considered. The most energetic small-scale structures for the temperature are approximately
  $11.5\unicode[STIX]{x1D6FF}_{\unicode[STIX]{x1D703}}$, for
  $w$ it is approximately
  $8.5\unicode[STIX]{x1D6FF}_{\unicode[STIX]{x1D703}}$, and
  $k\unicode[STIX]{x1D6F7}_{\unicode[STIX]{x1D703}w}$ peaks at approximately
  $10\unicode[STIX]{x1D6FF}_{\unicode[STIX]{x1D703}}$.
4 Conclusion
Contrary to what prior analysis (Pandey et al. Reference Pandey, Scheel and Schumacher2018; Stevens et al. Reference Stevens, Blass, Zhu, Verzicco and Lohse2018) appeared to suggest, we found that superstructures of approximately the same size exist in the temperature and vertical-velocity fields in large-aspect-ratio Rayleigh–Bénard flow. These result in a very significant large-scale peak in the linear coherence spectrum of  $\unicode[STIX]{x1D703}$ and
  $w$ that signifies almost perfect correlation at the large length scales. Unlike the case for
  $\unicode[STIX]{x1D703}$, we find that the superstructures in
  $w$ do not correspond to a spectral peak in the power spectrum of
  $w$. This difference has previously led to the above-mentioned confusion regarding potentially different sizes of the largest structures in
  $\unicode[STIX]{x1D703}$ and
  $w$. The fact that the most energetic motions, as measured by the peak in the spectra, occur at intermediate scales for
  $w$, but at the superstructure scale for
  $\unicode[STIX]{x1D703}$, can be explained by differences in the production terms of the respective variance budgets. In particular, temperature production is confined to the boundary layer and small scales, while buoyancy forcing acts at intermediate scales and throughout the entire bulk of the flow. Furthermore, we find that the superstructure scale increases with
  $Ra$ for
  $10^{5}\leqslant Ra\leqslant 10^{9}$, i.e. the full range investigated here, when the structure size is based on the coherence spectrum as suggested. It should be noted that integral length scales of temperature and turbulent kinetic energy as used in Stevens et al. (Reference Stevens, Blass, Zhu, Verzicco and Lohse2018) do not accurately capture this growth, which shows the importance of selecting the appropriate metric to quantify superstructures in RBC.
In agreement with previous observations of superstructure footprints in the boundary layer region, we find an almost perfect spatial correlation of the superstructure scales from the boundary layer height  $\unicode[STIX]{x1D6FF}_{\unicode[STIX]{x1D703}}$ up to mid-height, for both
  $\unicode[STIX]{x1D703}$ and
  $w$. Also, the temperature spectra, as well as
  $\unicode[STIX]{x1D6FE}_{\unicode[STIX]{x1D703}w}^{2}$, are seen to collapse at different heights. Hence, there is no noticeable dependence of the superstructure scale on
  $z$, effectively ruling out a significant growth of the thermal structures due to horizontal transport while they are travelling upward as was suggested by Pandey et al. (Reference Pandey, Scheel and Schumacher2018). The decrease of spatial correlation (quantified by the linear coherence spectrum) at intermediate scales when increasing the distance to the reference height
  $\unicode[STIX]{x1D6FF}_{\unicode[STIX]{x1D703}}$ is observed to follow a self-similar trend for
  $w$ and the horizontal component
  $v$, but not for
  $\unicode[STIX]{x1D703}$. The reason for this difference remains unclear but warrants further investigation.
Moreover, we find that the energy distribution of the temperature field is bimodal. Besides the  $z$-independent large-scale contribution of the superstructures, premultiplied spectra reveal the existence of a pronounced small-scale peak at boundary layer height. The two peaks are separated by a spectral gap that increases with
  $Ra$, which is also visible in the co-spectra of
  $\unicode[STIX]{x1D703}$ and
  $w$. However,
  $k\unicode[STIX]{x1D6F7}_{ww}$ displays a small-scale peak only near the wall and is broadband otherwise. For the temperature fluctuations, the small-scale peak carries the energy that leads to the maximum of
  $\langle \unicode[STIX]{x1D703}^{2}\rangle$ at
  $z=\unicode[STIX]{x1D6FF}_{\unicode[STIX]{x1D703}}$ (see e.g. Wang, He & Tong (Reference Wang, He and Tong2016)). The length scale of the associated structures is approximately
  $l_{\unicode[STIX]{x1D6FF}}\approx 10\unicode[STIX]{x1D6FF}_{\unicode[STIX]{x1D703}}$. It is interesting to note that the situation described here bears a close resemblance to findings in turbulent boundary layers. There, an ‘inner peak’ is observed that is fixed at 15 viscous units (
 $l_{visc}$) away from the wall and with typical streamwise length scales of approximately
  $1000l_{visc}$ (Hutchins & Marusic Reference Hutchins and Marusic2007b). The scale separation between the ‘inner peak’ and the large-scale structures is, however, significantly stronger in RBC. This appears to suggest distinctly different processes, as was already pointed out in Pandey et al. (Reference Pandey, Scheel and Schumacher2018) in a different context, and raises questions about their interaction. A better understanding of these aspects will be very insightful for modelling approaches.
Acknowledgements
The authors acknowledge stimulating discussions with W. Baars and thank A. Blass for help with the data. This work is supported by the Twente Max-Planck Center, the German Science Foundation (DFG) via program SSP 1881, and the ERC (European Research Council) Starting Grant no. 804283 UltimateRB. The authors gratefully acknowledge the Gauss Centre for Supercomputing e.V. (www.gauss-centre.eu) for funding this project by providing computing time on the GCS Supercomputer SuperMUC-NG at Leibniz Supercomputing Centre (www.lrz.de). Part of the work was carried out on the national e-infrastructure of SURFsara, a subsidiary of SURF cooperation, the collaborative ICT organization for Dutch education and research.
Declaration of interests
The authors report no conflict of interest.
Appendix. Aspect-ratio dependence of the superstructure size
The aspect-ratio dependence of the superstructures has been studied in Stevens et al. (Reference Stevens, Blass, Zhu, Verzicco and Lohse2018) before. However, there was a bug in the radial averaging of the spectra, which led to a faulty spectral distribution, especially at the largest scales. In figure 10, we present results at  $Ra=10^{8}$ for aspect ratios varying between 3 and 64. Up to
  $\unicode[STIX]{x1D6E4}=8$ there is no clear peak, as the highest values are attained for the smallest
  $k$ for all quantities displayed. Distinct large-scale peaks emerge for
  $\unicode[STIX]{x1D6E4}\geqslant 16$ for
  $k\unicode[STIX]{x1D6F7}_{\unicode[STIX]{x1D703}\unicode[STIX]{x1D703}}$ (figure 10a),
  $k\unicode[STIX]{x1D6F7}_{\unicode[STIX]{x1D703}w}$ (figure 10c) and
  $\unicode[STIX]{x1D6FE}_{\unicode[STIX]{x1D703}w}^{2}$ (figure 10d). The locations of these peaks (again obtained by fitting a parabola over three points) are shown in figure 10. Results based on
  $k\unicode[STIX]{x1D6F7}_{\unicode[STIX]{x1D703}\unicode[STIX]{x1D703}}$ and
  $\unicode[STIX]{x1D6FE}_{\unicode[STIX]{x1D703}w}^{2}$ decrease monotonically with increasing
  $\unicode[STIX]{x1D6E4}$, while
  $\hat{l}$ based on the co-spectrum increases between
  $\unicode[STIX]{x1D6E4}=16$ and
  $\unicode[STIX]{x1D6E4}=32$. The peaks in
  $k\unicode[STIX]{x1D6F7}_{ww}$, and remarkably these spectra in general, exhibit only a minor sensitivity to
  $\unicode[STIX]{x1D6E4}$. The peaks of the velocity spectra remain, however, at intermediate scales significantly smaller than the superstructure size.

Figure 10. Premultiplied temperature (a) and vertical-velocity (b) power spectra. The premultiplied co-spectrum  $k\unicode[STIX]{x1D6F7}_{\unicode[STIX]{x1D703}w}$ (c) is normalized such that it integrates to the turbulent heat flux. (d) Linear coherence spectrum
  $\unicode[STIX]{x1D6FE}_{\unicode[STIX]{x1D703}w}^{2}$. Symbols indicate the peak values for the three largest
  $\unicode[STIX]{x1D6E4}$. The inset shows
  $\hat{l}$ based on coherence (coloured triangles) and co-spectra (grey triangles), as well as on temperature (circles) and velocity (squares) power spectra. The dashed vertical line indicates
  $k=1$ and the grey shaded area marks the approximate range of superstructure scales
  $k=1\pm 0.4$ (same as in figure 2). All results presented here are computed for
  $Ra=10^{8}$ at mid-height; the legend in (a) applies to all panels.
The conclusion of Stevens et al. (Reference Stevens, Blass, Zhu, Verzicco and Lohse2018) that very large domains are needed to fully converge the superstructure size remains valid, even though, at least for the values checked here, the trend is opposite (decreasing size) to what was previously believed. The scale  $\hat{l}$ still varies by approximately 10 % between the cases with
  $\unicode[STIX]{x1D6E4}=32$ and
  $\unicode[STIX]{x1D6E4}=64$. The more basic requirement is, however, that
  $\unicode[STIX]{x1D6E4}\gtrapprox 16$ because only then is the large-scale peak actually resolved.


 Open access