Monitoring Biochemical and Structural Changes in Human Periodontal Ligaments during Orthodontic Treatment by Means of Micro-Raman Spectroscopy

 , , , and
Abstract
:1. Introduction
2. Subjects and Methods
2.1. Subjects
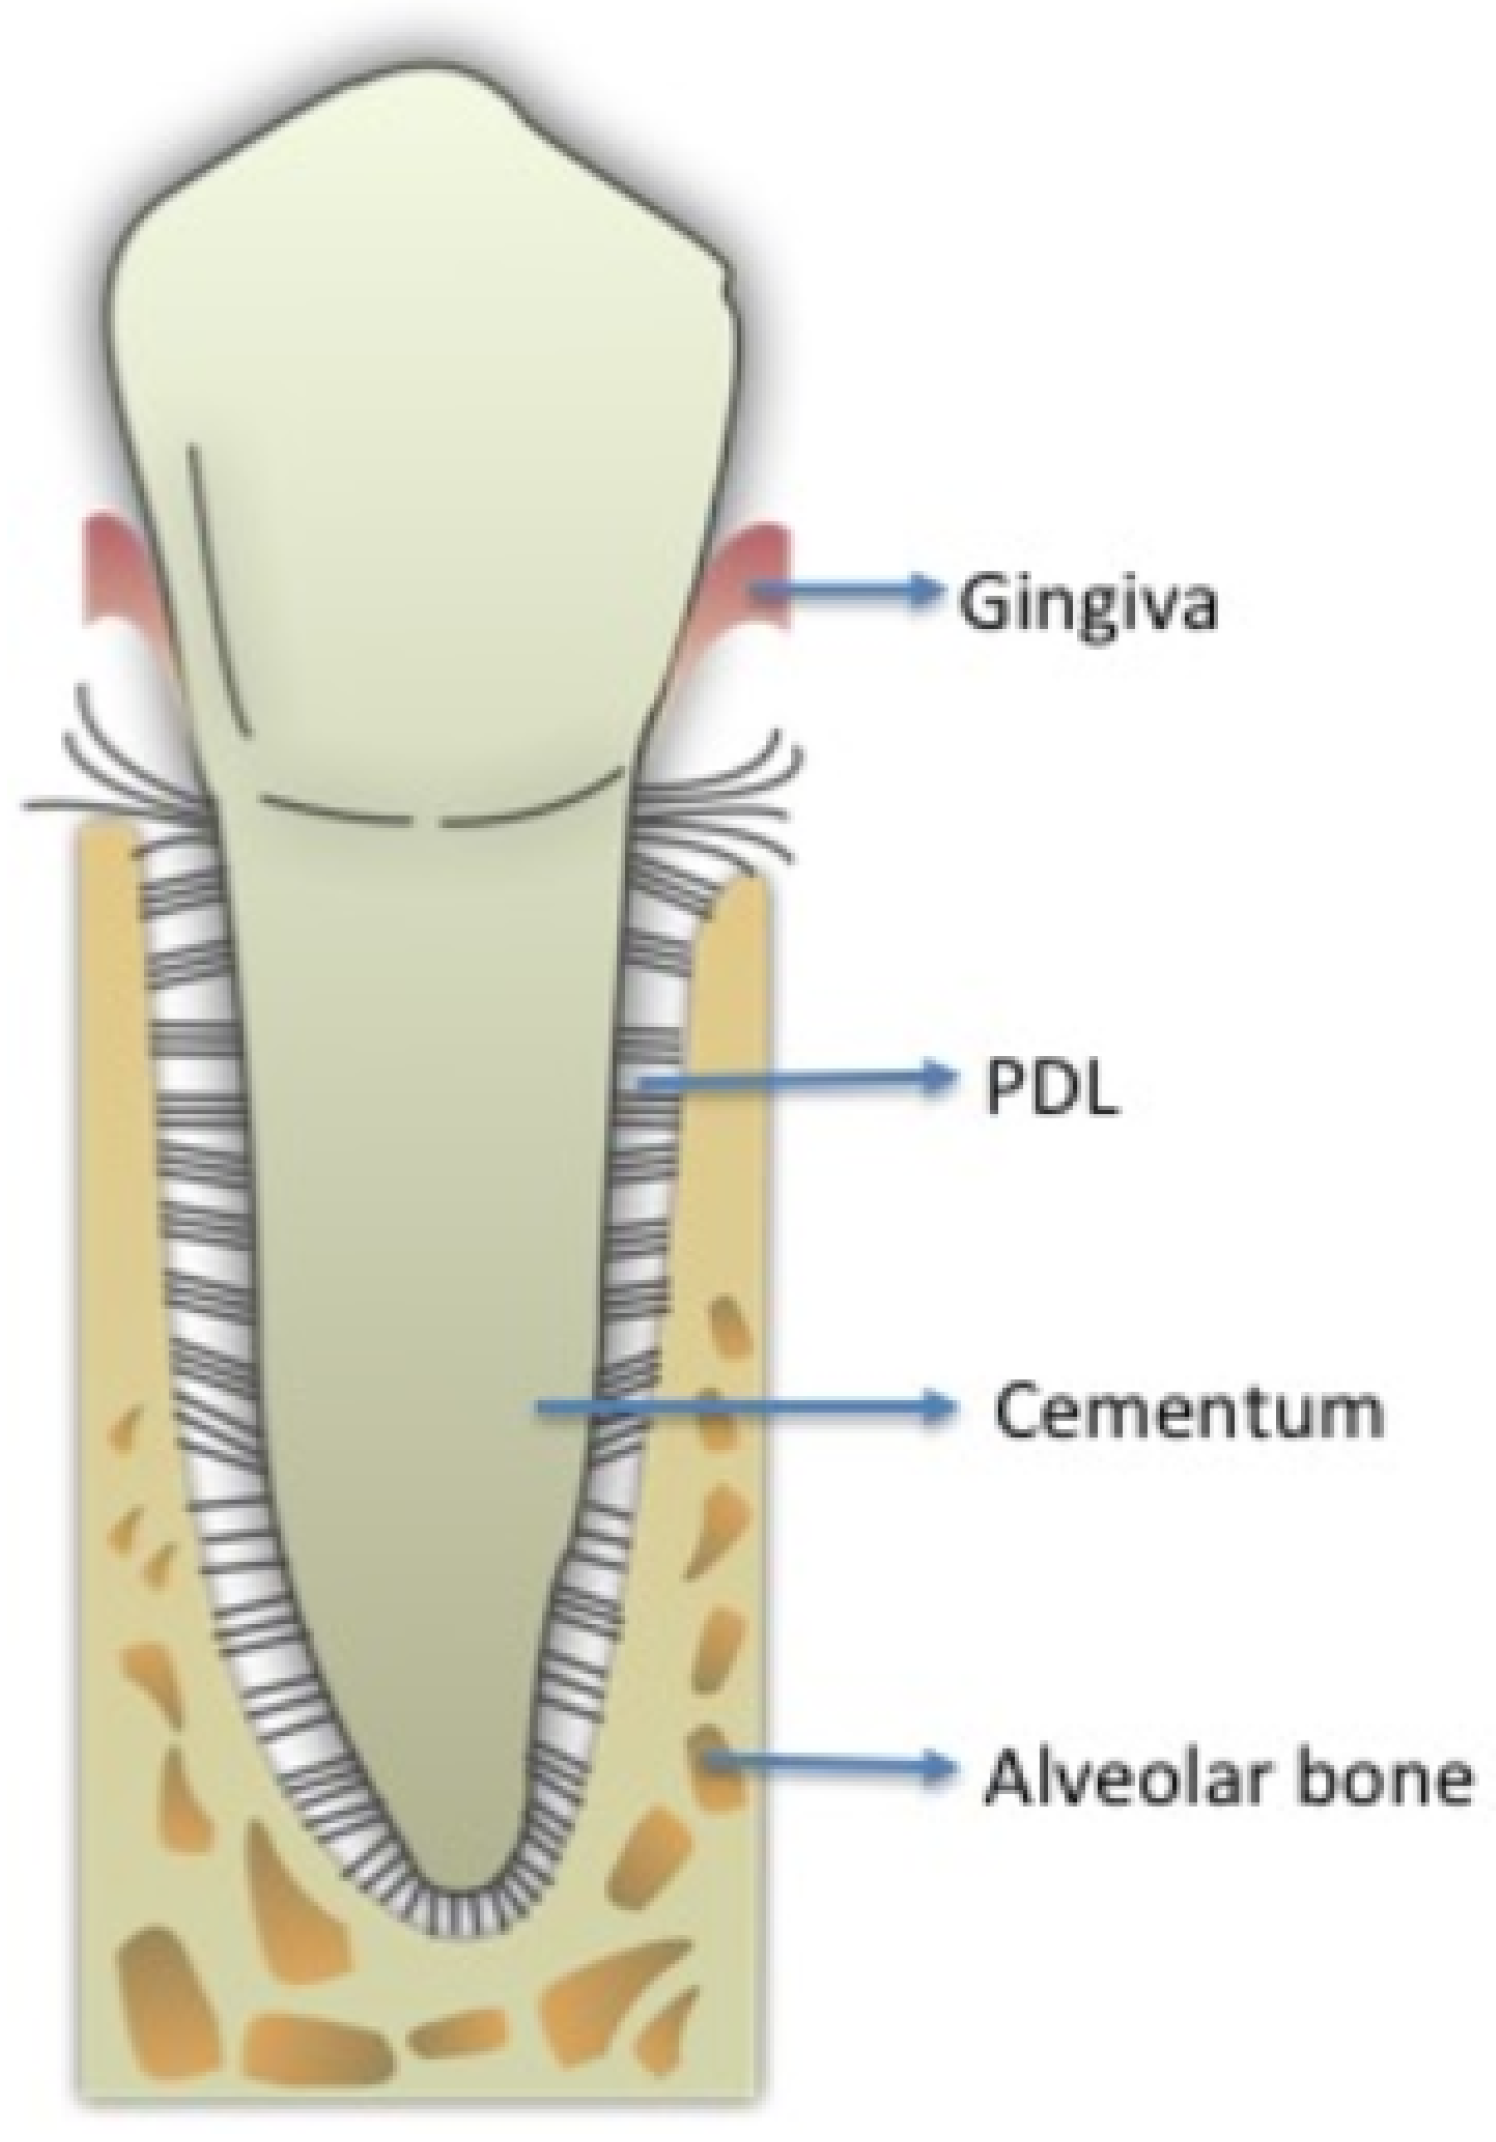
2.2. PDL Collection
2.3. Micro-Raman Spectroscopy
2.3.1. Spectra Acquisition
2.3.2. Data Treatment
2.3.3. Spectral Deconvolution Procedure
2.3.4. Statistical Analysis
3. Results
4. Discussion
5. Conclusions
Author Contributions
Funding
Conflicts of Interest
Abbreviations
| AA | Arachidonic Acid |
| COX | Cyclooxygenase |
| FAK | Focal Adhesion Kinase |
| FMBS | Full-Mouth Bleeding Score |
| FMPS | Full-Mouth Plaque Score |
| IL | Interleukins |
| -RS | micro-Raman Spectroscopy |
| OTM | Orthodontic Tooth Movement |
| PDL | Periodontal Ligament |
| PFH | Paraformaldehyde |
| PG | Prostaglandin |
| PgE2 | Prostaglandin E2 |
| RANKL | Receptor Activator Nuclear Factor-kB Ligand |
| TNF | Tumor Necrosis Factor |
| VEGF | Vascular Endothelial Growth Factor |
References
- Ferguson, D.J.; Wilcko, M.T. Tooth Movement Mechanobiology: Toward a Unifying Concept. In Biology of Orthodontic Tooth Movement; Springer Publishing: Cham, Switzerland, 2016; pp. 13–44. [Google Scholar]
- Ghijselings, E.; Carels, C.; Gastel, J.V. Oral and periodontal microbiology and orthodontic treatment. In Biological Mechanisms of Tooth Movement; Krishnan, V., Davidovitch, Z., Eds.; John Wiley and Sons Press: Chichester, UK, 2005; pp. 111–120. [Google Scholar]
- Kumar, G.S. (Ed.) Orban’s Oral Histology and Embryology; Elsevier, A division of Reed Elsevier India Private Ltd.: New Delhi, India, 2011. [Google Scholar]
- Proffit, W.R.; Fields, H.W., Jr.; Larso, B.; Sarver, D.M. Contemporary Orthodontics, 6th ed.; Elsevier: Philadelphia, PA, USA, 2019. [Google Scholar]
- Meikle, M.C. The tissue, cellular, and molecular regulation of orthodontic tooth movement: 100 years after Carl Sandstedt. Eur. J. Orthod 2006, 28, 221–240. [Google Scholar] [CrossRef]
- Krishnan, V.; Davidovitch, Z. Cellular, molecular, and tissue-level reactions to orthodontic force. Am. J. Orthod. Dentofacial Orthop. 2006, 129, 460–511. [Google Scholar] [CrossRef]
- Anastasi, G.; Cordasco, G.; Matarese, G.; Rizzo, G.; Nucera, R.; Mazza, M.; Militi, A.; Portelli, M.; Cutroneo, G.; Favaloro, A. An immunohistochemical, histological, and electron-microscopic study of human periodontal ligament during orthodontic treatment. Int. J. Mol. Med. 2008, 21, 545–554. [Google Scholar] [CrossRef]
- Camerlingo, C.; d’Apuzzo, F.; Grassia, V.; Perillo, L.; Lepore, M. Micro-Raman spectroscopy for monitoring changes in periodontal ligaments and gingival crevicular fluid. Sensors 2008, 14, 22552–22563. [Google Scholar] [CrossRef] [Green Version]
- Reichebächer, M.; Popp, J. Vibrational spectroscopy. In Challenges in Molecular Structure Determination; Springer-Verlag Publishing: Berlin/Heidelberg, Germany, 2012; pp. 63–143. [Google Scholar]
- Butler, H.J.; Ahton, L.; Bird, B.; Cinque, G.; Curtis, K.; Dorney, J.; Esmonde-White, K.; Fullwood, N.J.; Gardner, B.; Martin-Hirsch, P.L.; et al. Using Raman spectroscopy to characterize biological materials. Nat. Protoc. 2010, 11, 664–687. [Google Scholar] [CrossRef] [Green Version]
- Wang, Y.N.; Galiotis, C.; Bader, D.L. Determination of molecular changes in soft tissues under strain using laser Raman microscopy. J. Biomech. 2000, 33, 483–486. [Google Scholar] [CrossRef]
- Gonchukov, S.; Sukhinina, A.; Bakhmutov, D.; Minaeva, S. Raman spectroscopy of saliva as a perspective method for periodontitis diagnostics. Laser Phys. Lett. 2012, 9, 73–77. [Google Scholar] [CrossRef]
- Amer, M.S. Raman Spectroscopy for Soft Matter Applications; John Wiley and Sons Inc.: Hoboken, NJ, USA, 2009. [Google Scholar]
- Sirichaisit, J.; Young, R.J.; Vollrath, F. Molecular deformation in spider dragline silk subjected to stress. Polymer 2009, 41, 1223–1227. [Google Scholar] [CrossRef]
- D’Apuzzo, F.; Perillo, L.; Delfino, I.; Portaccio, M.; Lepore, M.; Camerlingo, C. Monitoring early phases of orthodontic treatment by means of Raman spectroscopies. J. Biomed. Opt. 2017, 22. [Google Scholar] [CrossRef] [PubMed] [Green Version]
- Camerlingo, C.; Zenone, F.; Gaeta, G.M.; Riccio, R.; Lepore, M. Wavelet data processing of micro-Raman spectra of biological samples. Meas. Sci. Technol. 2006, 17, 298–303. [Google Scholar] [CrossRef]
- Camerlingo, C.; Delfino, I.; Perna, G.; Capozzi, V.; Lepore, M. Micro-Raman spectroscopy and uni variate analysis for monitoring disease follow-up. Sensors 2011, 11, 8309–8322. [Google Scholar] [CrossRef] [PubMed] [Green Version]
- Jung, G.B.; Kim, K.A.; Han, I.; Park, Y.G.; Park, H.K. Biochemical characterization of human gingival crevicular fluid during orthodontic tooth movement using Raman spectroscopy. Biomed. Opt. Express 2014, 5, 3508–3519. [Google Scholar] [CrossRef] [PubMed] [Green Version]
- d’Apuzzo, F.; Perillo, L.; Parente, G.; Camerlingo, C.; Rusciano, M.R.; Maione, A.S.; Lepore, M. Micro-Raman spectroscopy investigation on periodontal ligament: A preliminary study on a tissue model. In Proceedings of the 2014 Fotonica AEIT Italian Conference on Photonics Technologies, Naples, Italy, 12–14 May 2014. [Google Scholar]
- Perinetti, G.; d’Apuzzo, F.; Contardo, L.; Primozic, J.; Perillo, L. Gingival crevicular fluid alkaline phosphate activity during the retention phase of maxillary expansion in prepubertal subjects: A split-mouth longitudinal study. Am. J. Orthod. Dentofacial Orthop. 2015, 148, 90–96. [Google Scholar] [CrossRef] [PubMed]
- Lying, F.; Ghazi, E.; Gardner, P. Preparation of Tissues and Cells for Infrared and Raman Spectroscopy and Imaging in RSC Analytical Spectroscopy. Biomed. Appl. Synchrotron Infrared Microspectrosc. 2011, 11, 143–189. [Google Scholar]
- Hobro, A.J.; Smith, N.I. An evaluation of fixation methods: Spatial and compositional cellular changes observed by Raman imaging. Vib. Spectrosc. 2017, 91, 31–45. [Google Scholar] [CrossRef] [Green Version]
- Wang, H.; Zhao, J.; Lee, A.; Lui, H.; Zeng, H. Improving skin Raman spectral quality by fluorescence photobleaching. Photodiagn. Photodyn. Ther. 2012, 9, 299–302. [Google Scholar] [CrossRef]
- Thomas, G.J., Jr.; Agard, D.A. Quantitative analysis of nucleid acids, proteins, and viruses by Raman band deconvolution. Biophys. J. 1984, 46, 763–768. [Google Scholar] [CrossRef] [Green Version]
- Movasaghi, Z.; Rehman, S.; Rehman, I.U. Raman spectroscopy of biological tissue. Appl. Spectrosc. Rev. 2007, 42, 493–541. [Google Scholar] [CrossRef]
- Williams, R.W. Estimation of protein secondary structure from the laser Raman Amide I spectrum. J. Mol. Biol. 1983, 166, 581–603. [Google Scholar] [CrossRef]
- Goormaghtigh, E.; Cabiaux, V.; Ruysschaert, J.M. Secondary structure and dosage of soluble and membrane proteins by attenuated total reaction Fourier-Transform IInfrared SSpectroscopy of hydrated films. Eur. J. Biochem. 1990, 193, 409–420. [Google Scholar] [CrossRef]
- Mansfield, J.; Moger, J.; Green, E.; Moger, C.; Winlove, C.P. Chemically specific imaging and in-situ chemical analysis of articular cartilage with stimulated Raman scattering. J. Biophotonics 2013, 193, 803–814. [Google Scholar] [CrossRef] [PubMed] [Green Version]
- Gullekson, C.; Lucas, L.; Hewitt, K.; Kreplak, L. Surface-sensitive Raman spectroscopy of collagen I fibrils. Biophys. J. 2013, 100, 1837–1845. [Google Scholar] [CrossRef] [PubMed] [Green Version]
- Kuhar, N.; Sil, S.; Verma, T.; Umapathy, S. Challenges in application of Raman spectroscopy to biology and materials. RSC Adv. 2018, 8, 25888–25908. [Google Scholar] [CrossRef] [Green Version]
- Williams, B.W. Protein secondary structure analysis using Raman Amide I and Amide III spectra. Meth. Enzymol. 1986, 130, 311–331. [Google Scholar] [PubMed]
- Cai, S.; Singh, B.R. Identification of β-turn and random coil amide III infrared bands for secondary structure estimation of proteins. Biophys. Chem. 1999, 80, 7–20. [Google Scholar] [CrossRef]
- Hynes, A.; Scott, D.A.; Man, A.; Singer, D.L.; Sowa, M.G.; Liu, K. Molecular mapping of periodontal tissues using infrared microspectroscopy. BMC Med. Imaging 2005, 5. [Google Scholar] [CrossRef] [PubMed] [Green Version]
- Delfino, I.; Perna, G.; Lasalvia, M.; Capozzi, V.; Manti, L.; Camerlingo, C.; Lepore, M. Visible micro-Raman spectroscopy of single human mammary epithelial cells exposed to x-ray radiation. J. Biomed. Opt. 2015, 3. [Google Scholar] [CrossRef] [Green Version]
- Ackbarow, T.; Chen, X.; Keten, S.; Buehler, M.J. Hierarchies, multiple energy barriers, and robustness govern the fracture mechanics of α-helical and β-sheet protein domains. Proc. Natl. Acad. Sci. USA 2007, 104, 16410–16415. [Google Scholar] [CrossRef] [Green Version]
- Ackbarow, T.; Sen, D.; Thaulow, C.; Buehler, M.J. Alpha-helical protein networks are self protective and flaw-tolerant. PLoS ONE 2009, 4, e6015. [Google Scholar] [CrossRef] [Green Version]
- Paquin, R.; Colomban, P. Nanomechanics of single keratin fibres: A Raman study of the α-helix to β-sheet transition and water effect. PLoS ONE 2007, 38, 504–514. [Google Scholar] [CrossRef] [Green Version]
- Yu, Y.; Yang, W.; Wang, B.; Meyers, M.A. Structure and mechanical behavior of human hair. Mater. Sci. Eng. C 2017, 72, 152–163. [Google Scholar] [CrossRef] [PubMed]
- Andrade, I., Jr.; Taddei, S.R.A.; Souza, P.E.A. Inflammation and Tooth Movement: The Role of Cytokines, Chemokines, and Growth Factors. Semin. Orthod. 2012, 18, 257–269. [Google Scholar] [CrossRef]
- Park, J.Y.; Pillinger, M.H.; Abramson, S.B. Prostaglandin E2 synthesis and secretion: The role of PGE2 synthases. Clin. Immunol. 2006, 119, 229–240. [Google Scholar] [CrossRef]
- Cobourne, M.T.; Di Biase, A. Handbook of Orthodontics, 2nd ed.; Elsevier Science Ltd.: Oxford, UK, 2015. [Google Scholar]
- Raisz, L.G.; Pilbeam, C.C.; Fall, P.M. Prostaglandins: Mechanisms of action and regulation of production in bone. Osteoporos. Int. 1993, 3, 136–140. [Google Scholar] [CrossRef] [PubMed]
- Aubin, J.E.; Bonnelye, E. Osteoprotegerin and its ligand: A new paradigm for regulation of osteoclastogenesis and bone resorption. Osteoporos. Int. 2000, 11, 905–913. [Google Scholar] [CrossRef] [PubMed]
- Mayahara, K.; Kobayashi, Y.; Takimoto, K.; Suzuki, N.; Mitsui, N.; Shimizu, N. Aging stimulates cyclooxygenase-2 expression and prostaglandin E2 production in human periodontal ligament cells after the application of compressive force. J. Periodontal Res. 2007, 42, 8–14. [Google Scholar] [CrossRef] [PubMed]
- Kanzaki, H.; Chiba, M.; Shimizu, Y.; Mitani, H. Periodontal ligament cells under mechanical stress induce osteoclastogenesis by receptor activator of nuclear factor kappaB ligand up-regulation via prostaglandin E2 synthesis. J. Bone Miner. Res. 2002, 417, 210–220. [Google Scholar] [CrossRef] [Green Version]
- Kang, Y.G.; Nam, J.H.; Kim, K.H.; Lee, K.S. FAK pathway regulates PGE2 production in compressed periodontal ligament cells. J. Dent Res. 2010, 89, 1444–1449. [Google Scholar] [CrossRef]
- Toledo, D.A.; Roque, N.R.; Teixeira, L.; Milán-Garcés, E.A.; Carneiro, A.B.; Almeida, M.R.; Andrade, G.F.; Martins, J.S.; Pihho, R.R.; Freire-de-Lima, C.G.; et al. Lipid Body Organelles within the Parasite Trypanosoma cruzi: A Role for Intracellular Arachidonic Acid Metabolism. PLoS ONE 2016, 11, e0160433. [Google Scholar] [CrossRef]


| GROUP | SUBJECT CODE | SEX | AGE (years) |
|---|---|---|---|
| A (2-day OTM) | a | M | 20.9 |
| b | M | 25.9 | |
| c | F | 18.0 | |
| d | M | 20.8 | |
| B (7-day OTM) | b | M | 25.9 |
| e | F | 24.1 | |
| f | F | 13.8 | |
| f | F | 13.8 | |
| g | F | 28.4 | |
| C (14-day OTM) | h | M | 26.7 |
| c | M | 18.0 | |
| i | F | 17.2 | |
| i | F | 17.2 | |
| j | F | 20.2 | |
| k | F | 3.9 | |
| Mean AGE ± SD | 19.9 ± 4.7 |
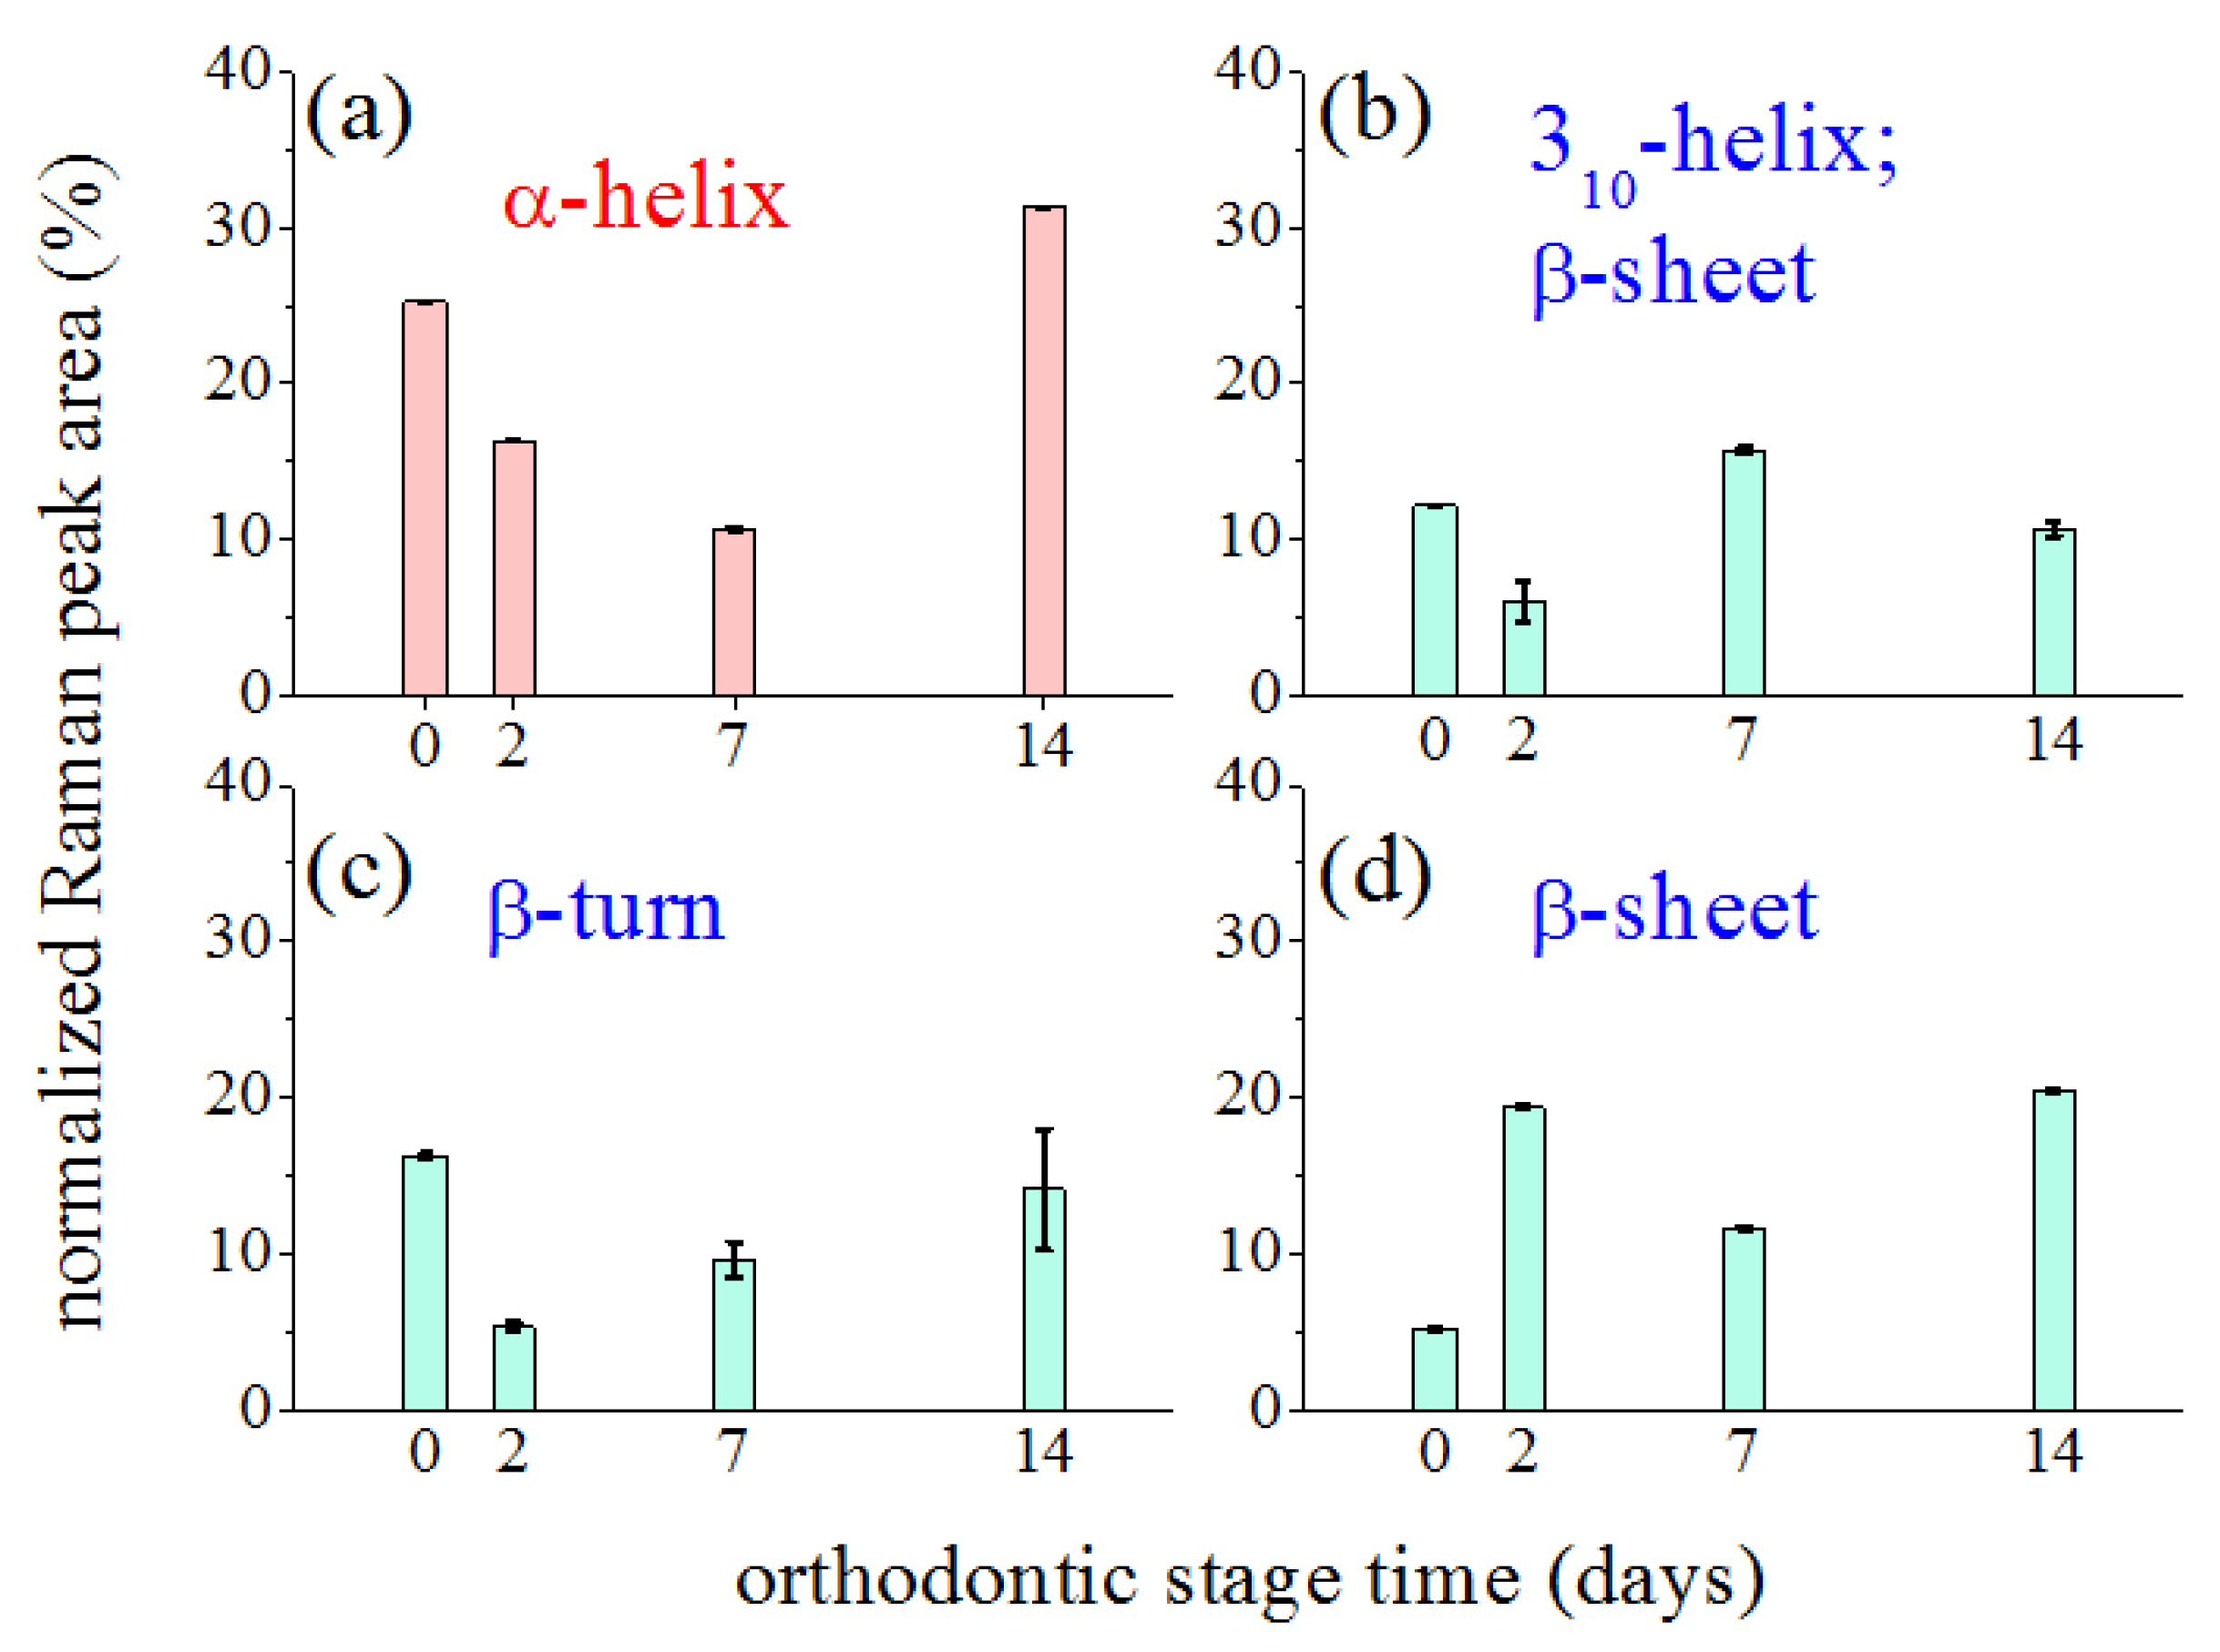
| Orthodontic Treatment (days) | -Helix (cm) | -Helix; (cm) | -Turn (cm) | -Sheet (cm) |
|---|---|---|---|---|
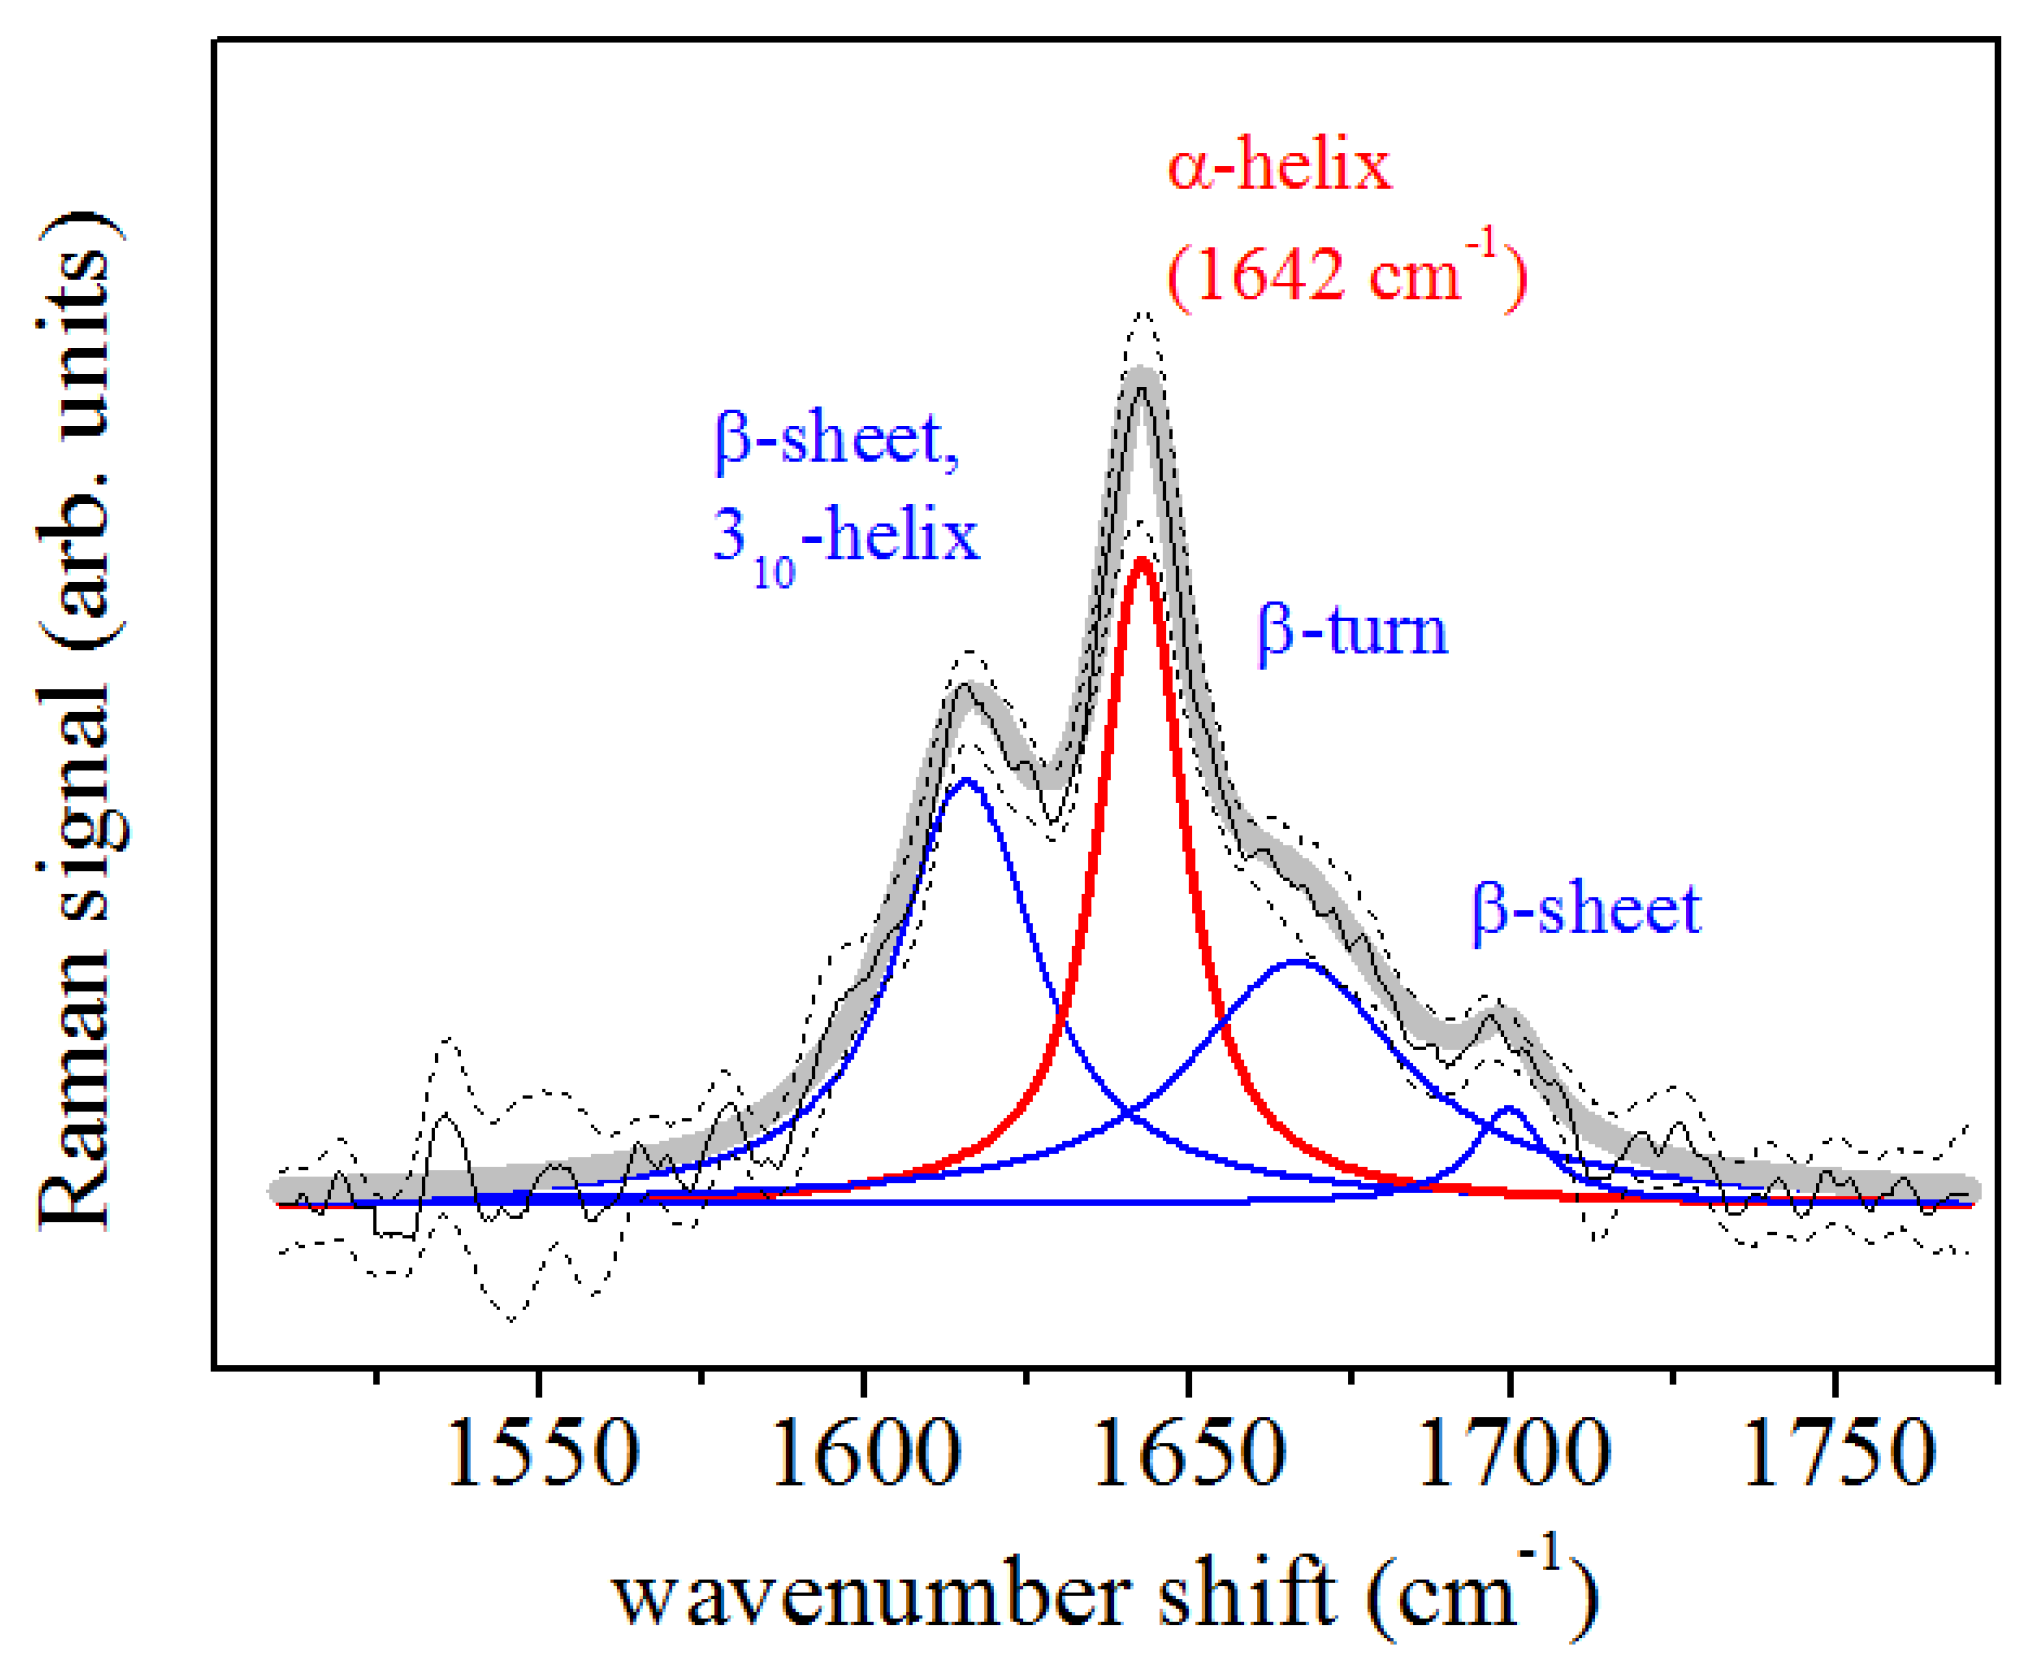
| 0 | 1642 | 1617 | 1668 | 1695 |
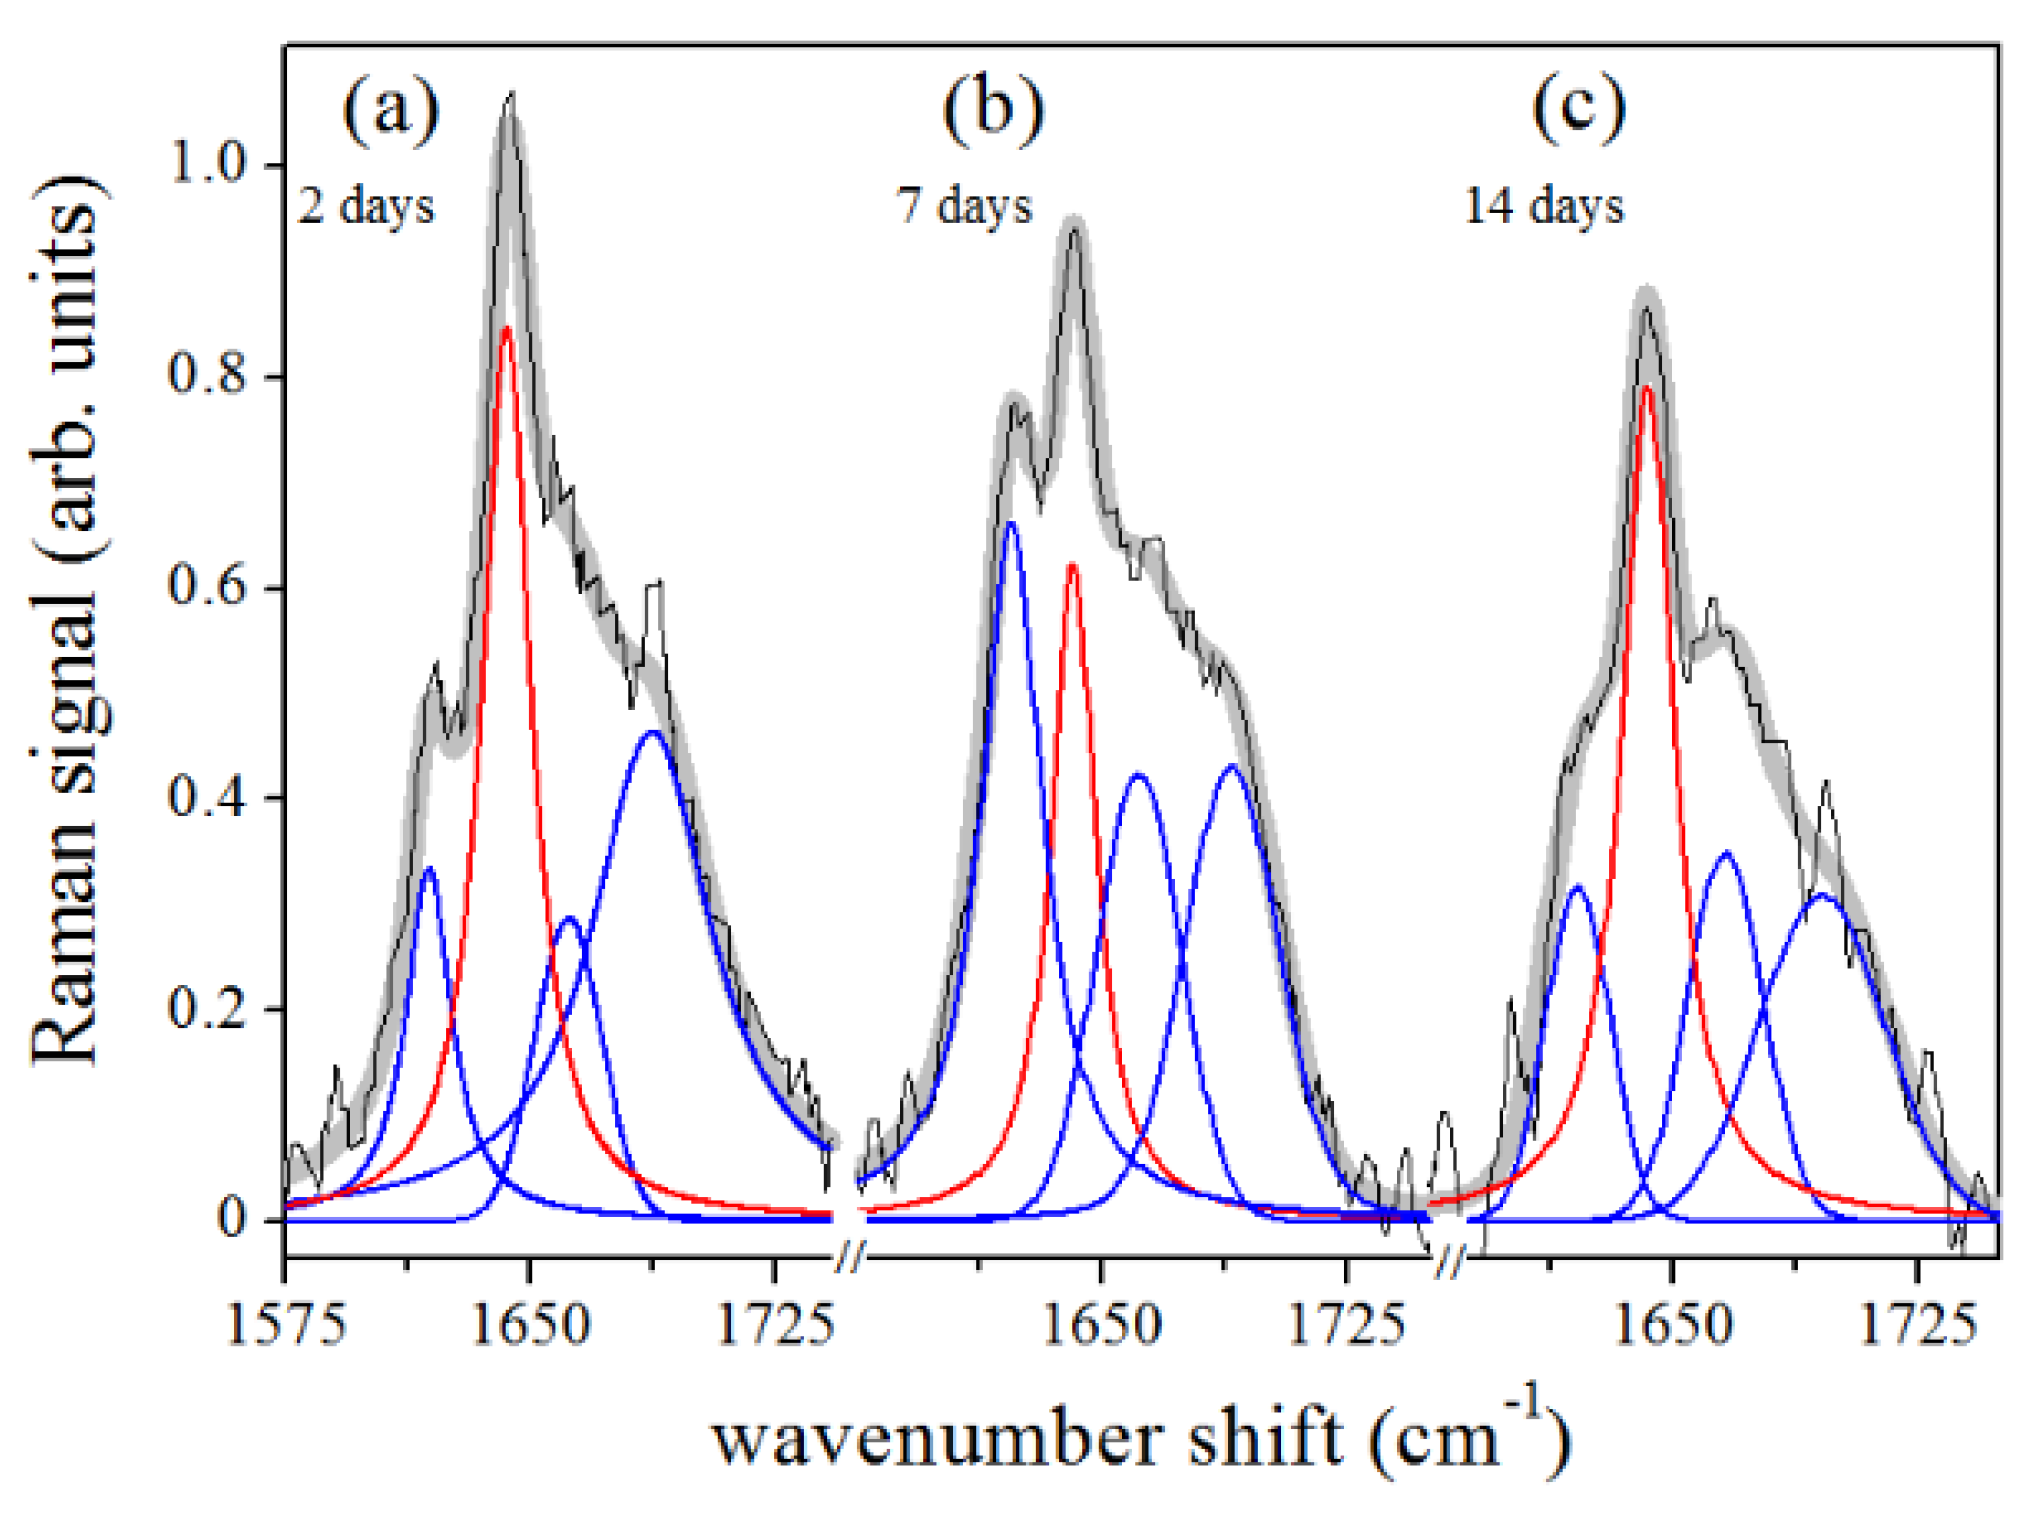
| 2 | 1643 | 1619 | 1662 | 1687 |
| 7 | 1641 | 1622 | 1661 | 1690 |
| 14 | 1642 | 1621 | 1666 | 1695 |
| Orthodontic Treatment (days) | -Helix (cm) | Random Coil (cm) | -Sheet (cm) |
|---|---|---|---|
| 0 | 1309 | 1258 | 1243 |
| 2 | 1307 | 1265 | 1245 |
| 7 | 1310 | 1266 | 1247 |
| 14 | 1307 | 1273 | 1252 |
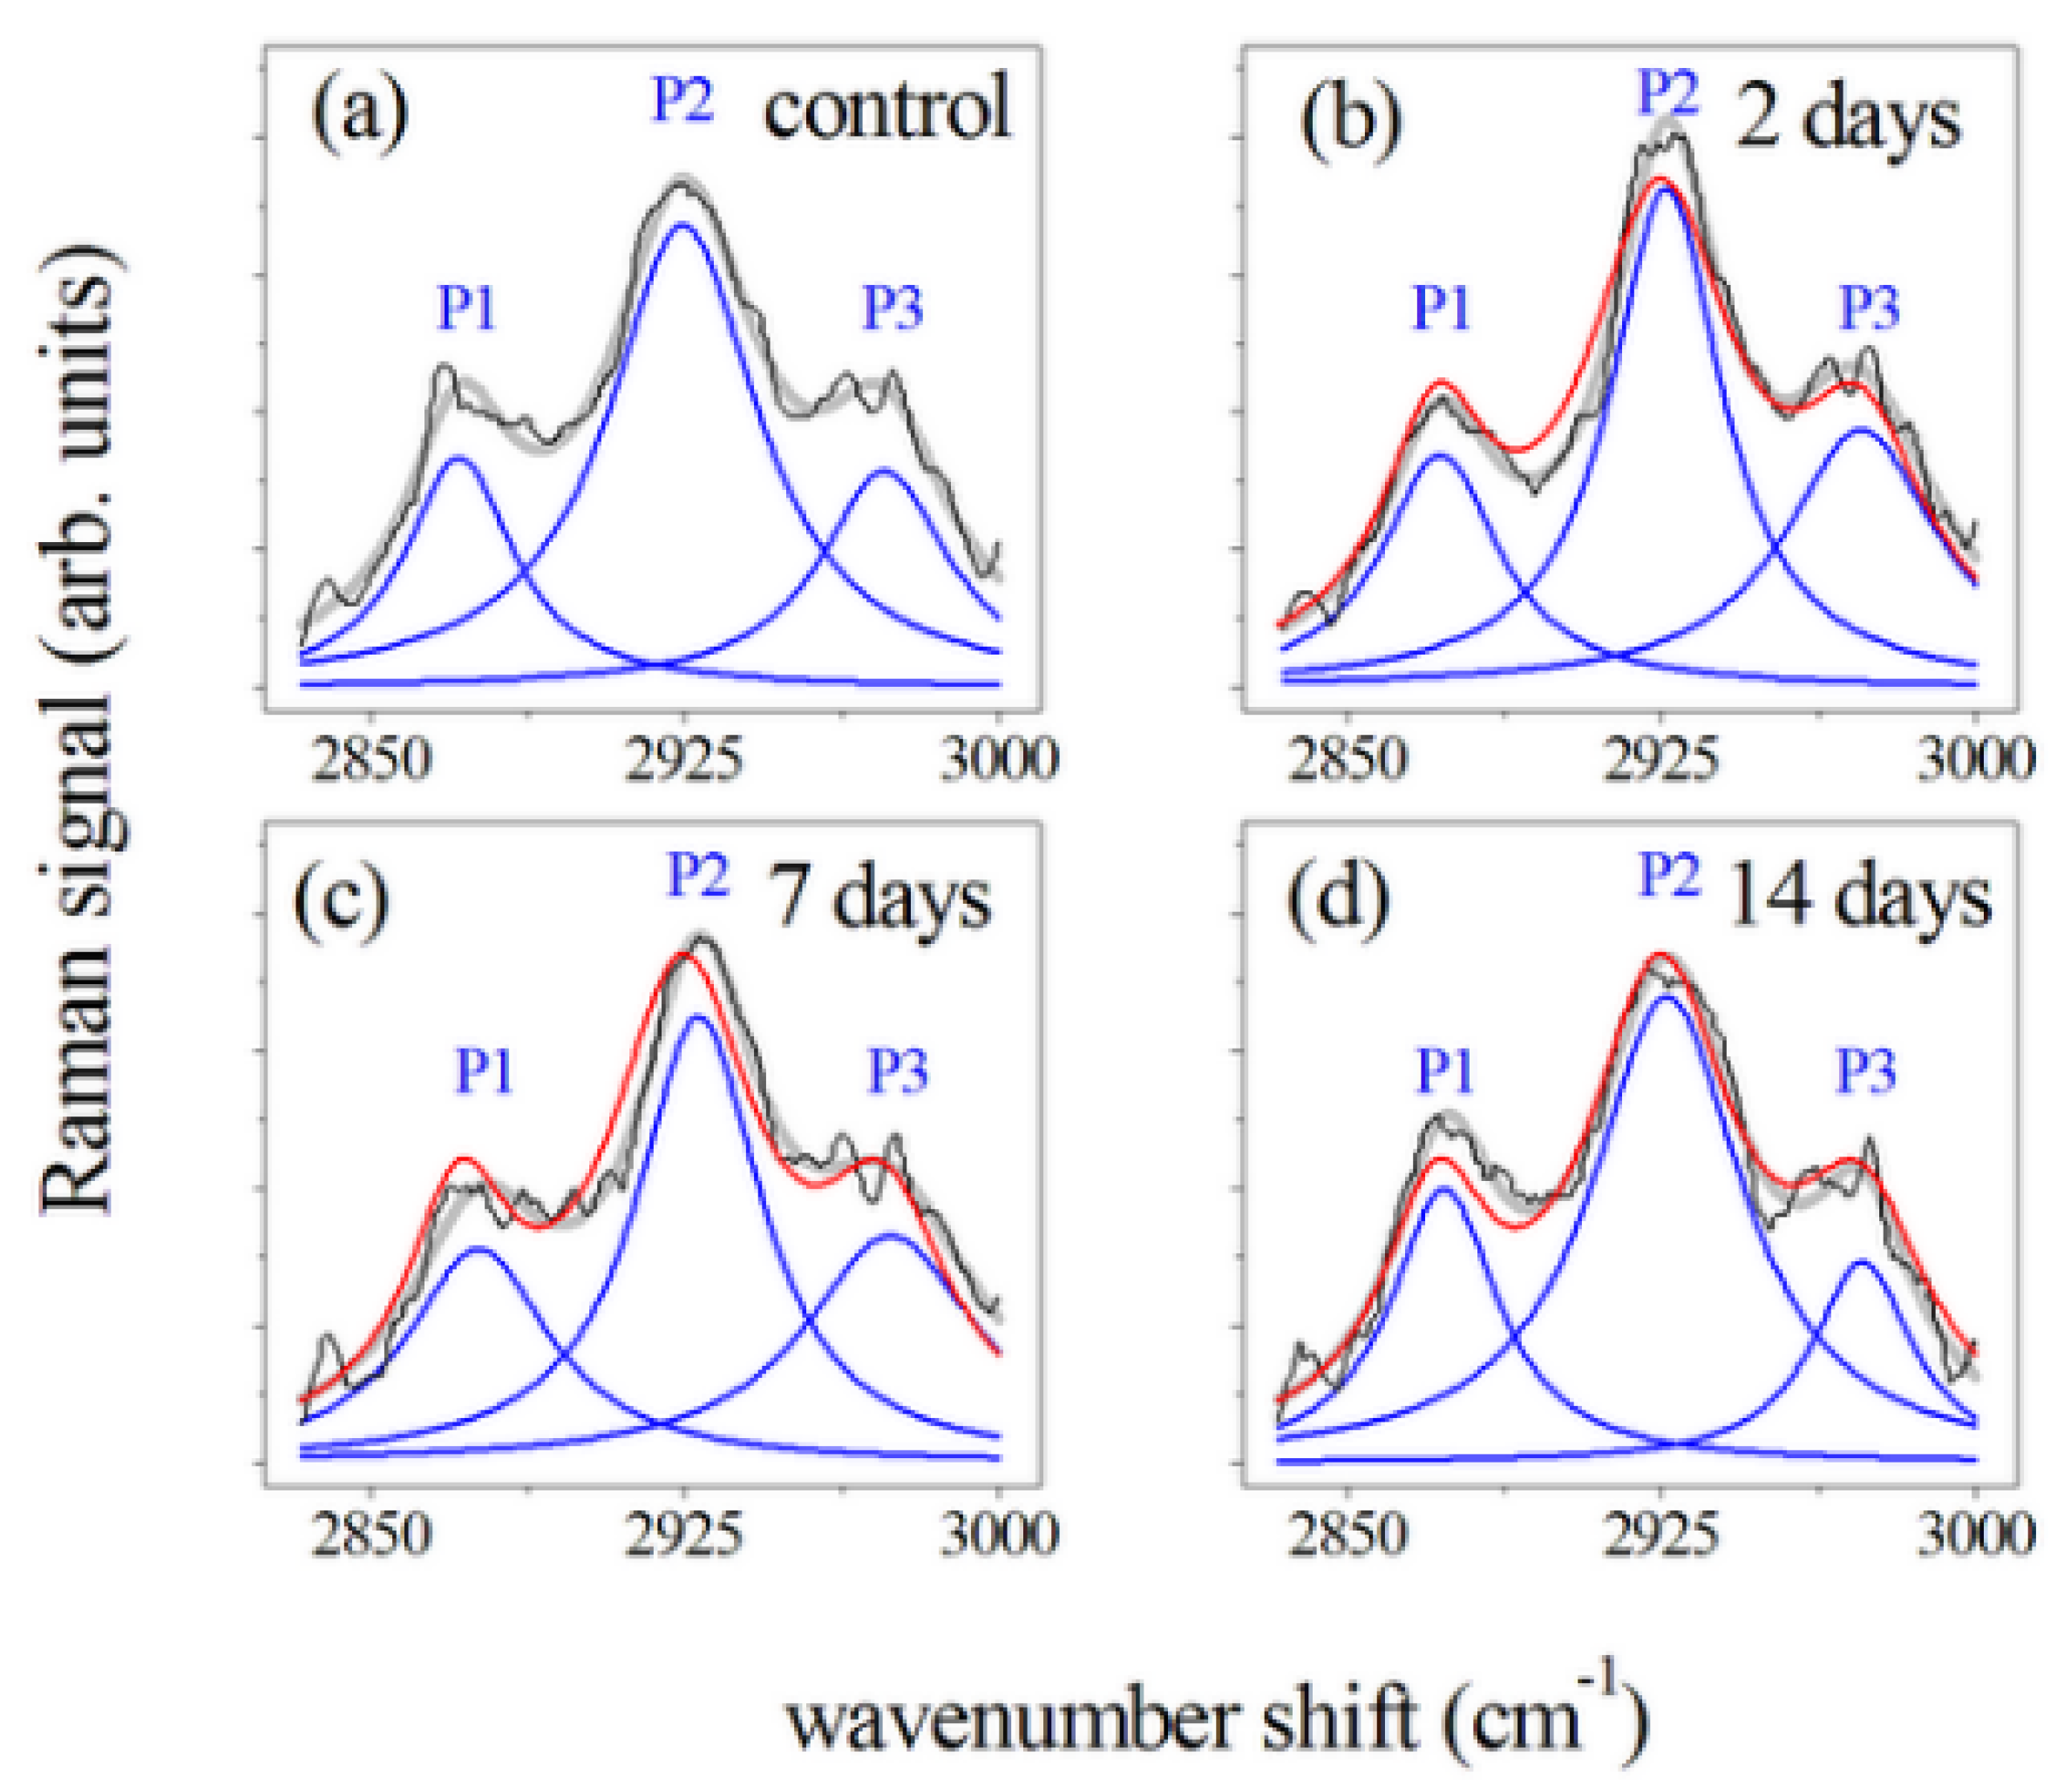
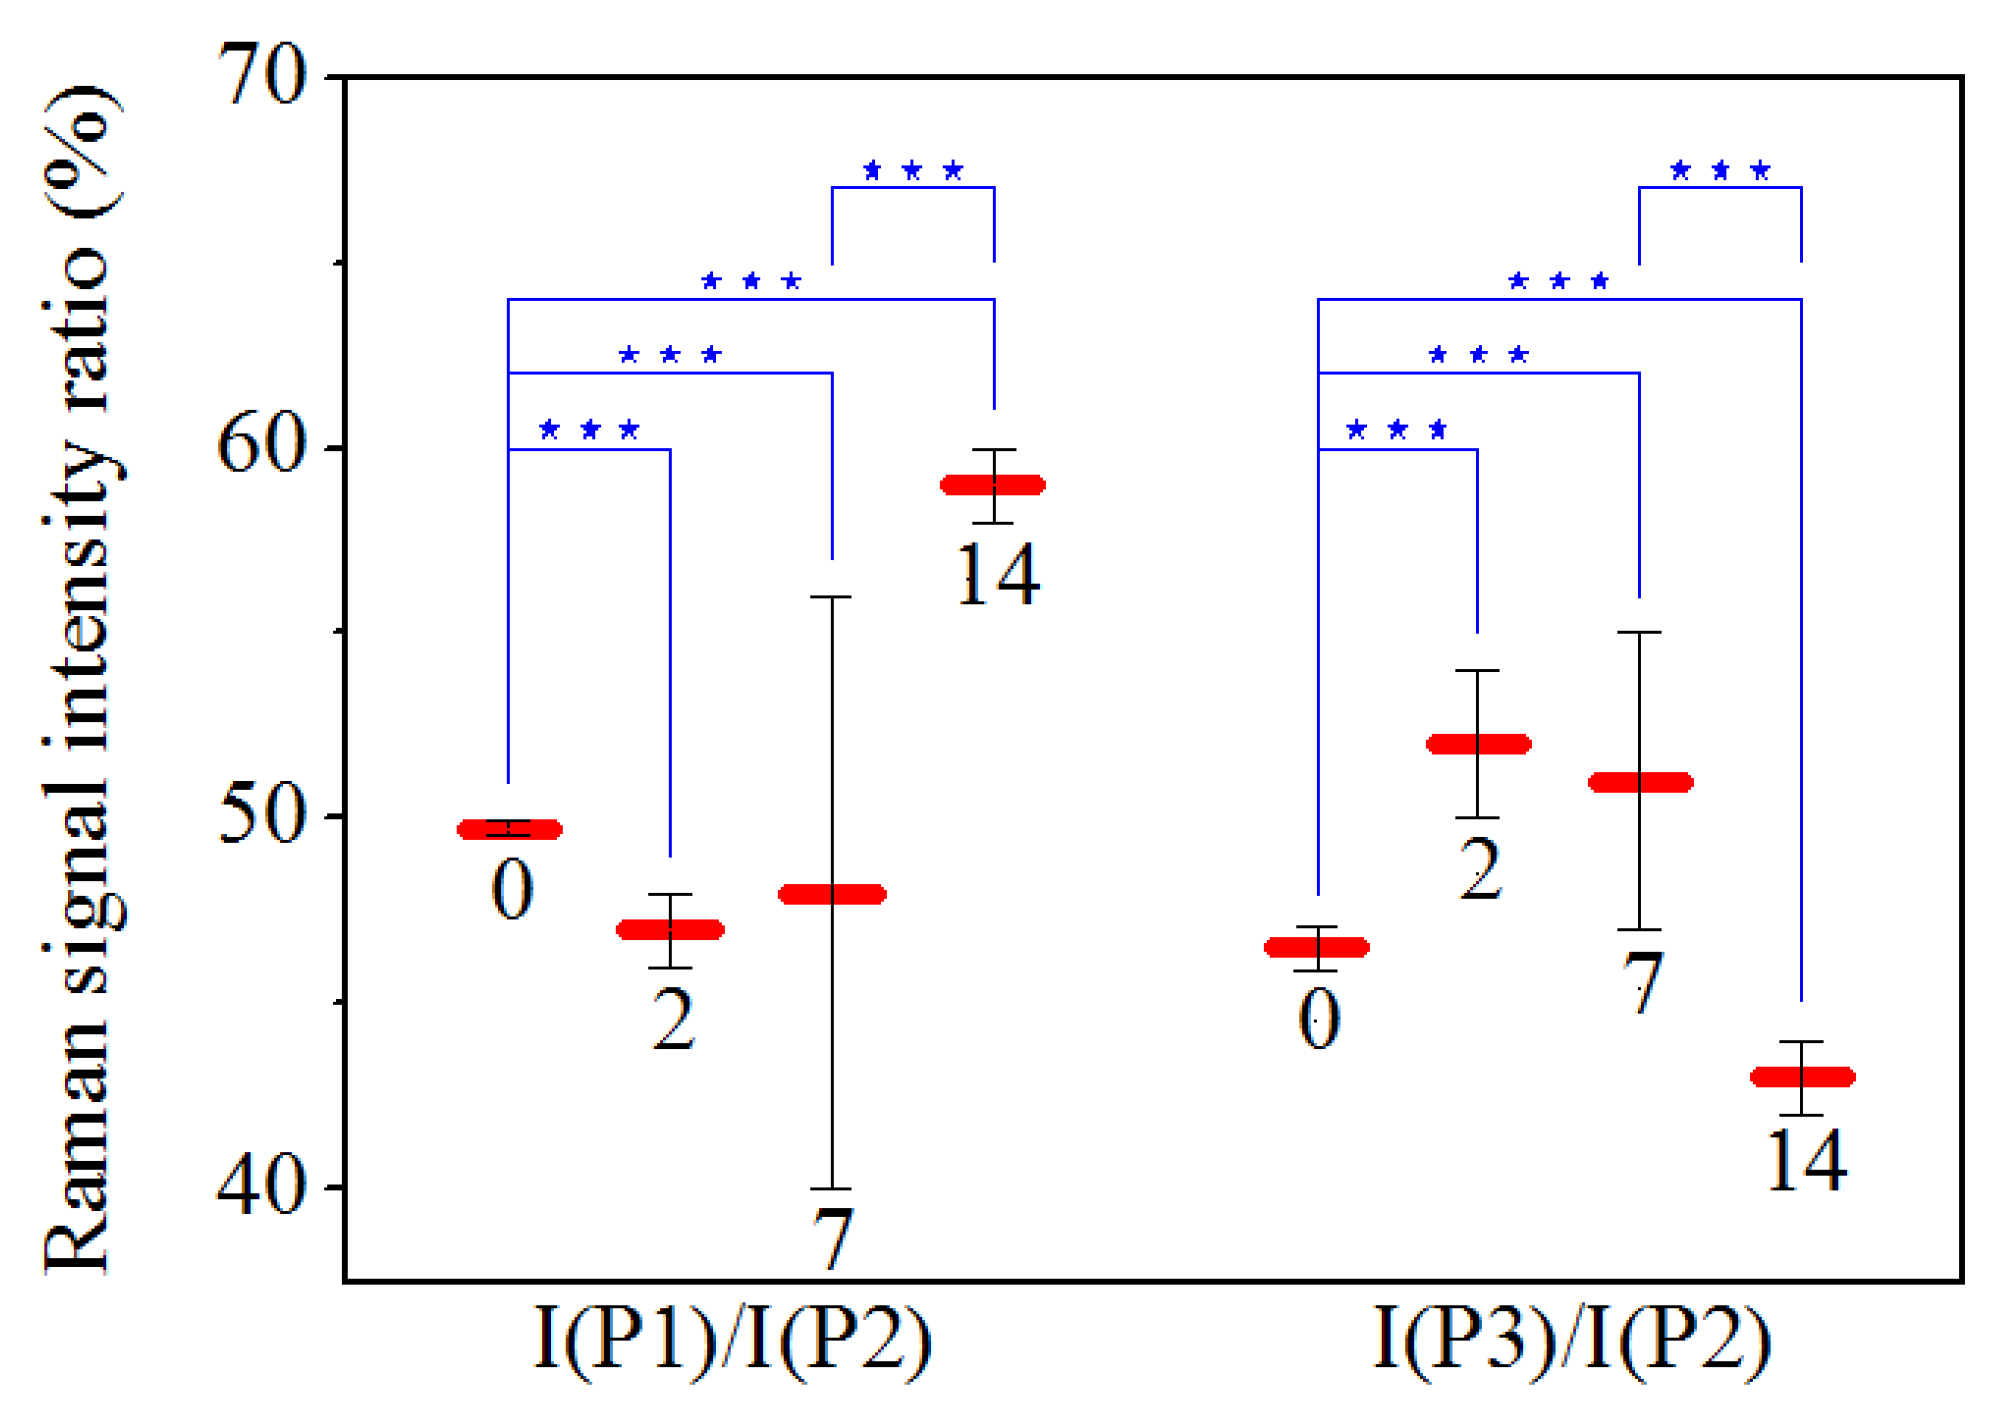
| Orthodontic Treatment (days) | I(P1) (a. u.) | I(P2) ; (a. u.) | I(P3) (a. u.) | I(P1) /I(P2) (%) | I(P3)/ I(P2) (%) |
|---|---|---|---|---|---|
| 0 | 5.02 ± 0.03 | 10.10 ± 0.03 | 4.70 ± 0.05 | 49.7 ± 0.2 | 46.5 ± 0.6 |
| 2 | 5.07 ± 0.06 | 10.90 ± 0.06 | 5.6 ± 0.1 | 47 ± 1 | 52 ± 2 |
| 7 | 4.7 ± 0.8 | 9.7 ± 0.4 | 5.0 ± 0.2 | 48 ± 8 | 51 ± 4 |
| 14 | 6.00 ± 0.03 | 10.20 ± 0.03 | 4.40 ± 0.05 | 59 ± 1 | 43 ± 1 |
© 2020 by the authors. Licensee MDPI, Basel, Switzerland. This article is an open access article distributed under the terms and conditions of the Creative Commons Attribution (CC BY) license (http://creativecommons.org/licenses/by/4.0/).
Share and Cite
Perillo, L.; d’Apuzzo, F.; Illario, M.; Laino, L.; Di Spigna, G.; Lepore, M.; Camerlingo, C. Monitoring Biochemical and Structural Changes in Human Periodontal Ligaments during Orthodontic Treatment by Means of Micro-Raman Spectroscopy. Sensors 2020, 20, 497. https://doi.org/10.3390/s20020497
Perillo L, d’Apuzzo F, Illario M, Laino L, Di Spigna G, Lepore M, Camerlingo C. Monitoring Biochemical and Structural Changes in Human Periodontal Ligaments during Orthodontic Treatment by Means of Micro-Raman Spectroscopy. Sensors. 2020; 20(2):497. https://doi.org/10.3390/s20020497
Chicago/Turabian StylePerillo, Letizia, Fabrizia d’Apuzzo, Maddalena Illario, Luigi Laino, Gaetano Di Spigna, Maria Lepore, and Carlo Camerlingo. 2020. "Monitoring Biochemical and Structural Changes in Human Periodontal Ligaments during Orthodontic Treatment by Means of Micro-Raman Spectroscopy" Sensors 20, no. 2: 497. https://doi.org/10.3390/s20020497