Ankyrin-G mediates targeting of both Na+ and KATP channels to the rat cardiac intercalated disc
- NYU School of Medicine, United States
- Imperial College London, United Kingdom
Abstract
We investigated targeting mechanisms of Na+ and KATP channels to the intercalated disk (ICD) of cardiomyocytes. Patch clamp and surface biotinylation data show reciprocal downregulation of each other’s surface density. Mutagenesis of the Kir6.2 ankyrin binding site disrupts this functional coupling. Duplex patch clamping and Angle SICM recordings show that INa and IKATP functionally co-localize at the rat ICD, but not at the lateral membrane. Quantitative STORM imaging show that Na+ and KATP channels are localized close to each other and to AnkG, but not to AnkB, at the ICD. Peptides corresponding to Nav1.5 and Kir6.2 ankyrin binding sites dysregulate targeting of both Na+ and KATP channels to the ICD, but not to lateral membranes. Finally, a clinically relevant gene variant that disrupts KATP channel trafficking also regulates Na+ channel surface expression. The functional coupling between these two channels need to be considered when assessing clinical variants and therapeutics.
Introduction
Voltage-gated Na+ channels are responsible for the initiation and propagation of action potentials in many excitable cell types, including neurons, skeletal muscle and cardiac myocytes. The pore-forming α-subunit of the cardiac Na+ channel (Nav1.5) is encoded by the SCN5A gene. A large amount of genetic information has linked SCN5A variants to inherited forms of arrhythmias and sudden death, including Brugada syndrome, sick sinus syndrome, Long-QT syndrome and others (Veerman et al., 2015). Nav1.5 interacts with several types of proteins, including 14-3-3, Ca2+/calmodulin-dependent protein kinase II (CaMKII), Fibroblast growth factor 13 (FGF13), Ankyrin-G (AnkG) and several others (Shy et al., 2013). Mutations in these interactors are also associated with arrhythmogenic syndromes since they affect the Na+ channel (Shy et al., 2013). It is of paramount importance, therefore, to know which proteins associate with Na+ channels and how they affect Na+ channel expression and function.
The sarcolemmal ATP-sensitive K+ (KATP) channel is one of the most abundant channels expressed in cardiac myocytes and it promotes action potential shortening adaptation with elevated heart rates (Foster and Coetzee, 2016). KATP channels additionally have important protective effects during metabolic stress and hypoxia/ischemia. Studies with murine genetic models have demonstrated that sarcolemmal KATP channels mediate a key component of the protective effects of ischemic preconditioning (Foster and Coetzee, 2016). As sensors of intracellular nucleotides (ATP, MgADP and AMP), KATP channels couple alterations in energy metabolism to K+ fluxes and membrane excitability (Foster and Coetzee, 2016). Intracellular ATP blocks the channel by binding to a pocket formed by the intracellular N- and C-termini of Kir6.x, whereas ADP promotes channel opening by binding to intracellular nucleotide binding folds on the partner subunit, SURx. Two genes (KCNJ8 and KCNJ11) respectively code two distinct pore-forming Kir6.1 and Kir6.2 subunits, and two genes (ABCC8 and ABCC9) code for the accessory SUR1 and SUR2 subunits. Two major SUR2 isoforms (SUR2A and SUR2B) exist as a result of alternative mRNA splicing (Foster and Coetzee, 2016).
Despite the obvious functional differences in cardiac Na+ channels and KATP channels, there are also similarities, particularly in their subcellular expression profiles. At least two distinct pools of Na+ channels have been identified in cardiac myocytes (Shy et al., 2013). One pool is targeted to lateral membranes by the syntrophin/dystrophin complex (Gavillet et al., 2006; Hund et al., 2010), whereas another subpopulation is organized in a highly specialized macromolecular complex at the intercalated disk (ICD) region (Agullo-Pascual et al., 2014), where targeting and anchoring is coordinated by AnkG, Synapse-associated protein 97 (SAP97), Microtubule plus-end binding protein (EB1) and Plakophilin-2 (PKP2) (Shy et al., 2013; Gillet et al., 2014). KATP channel subcellular expression follows a similar trend: The presence of KATP channels in lateral membranes was established by their initial identification with patch clamp methods (Foster and Coetzee, 2016). However, as with Na+ channels, KATP channels are enriched at the ICD of cardiac myocytes where they morphologically cluster with desmosomal proteins such as PKP2 (Hong et al., 2012), suggesting that KATP channels form part of an ICD channel/transporter complex that is gaining increasing recognition for roles in cell-cell communication and cell adhesion.
It is a common theme in cardiac electrophysiology that ion channels in the same subdomain have the potential to interact with each other, as well as with other channels and transporters. Here, we provide evidence that Na+ channels and KATP channels are morphologically clustered (particularly at the ICD) and that they interact functionally, most likely due to the fact that they are targeted to a common subcellular location by AnkG. These studies provide a new paradigm when considering pharmacological and genetic aspects of arrhythmogenesis.
Results
KATP and Nav1.5 channels negatively regulate each other in HEK293 cells
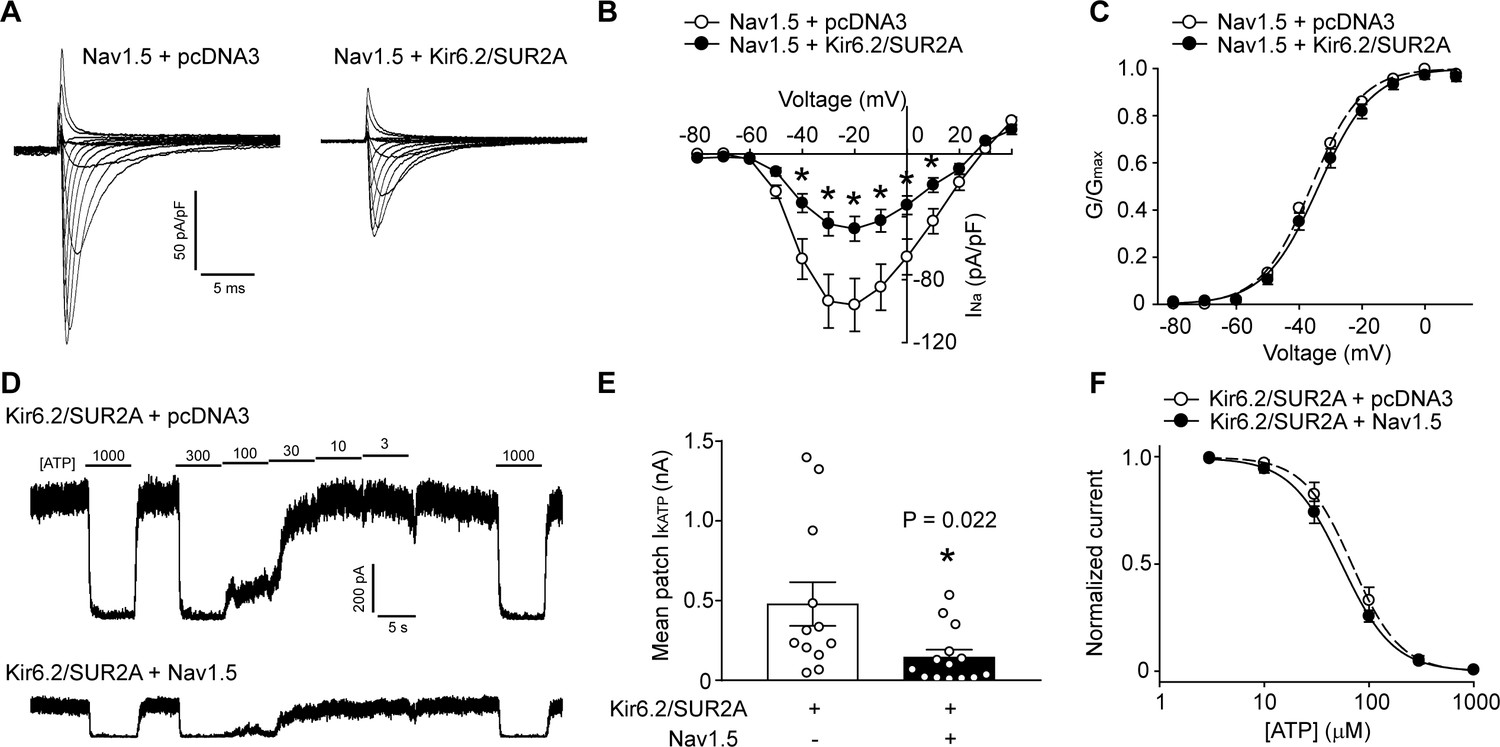
Distinct subpopulations of Na+ channels and KATP channels exist in a cardiomyocyte, but the relevance of this observation has been unclear. Recent studies have shown that the function and trafficking of Na+ channels can be regulated by some K+ channels, including Kir2.1 and Kv4.3 (Portero et al., 2018; Ponce-Balbuena et al., 2018). We investigated whether an interaction exists between Na+ and KATP channels. First, we performed experiments with HEK293 cells transfected with only KATP channels (Kir6.2/SUR2A), only Na+ channels (Nav1.5), both type of channels, or with an empty vector (pcDNA3) as a negative control. Unlike Kir2.1, which positively regulates Nav1.5, we unexpectedly found that the whole-cell Na+ current density was significantly smaller when KATP channels were present (Figure 1A and B). The voltage-dependence of steady-state activation of the Na+ channel and the inactivation kinetics were unchanged by the presence of KATP channels (Figure 1C and Figure 1—figure supplement 1). We next tested whether K+ flux through KATP channels plays a role. To answer this question, we took advantage of the fact that mutating the GFG sequence in the Kir6.2 pore to AAA produces a non-functional channel that still traffics normally to the cell membrane (Tong et al., 2006). As with the wild-type channel, Kir6.2-AAA also suppressed Nav1.5 currents (Figure 1—figure supplement 2), demonstrating that a conducting KATP channel is not required. Reciprocal functional interaction occurs since the KATP channel mean patch current in excised patches were significantly reduced when Na+ channels were present (Figure 1D and E). The presence of Na+ channels did not affect the sensitivity of KATP channels to ‘cytosolic’ ATP (Figure 1F). Of note, the negative regulation of one channel by the other was not due to differences in transfection efficiency, transcription or translation since the Nav1.5 protein levels in cell lysates were unchanged in the presence of KATP channels, and co-transfection with Nav1.5 did not affect total Kir6.2 protein levels (Figure 2). Collectively, these data demonstrate that KATP channels and Na+ channels negatively regulate each other’s function when overexpressed in a heterologous expression system.
Figure 1 with 2 supplements see all
KATP channels and Na+ channels reciprocally reduce the functional expression of one another.
(A) Representative whole-cell Na+ current recordings from Nav1.5 transfected HEK293 cells co-transfected with empty vector (pcDNA3) or KATP channel (Kir6.2+SUR2A). (B) Averaged current-voltage relationships of Nav1.5 co-expressed with empty vector (open symbols; n = 12) or Kir6.2/SUR2A (filled symbols; n = 10). *p<0.001 determined by two-way ANOVA followed by Tukey’s test. (C) The voltage dependence of steady-state activation was calculated from the traces in panel A. Values of GNa were normalized to the maximum conductance and plotted as a function of voltage. The symbols have the same meaning as in panel B. (D) Representative inside-out current recordings obtained from KATP channel (Kir6.2+SUR2A) transfected HEK293 cells co-transfected with empty vector (pcDNA3) or Nav1.5. ATP concentrations (µM) were switched as indicated. The mean patch current was recorded at a membrane potential of −80 mV (a voltage at which Nav1.5 is inactive) and the KATP channel current was defined by the current component blocked by 1 mM ATP applied to the ‘cytosolic’ face of the patch. Recordings were made immediately after patch excision to minimize effects of ‘run-down’. (E) Data points from Kir6.2/SUR2A transfected cells co-transfected with empty vector (pcDNA3) (open symbols; n = 12) or Nav1.5 (filled symbols; n = 14). *p=0.022 using the Student’s t test. (F) The ATP-sensitivity of KATP channels was determined by plotting the KATP current (normalized to the maximum current) as a function of the ‘cytosolic’ ATP concentration. Data from individual patches were subjected to curve fitting to a modified Boltzmann equation, yielding IC50 values for ATP inhibition of 63.0 ± 9.5 µM and 66.2 ± 10.6 µM respectively for Kir6.2/SUR2A without and with Nav1.5. Data are from a minimum of 3 separate transfections.
Figure 2
KATP channels and Na+ channels reciprocally reduce the surface expression of each other.
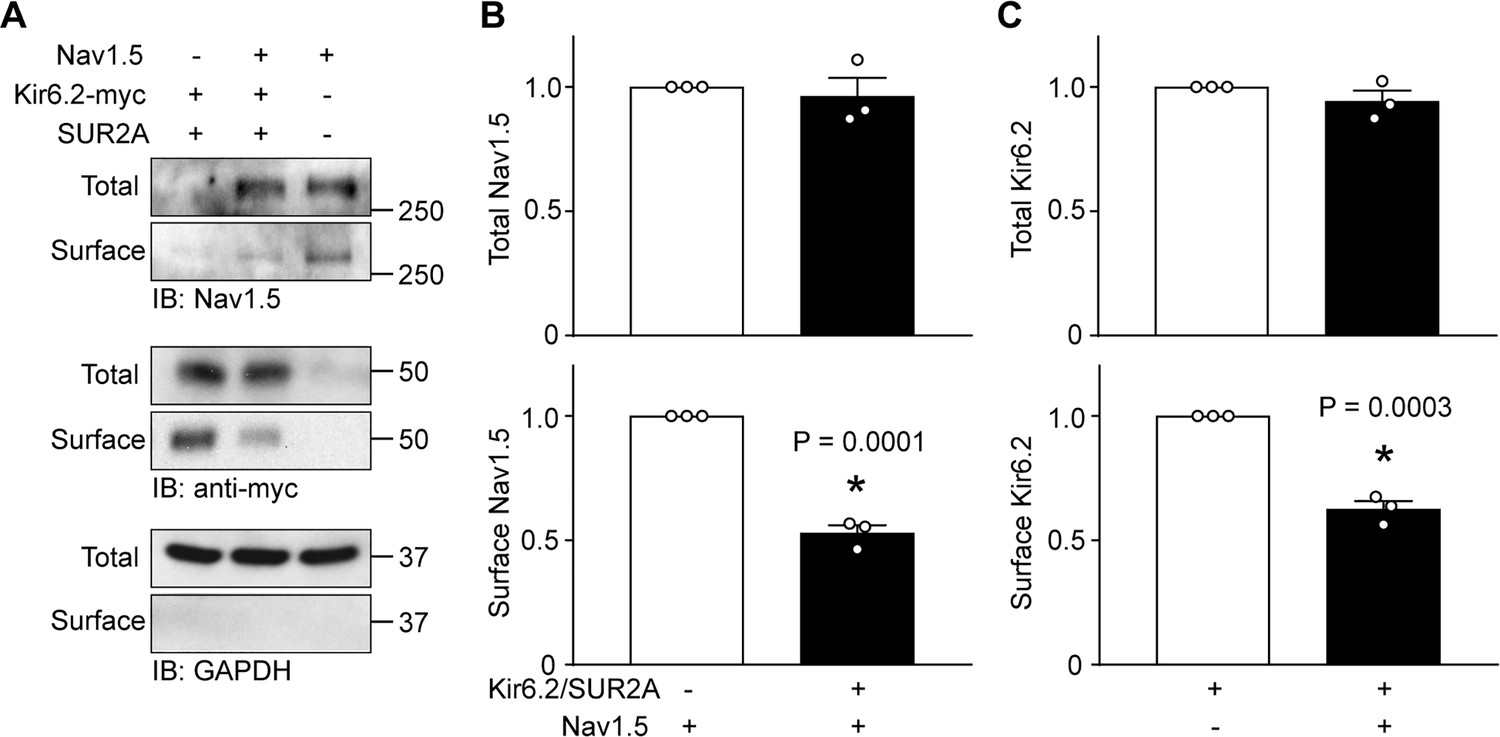
HEK-293 cells were transfected with combinations of Kir6.2 (C-terminal tagged with 6 × myc epitopes), SUR2A, Nav1.5 as indicated. pcDNA3 was included to keep the cDNA amounts equivalent in transfections. (A) Cell lysates (Total) or surface biotinylated membrane fractions (Surface) were subjected to SDS-PAGE and immunoblotted with antibodies against Nav1.5, myc, or GAPDH. A representative immunoblot is shown. Panels B and C respectively show data averaged from three similar blots. Total Nav1.5 or Kir6.2 protein in cell lysates were normalized to the amount of GAPDH, whereas surface expression was normalized to the total Nav1.5 or Kir6.2 protein. *p=0.0001 and p=0.0003 for panel B and C respectively with Student’s t test.
Negative regulation is imparted by a reduction in surface expression
Since the current densities were reduced by co-expression, but other channel properties remained unaltered, we used surface biotinylation assays to investigate whether surface expression was reduced. Data from these experiments demonstrated that the surface expression of Nav1.5, relative to the total Nav1.5 protein in the cell lysates, was significantly reduced when KATP channels were co-expressed (Figure 2A and B). To assess KATP channel surface expression we used a Kir6.2 construct with an extracellular Avi tag and C-terminal myc tag (Avi-Kir6.2-myc), which functions and traffics similar to wild-type Kir6.2 (Yang et al., 2018). Similar to the previous result, we found that KATP channel surface expression was significantly impaired by Na+ channels overexpression (Figure 2A and C).
A key role for the Kir6.2 ankyrin binding site
The surface abundance of membrane proteins can be regulated by anchoring mechanisms. Na+ and KATP channels have been reported to be respectively regulated by Ankyrin-G and B (Mohler et al., 2004; Kline et al., 2009). The AnkG binding motif of Nav1.5 consists of amino acids VPIAVAESD (Mohler et al., 2004), whereas the Kir6.2 C-terminal amino acid sequence VPIVAEED is necessary for in vitro binding to a GST-tagged AnkB membrane-binding domain, AnkB-MBD (Figure 3A) (Kline et al., 2009). Mutagenesis of negatively charged amino acids within this motif (E321K, E322K and D323K) disrupts both Kir6.2/AnkB-MBD binding and Kir6.2 surface expression (Kline et al., 2009). To investigate the potential role of ankyrin binding, we mutated the EED residues to lysine (Kir6.2-KKK). These mutations decreased Kir6.2 surface expression in HEK293 cells and we had to increase the cDNA amounts during transfections to accomplish cellular protein levels comparable to wild-type (Figure 3—figure supplement 1). As before, co-expression with WT-Kir6.2/SUR2A significantly reduced whole-cell Nav1.5 currents. By contrast, Kir6.2-KKK/SUR2A did not functionally interact with Na+ channels (Figure 3B). Moreover, surface biotinylation data demonstrated that WT-Kir6.2/SUR2A reduced surface expression of Nav1.5 as expected, but Kir6.2-KKK/SUR2A had no such effect (Figure 3C and D). We investigated whether the functional interaction also occurs with the other member of the Kir6 subfamily, namely Kir6.1, which does not bind to AnkB-MBD (Kline et al., 2009). Interestingly, Kir6.1/SUR2A was without effect on Nav1.5 currents (Figure 3B). Note that SUR2A was also present in this experiment, which supports the argument that the phenotype is intrinsic to Kir6.2, and not to SUR2A. Overall, these results demonstrate that the functional interactions of Nav1.5 and KATP channels are tightly coupled to the presence of an intact ankyrin binding domain in Kir6.2, therefore suggesting the possibility that competition for ankyrin binding mediates the functional interaction.
Figure 3 with 1 supplement see all

An intact Kir6.2 ankyrin binding motif is necessary for functional interaction.
(A) Sequence alignment of ankyrin binding motifs (or corresponding residues) of various Nav channels and members of the Kir6 subfamily of inward rectifier K+ channels. The Kir6.2-KKK shows the mutations made to disrupt the binding motif. (B) Whole-cell Na+ currents were measured in HEK293 cells and averaged current-voltage relationships are plotted for cells transfected with Nav1.5 plus either empty vector (n = 8), Kir6.1/SUR2A (n = 6), Kir6.2/SUR2A (n = 7) or Kir6.2-KKK/SUR2A (n = 6). Data are from a minimum of 3 transfections. *p<0.001 determined by two-way ANOVA followed by Tukey’s test. (C) HEK-293 cells were transfected with Nav1.5 plus combinations of empty vector, Kir6.2/SUR2A, or Kir6.2-KKK/SUR2A. Cell lysates (Total) or surface biotinylated membrane fractions (Surface) were subjected to SDS-PAGE and immunoblotted with antibodies against Nav1.5 or GAPDH. A representative immunoblot is shown. (D) Averaged data of Nav1.5 surface expression normalized to the total Nav1.5 protein from three similar blots. *p=0.020 with 1W ANOVA followed by Dunnett’s test.
Functional co-localization of Na+ and KATP channels at the intercalated disc region of cardiac myocytes
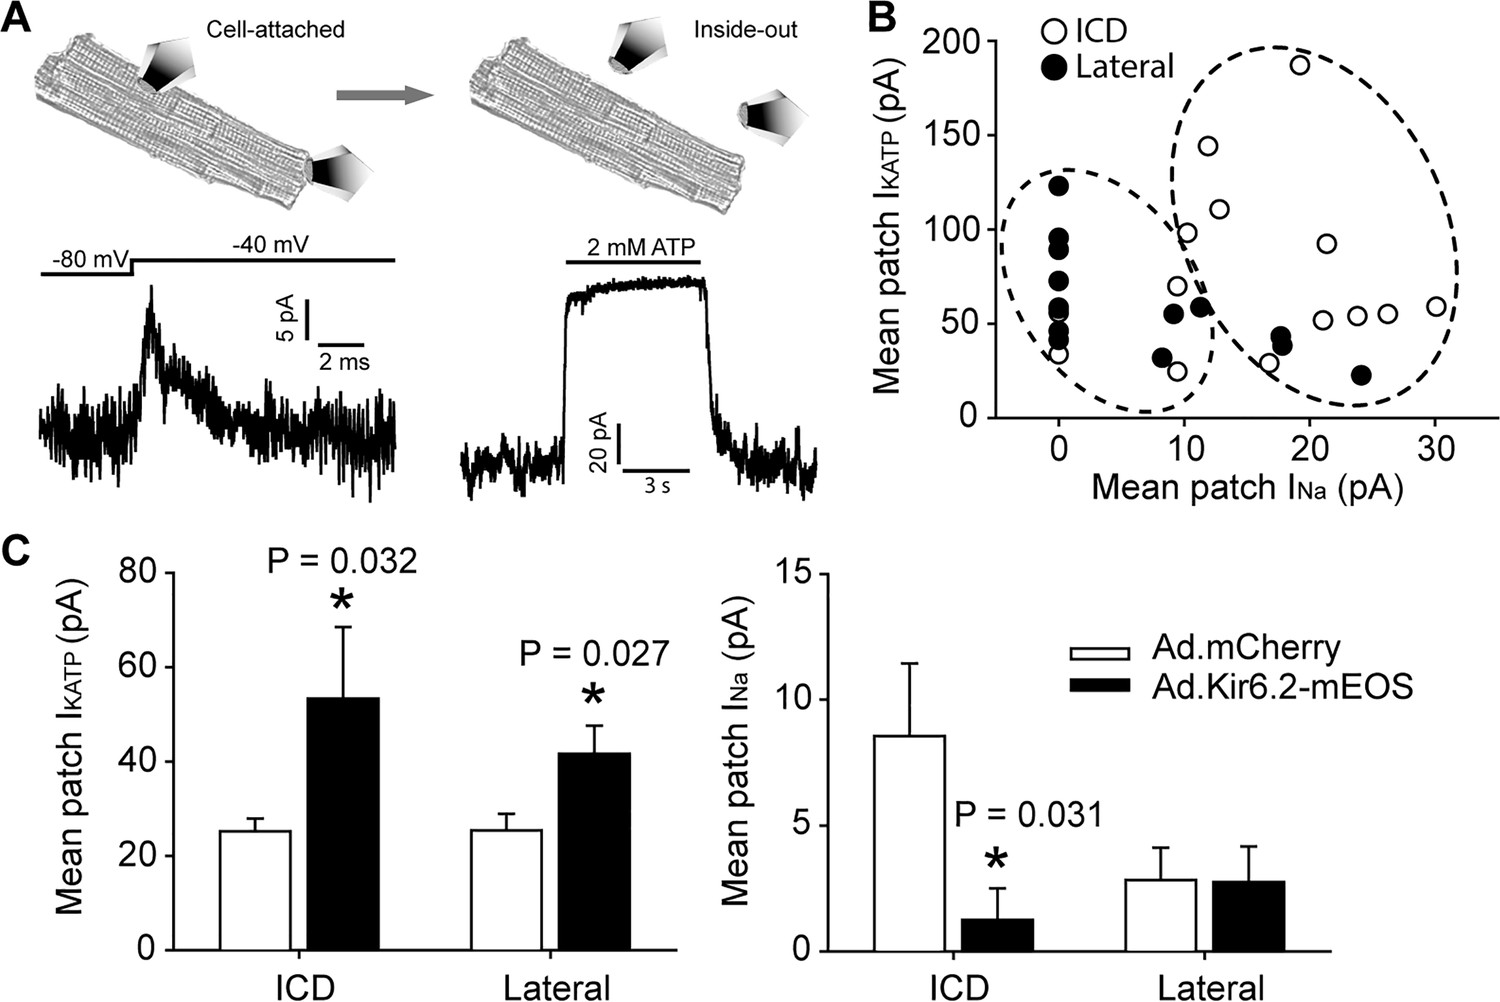
We started to investigate whether Na+ channels and KATP channels functionally interact in cardiomyocytes by overexpressing Kir6.2 with a C-terminal mEos tag (Ad.Kir6.2-mEos) via adenoviral delivery. Indeed, rat cardiomyocytes expressing Kir6.2-mEos had a significantly reduced whole-cell Na+ current density compared to Ad.mCherry as a negative control (Figure 4—figure supplement 1). A key question, however, is whether the functional co-localization of Na+ channels and KATP channels can be demonstrated at a subcellular level. To accomplish this goal, we have developed a novel duplex patch clamp technique that allows sequential measurements of the two currents in the same membrane patch (illustrated in Figure 4A). Assuming that the free patch area of a 2–3 MΩ pipette is ~10 µm2 (Sakmann and Neher, 1995), this technique has a spatial resolution of ~2–3 µm. The INa is first recorded in a cell-attached membrane patch as in our previous studies (Lin et al., 2011). This Na+ channel recording is uncontaminated by KATP channels, which are closed at rest in an intact cell. The patch is then excised to measure the IK(ATP) mean patch current in an inside-out membrane patch. The membrane voltage is kept at +80 mV to inactivate INa and the magnitude of IK(ATP) is defined as the current component that is blocked by ‘intracellular’ ATP. Such paired recordings were made at the lateral membrane, or as close as feasible to the end of the cardiomyocyte (the ICD region) and paired recordings are summarized in Figure 4B. A key observation was that the majority of ICD patches expressed INa, but it was found in only ~50% of lateral patches. By contrast, each of the patches from lateral membranes and the ICD contained KATP channels. These paired data (blinded to their origin) were analyzed with machine learning algorithms (hierarchical clustering), which demonstrated two distinct populations (Figure 4—figure supplement 2). The lateral and ICD paired recordings segregated statistically between these two clusters (Figure 4B; Fisher’s Exact test, p=0.002), demonstrating that the ICD and lateral paired data points are distinct populations. To examine functional co-localization of Na+ channels and KATP channels at a subcellular level, we next performed duplex patch clamping after adenoviral delivery of Kir6.2-mEos. This intervention led to significantly larger KATP channel currents at both the lateral membranes and at the ICD. The corresponding INa patch current was significantly reduced at the ICD, but not at lateral membranes (Figure 4C). Thus, cardiac Na+ channels and KATP channels functionally interact predominantly at the ICD in cardiac myocytes.
Figure 4 with 2 supplements see all
Functional interaction between KATP channels and Na+ channels in cardiac myocytes occurs predominantly at the ICD.
(A) Illustration of the duplex patch clamp method, which allows sequential recordings of INa and IKATP in the same membrane patch. In cell-attached mode (left), INa is recorded by changing the membrane potential. Recordings can be made in the absence of IKATP, which is generally not active in resting cardiomyocytes. After patch excision (right), recordings of KATP channels are made at +80 mV, a voltage at which INa is inactivated. Representative patch recordings are illustrated. (B) Paired duplex patch clamp recordings of IKATP and INa are plotted as individual points for patches from the lateral membrane (filled symbols; n = 15) or the ICD region of cardiomyocytes (open symbols; n = 14). The dotted circles illustrate the result of an independent hierarchal clustering analysis of these data (Figure 4—figure supplement 2). Data were obtained using cells from three separate isolations. (C) Duplex patch clamping was performed with rat cardiomyocytes treated with Ad.mCherry or Ad.Kir6.2-mEos. The average IKATP or INa recorded from lateral membranes (n = 14 for Ad.mCherry and 11 for Ad.Kir6.2-mEos) or the ICD (n = 13 for Ad.mCherry and 10 for Ad.Kir6.2-mEos) are plotted as bar graphs. Data were obtained using cells from four separate isolations. *p=0.032 and p=0.027 respectively for left panel, p=0.031 for right panel vs. Ad-mCherry using the Student’s t test.
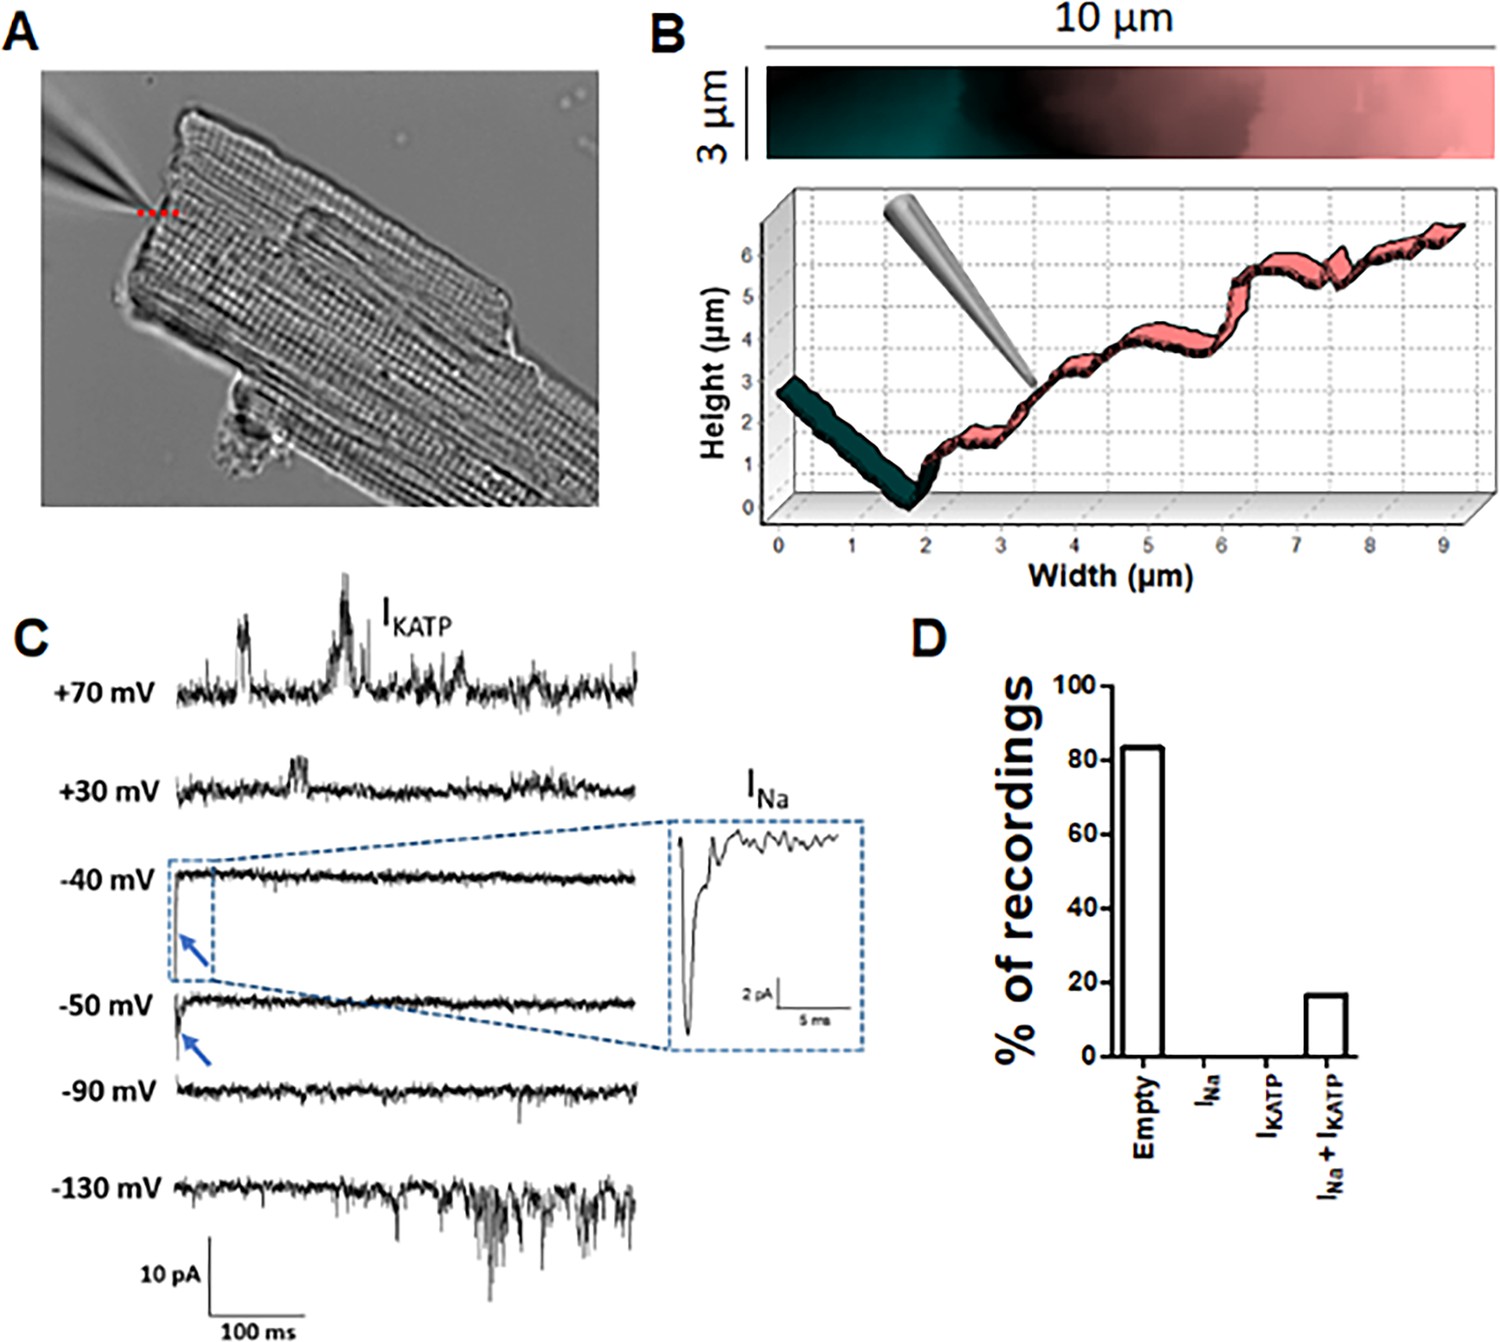
To investigate the functional co-localization of Na+ and KATP channels at the ICD with improved spatial resolution, we performed Angle SICM experiments with high resistance (~30 MΩ) patch pipettes. With this methodology, a topographical image of the ICD surface is produced before performing cell attached patch clamping at a selected position (Figure 5A and B). The Na+ channels were activated by voltage clamp steps from −120 mV, whereas KATP channels were simultaneously recorded by activating them with pinacidil included in the pipette solution. Similar to our previous report (Leo-Macias et al., 2016), around 80% of recordings from ICD did not show Na+ channels activity. Notably, the patches without INa also lacked KATP channels. However, the Angle SICM patches from the ICD that contained a cluster of Na+ channels also contained KATP channel activity (Figure 5C and D). Thus, these data further support the concept that Na+ channels and KATP channels are functionally co-localized at the ICD of cardiac myocytes.
Figure 5
Angle SICM recordings demonstrate functional co-localization of Na+ and KATP channels at the ICD of adult rat ventricular cardiomyocytes.
(A) Representative phase contrast image of a single cardiomyocyte. Recording pipette can be observed in the upper left. (B) Scan image acquired from location marked with red dashed line in A showing ICD region (top panel). Cross section showing the position of the pipette with respect the ICD (bottom). (C) Representative traces of the recorded current. Na+ channel currents can be observed at −40 mV and −50 mV steps (blue arrow and dashed box), KATP channel currents can be observed at +70 mV and −130 mV, when the Na+ channels are inactive. (D) Summary of cell-attached patch recordings. A total of 12 seals were recorded in which 10 of them did not show any channel activity at any voltage and 2 of them shown both Na+ and KATP channels activity.
KATP channels colocalize with AnkG but not AnkB at intercalated disc
In cardiomyocytes, AnkG localizes primarily, but not exclusively, to the ICD (Mohler et al., 2004; Lowe et al., 2008) and targets Nav1.5 to the ICD in cardiomyocytes (Mohler et al., 2004; Makara et al., 2014; Knezl et al., 2008). By contrast, AnkB is expressed mainly at lateral membranes where it localizes to Z- and M-lines in an isoform-dependent manner (Wu et al., 2015). Although Kir6.2 can interact with an AnkB-MBD construct (Kline et al., 2009), co-localization of AnkB and KATP channels has not been investigated in adult cardiomyocytes. Given the prominent role for the Kir6.2 ankyrin binding site in the functional interaction between KATP channels and Na+ channels, we next asked whether KATP channels co-localize with Ankyrins (AnkG or AnkB). Validation of anti-Nav1.5 and anti-Kir6.2 antibodies is shown in Figure 6—figure supplement 1. Immunofluorescence confocal microscopy of isolated rat cardiomyocytes and cardiac cryosections confirmed the presence of AnkB at lateral membranes, whereas expression of AnkG is enriched at (but not restricted to) the ICD (Figure 6—figure supplement 2). We found little evidence for co-localization of Kir6.2 with AnkB. By contrast, consistent with our previous report (Hong et al., 2012), we found that Kir6.2 co-localizes with AnkG, particularly at the ICD region of cardiac myocytes (Figure 6—figure supplement 2). We used STORM super-resolution microscopy to better analyze and quantify the co-localization of Nav1.5 and Kir6.2 with ankyrins. Figure 6 shows images of rat cardiomyocyte intercalated disc regions, co-stained with Kir6.2 and AnkB or AnkG, as well as Nav1.5 co-stained with AnkG. We quantified the distances between cluster edges of channels and ankyrins in the ICD region, which demonstrated a median clustering distance of 150 nm (interquartile range: 0–433 nm) between Nav1.5 and AnkG, which are well characterized to co-localize and interact at the ICD (Mohler et al., 2004; Makara et al., 2014; Knezl et al., 2008). The clustering distance between Kir6.2 and AnkG at the ICD was in the same range (median: 228 nm, interquartile range: 0–563 nm), whereas the clustering distance between Kir6.2 and AnkB was four times larger (median: 886 nm, interquartile range: 102–2205 nm). Thus, both Nav1.5 and Kir6.2 are strongly co-localized with AnkG, but not with AnkB, at the ICD of cardiac myocytes.
Figure 6 with 3 supplements see all
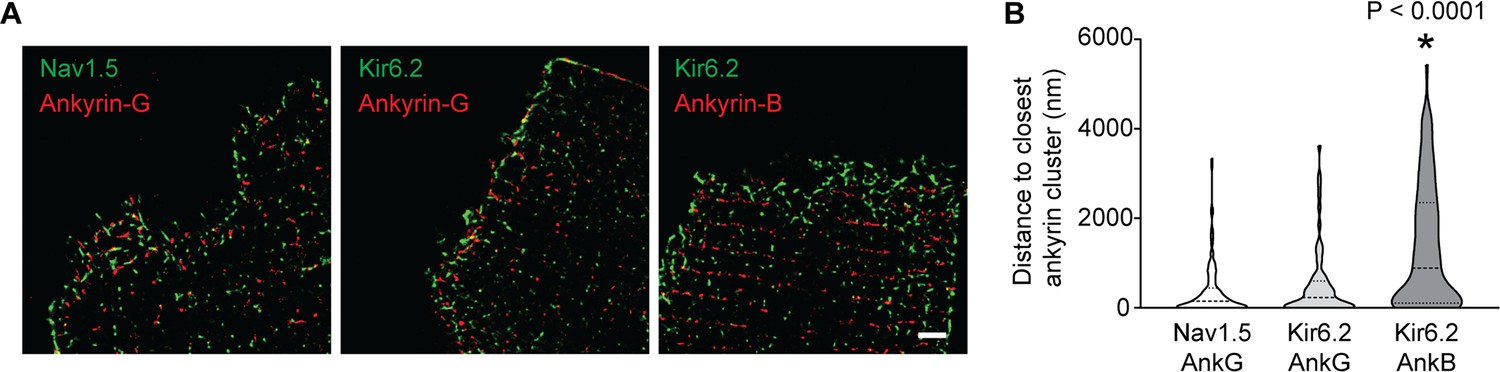
Quantification of inter-cluster distances between KATP channels, Na+ channels and ankyrins.
(A) Enlarged STORM images of the rat cardiomyocyte intercalated disc region, co-stained with antibodies against ankyrin B, ankyrin G, Kir6.2 and Nav1.5, as indicated. Scale bar, 2 μm. (B) Statistical analysis of the distances between Nav1.5 or Kir6.2 to the closest ankyrin clusters. N ≥ 67 clusters from three rats in each group. *p<0.0001 vs. Nav1.5/AnkG group determined by Kruskal-Wallis 1W ANOVA, followed by Dunn’s post-hoc analysis.
Ankyrin binding is necessary to localize Na+ and KATP channels to the ICD
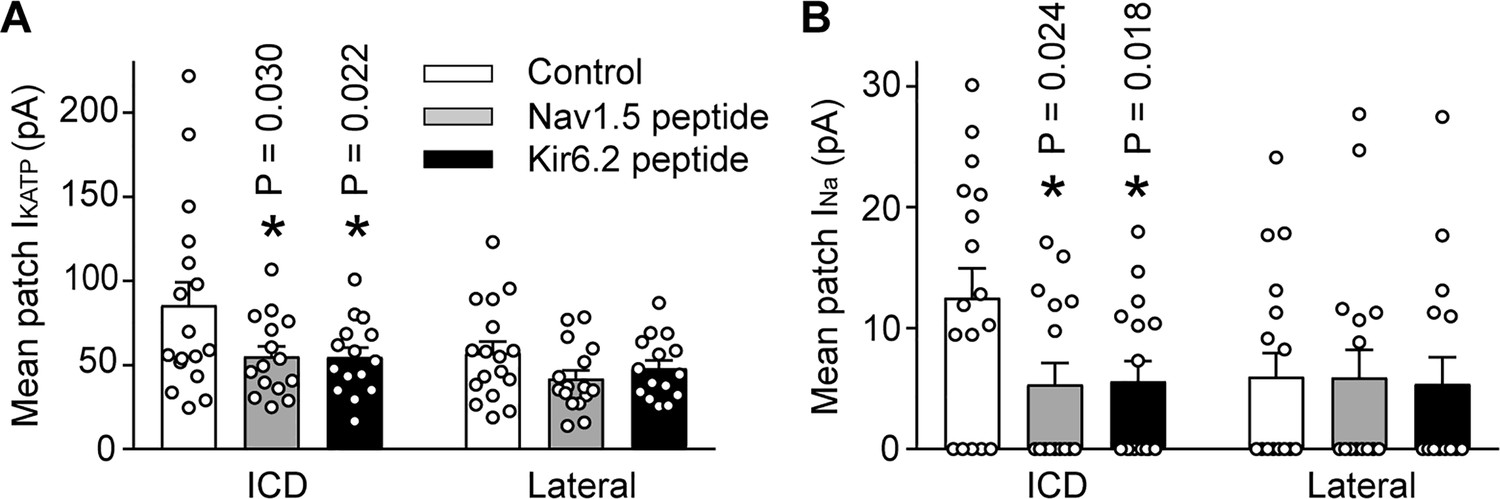
We next examined whether Ankyrin binding promotes trafficking of Na+ channels and KATP channels to the ICD of cardiac myocytes. To address this question, we used peptides corresponding to the Kir6.2 or Nav1.5 ankyrin binding sites to outcompete binding of the channels to ankyrins. The peptides were conjugated to an HIV Tat-derived peptide to enable delivery into cells (Schwarze et al., 1999; Chen et al., 2001). Rat cardiac myocytes were treated for 24 hr with TAT peptides and the INa and IKATP were measured using the duplex patch clamp technique, either at lateral membranes or at the ICD region. Averaged data are shown in Figure 7, which demonstrates that the INa and IKATP were larger at the ICD than at lateral membranes as expected. Peptides corresponding to the Nav1.5 ankyrin binding site caused a reduction of both INa and IKATP at the ICD, but not in lateral membranes. Similarly, peptides corresponding to the Kir6.2 ankyrin binding site caused targeting defects of both INa and IKATP at the ICD, but not in lateral membranes. These peptide experiments demonstrate that ankyrin binding regulates targeting of both Na+ channels and KATP channels to the ICD of cardiac myocytes.
Figure 7 with 1 supplement see all
The IKATP and INa at the ICD is preferentially reduced by peptides corresponding to the Nav1.5 or Kir6.2 ankyrin binding sites.
Rat ventricular cardiac myocytes were incubated for 24 hr with TAT-conjugated peptides corresponding to the ankyrin binding site of Nav1.5 (Nav1.5 peptide, 50 µM; n = 15 cells) or Kir6.2 (Kir6.2 peptide, 50 µM; n = 15 cells). Untreated cardiomyocytes were used as a control (n = 17 cells). Duplex patch clamping was performed to measure IKATP (A) and INa (B) paired recordings at lateral membranes or at the ICD. Shown are cumulative data obtained from cells isolated from four rats. *p=0.030 and p=0.022 respectively for panel A, p=0.024 and p=0.018 respectively for panel B vs. control determined by 1W ANOVA followed by Tukey’s test.
Clinical variants that causing KATP channel trafficking defects affect Nav1.5 surface expression
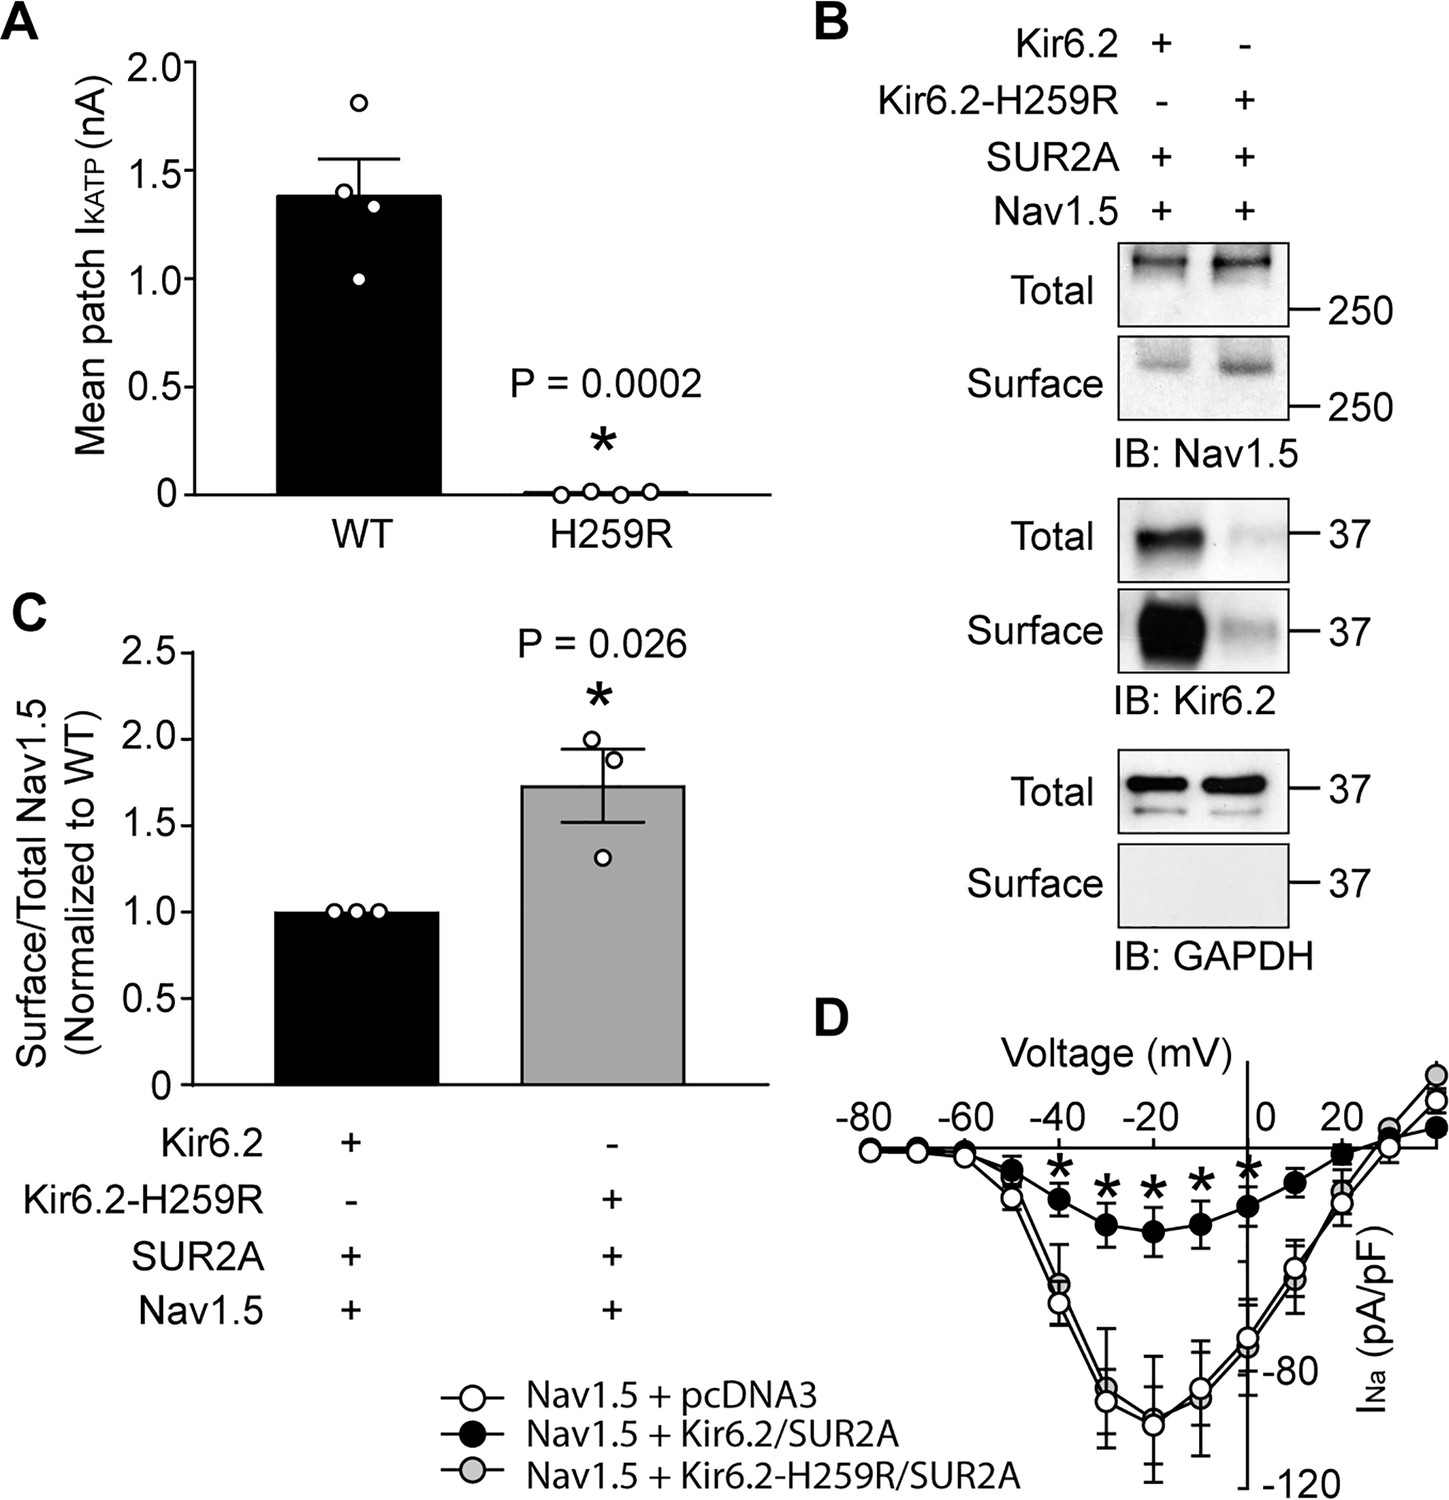
Variants in the genes encoding Kir6.2 and SUR1, KCNJ11 and ABCC8, are commonly associated with insulin secretion disorders and diabetes (Nichols, 2006) and many of these variants cause trafficking defects of KATP channels. For example, the missense NM_000525.3(KCNJ11):c.776A > G variant, which is rare in gnomAD and ExAC databases and is associated with severe congenital hyperinsulinism (ClinVar ID 8677), causes a p.His259Arg amino acid change in Kir6.2, and a severe trafficking defect (Yang et al., 2017; Marthinet et al., 2005). Given the functional interaction between KATP channels and Na+ channels, the question arose whether a clinically relevant KATP channel gene variant such as this would affect the cardiac Na+ channel. To answer this question, we co-expressed Nav1.5 with either wild-type Kir6.2 or Kir6.2-H259R in HEK293 cells. The Kir6.2-H259R channels neither expressed functional channels in patch clamp assays, nor were detected as surface proteins with biotinylation assays (Figure 8A and B), which is consistent with the trafficking defect previously reported (Marthinet et al., 2005). As before, the whole-cell Nav1.5 current was substantially reduced by co-expression with wild-type Kir6.2/SUR2A (compare Figures 1A and 8D). By contrast, co-expression with Kir6.2-H259R/SUR2A did not reduce the Nav1.5 currents relative to empty vector controls (~100 pA/pF at −20 mV; Figures 1A and 8D) and the surface abundance of Nav1.5 was significantly higher when co-expressed with Kir6.2-H259R compared to wild-type Kir6.2 (Figure 8C). Thus, variants that influence KATP channel surface expression may simultaneously affect Na+ channel surface expression and therefore have the potential to contribute to abnormalities in cardiac excitability and arrhythmias.
Figure 8 with 1 supplement see all
A clinically relevant Kir6.2 trafficking defective mutation (H259R) influences Nav1.5 surface expression.
(A) HEK-293 cells were transfected with Kir6.2/SUR2A or Kir6.2-H259R/SUR2A. The averaged KATP channel mean patch current, recorded in excised patches, are depicted as bar graphs, with WT-Kir6.2 and Kir6.2-H259R respectively depicted as black (n = 4 cells) or gray (n = 4 cells) bars. Data are from three transfections. *p=0.0002 using the Student’s t test. (B) Surface expression was determined by biotinylation assays with cell lysates from HEK293 cells transfected with combinations of Nav1.5, Kir6.2, Kir6.2-H259R, and/or SUR2A. Shown is a representative immunoblot of cell lysates (total) or biotinylated membrane fractions (surface) probed with antibodies as indicated. (C) Summary data (n = 3) of the normalized ratio of surface/total Nav1.5 protein in cells transfected with cDNAs as indicated. *p=0.026 using the Student’s t test. (D) Average current-voltage relationships of whole cell currents in HEK293 cells transfected with Nav1.5 plus empty vector (n = 7), Kir6.2/SUR2A (n = 7) or Kir6.2-H259R/SUR2A (n = 7). Data are from three transfections. *p<0.05 determined by two-way ANOVA followed by Tukey’s test.
Discussion
Our data demonstrate that Na+ channels and KATP channels are functionally coupled, both in heterologous expression systems and in cardiac myocytes. Ankyrin binding appears to underlie functional coupling since it can be disrupted by mutations in the Kir6.2 ankyrin binding site. In cardiomyocytes, Na+ channels and KATP channels co-localize both functionally, demonstrated by duplex patch clamping, and morphologically, specifically at the ICD. We found AnkG, but not AnkB, to be expressed at the ICD. Quantitative super-resolution microscopy shows similar clustering distances between AnkG and Na+ channels or KATP channels at the ICD. Competition experiments with peptides corresponding to Nav1.5 and Kir6.2 ankyrin binding sites dysregulate targeting of both Na+ channels and KATP channels to the ICD, but not to lateral membranes. Finally, we demonstrate that a clinically relevant gene variant that affect KATP channel trafficking also affects Na+ channel surface expression.
Targeting of ion channels to discrete subcellular compartments
Many ion channels are compartmentalized within cells. For example, in the highly polarized kidney epithelial cell, channels and transporters can either target to the basolateral or apical membranes (Stoops and Caplan, 2014). In cardiac myocytes, ion channels and transporters are also targeted to specific subcellular compartments for optimal cellular function. The L-type Ca2+ channel (LTCC), for example, is targeted to couplons adjacent to ryanodine receptors to allow for efficient excitation-contraction. Ion channels and transporters are often targeted to caveolae and lipid rafts. Caveolae are generally thought to be present at the mouth of t-tubules and/or the crests between t-tubules and may contain ion channels such as a specific population of LTCCs, Hyperpolarization activated cyclic nucleotide gated potassium channel 4 (HCN4), Kv1.5 and Na+/Ca2+ exchanger (Best and Kamp, 2012; Hong and Shaw, 2017). Caveolae are also enriched with components of molecular signaling pathways, such as β-adrenergic receptors, culminating in local regulation of ion channels. A number of ion channels are targeted to the ICD membrane structure that couple neighboring cardiac myocytes. The Na+ channel was one of the first described to be enriched at the ICD (Cohen and Levitt, 1993). Examples of other channels enriched at the ICD of cardiac myocytes include Kv1.5 (Mays et al., 1995) and the inward rectifying K+ channel subunits, Kir2.1 and Kir2.3 (Melnyk et al., 2002). In our studies, we found an enrichment of KATP channels at the ICD regions of ventricular myocytes, where they co-localize with desmosomal proteins such as PKP2 (Hong et al., 2012). The targeting mechanisms for Na+ channels to the ICD are best understood, and involve forwarding trafficking and anchoring mechanisms that are coordinated by EB1, SAP97, PKP2 and AnkG (Shy et al., 2013; Agullo-Pascual et al., 2014; Gillet et al., 2014; Chen-Izu et al., 2015). Mechanisms responsible for targeting KATP channels to the ICD have not been described.
A role for ankyrin G in targeting channels to the ICD
Ankyrins are cytoskeletal proteins that associate with spectrin-actin networks and bind to integral membrane proteins, thus serving as a sub-membrane scaffold for coordinating the targeting of membrane proteins. Axonal voltage-gated Na+ channels, such as Nav1.6, has long been recognized to be targeted by AnkG (Jenkins and Bennett, 2001). Other ion translocators that are linked to the spectrin-based membrane skeleton by ankyrins include the anion exchanger, the Na+/Ca2+ exchanger, and the Na+/K+ ATPase (Bennett and Baines, 2001). A missense variant in SCN5A (the gene coding for Nav1.5), associated with Brugada syndrome, which causes an amino acid substitution (E1053K) in the Nav1.5 ankyrin-binding domain, has led to the identification of a key role for AnkG in targeting Na+ channels to the ICD of cardiac myocytes (Mohler et al., 2004). Subsequent studies have shown that Na+ channels are targeted to subcellular domains at the ICD that contain desmosomal proteins and N-cadherin (Leo-Macias et al., 2016; Cerrone and Delmar, 2014). KATP channels are also enriched at the ICD and target to contain desmosomal proteins (Hong et al., 2012). Several observations from our current study suggest that AnkG plays a key role in KATP channel targeting to this region. First, the functional interaction that exists between Na+ channels and KATP channels can be prevented by specific amino acid substitutions within the ankyrin binding domain of Kir6.2. Second, the quantitative STORM measurements show similar intermolecular distances between AnkG and Na+ channels or KATP channels. Third, duplex patch clamping shows functional co-localization in all patches obtained at the ICD between Na+ channels and KATP channels. Fourth, conventional fluorescence microscopy shows a remarkable degree of overlap between Nav1.5 and Kir6.2 staining at the ICD regions of cardiomyocytes. Fifth, competition experiments with peptides corresponding to Ankyrin binding motifs disrupt both Na+ channel and KATP channel expression at the ICD, demonstrating a clear role for ankyrins. Finally, consistent with the literature, we find strong expression of AnkG, but not AnkB, at the ICD. Collectively, we interpret these data as evidence that AnkG mediates targeting of both Na+ channels and KATP channels to the ICD.
Although we have observed the AnkG competition mechanism to regulate the surface expression of Nav1.5 and KATP channels in both HEK293 cells and cardiomyocytes, a previous study has reported that the ankyrin binding deficient Nav1.5 E1053K efficiently transports to the membrane in HEK293 cells, but not in rat ventricular cardiomyocytes (Mohler et al., 2004). In the latter study, cells were co-transfected with the Nav-beta subunit, which was previously shown also to interact with AnkG (Malhotra et al., 2002). Thus, an additional role for Nav-beta subunits to regulate the AnkG/Nav1.5/KATP complex is a real but unexplored possibility.
Both Na+ and KATP channels are enriched at the ICD of a cardiac myocyte (Hong et al., 2012; Lin et al., 2011). Previous data suggest that AnkG and Gap junction alpha-1 protein (Cx43) are necessary to preserve the Na+current amplitude, electrical coupling and intercellular adhesion strength (Sato et al., 2011). Since the KATP channel, Na+ channel and AnkG interaction can be demonstrated in HEK-293 cells, which do not express Cx43, we believe that our data demonstrate that Cx43 is not a necessary component for functional interaction. However, we have not investigated this in cardiomyocytes. With immunofluorescence, we found that Nav1.5 and Kir6.2 are spatially localized closer to each other at the ICD compared to the lateral membrane (Figure 6—figure supplement 3). However, we do not think that Na+ channels directly interact with KATP channels. Our STORM imaging data show that the median intermolecular clustering distance from Nav1.5 to closest Kir6.2 at the ICD region is 528 nm (Figure 6—figure supplement 3), which is greater than expected for direct molecular interactions. The distributions of the cluster area of Nav1.5 and Kir6.2 channel subunits can be well fitted with single exponential function (Figure 6—figure supplement 3), indicating a stochastic self-assembly process in the formation of Nav1.5 and Kir6.2 clusters, which later become attached to AnkG in the ICD, as in the case of cardiac Cav1.2 directed by BIN1 (Sato et al., 2019). This observation suggests a model in which Na+ channels and KATP channels bind to closely spaced AnkG proteins. The suppression of Na+ channel surface density by KATP channel overexpression (and vice versa), which can be disrupted by mutagenesis of the Kir6.2 ankyrin binding motif, most likely results from competition of these two channels for the AnkG proteins. Several different proteins, including Nav channels, the Na+/Ca2+ exchanger, the Na+/K+ ATPase, IP3 receptors, KCNQ channels, and Kv3.1 channels all bind to ankyrins, but each protein class has a very different ankyrin binding site, which is evolutionarily highly conserved within the class (Bennett and Healy, 2009). The high sequence similarity of the ankyrin binding motifs of Kir6.2 and Nav1.5 (Figure 3A) is therefore somewhat surprising, but it is easy to visualize how these similar sequences can both bind to AnkG. More surprising, however, is that the corresponding sequence within Kir6.1 is almost identical, but neither supports ankyrin binding (Li et al., 2010), nor confers the ability to interact with Nav1.5 (Figure 3B). Future structural studies would be very helpful to determine the nature and specificity of the binding sites to AnkB and/or AnkG.
Targeting of KATP channels to lateral membranes
This study was not designed to study targeting to lateral membranes in cardiomyocytes, yet some of our findings are relevant. KATP channels interact with AnkB in vitro (Li et al., 2010), and AnkB is expressed mainly at lateral membranes at Z- and M-lines (Wu et al., 2015). In support, when overexpressed in HEK293 cells, we found that Kir6.2 can interact both with AnkB and AnkG (Figure 7—figure supplement 1). We therefore fully expected a role for AnkB to target KATP channels to lateral membranes. However, the peptide competition experiments question whether Kir6.2/AnkB interaction occurs natively. Peptides corresponding to ankyrin binding sites of Nav1.5 and Kir6.2 had identical effects to displace both Na+ channels and KATP channels from the ICD, demonstrating that the peptides were functional. However, the peptides did not influence these two channels at lateral membranes. Data with the duplex patch clamp technique suggest that (at least some of the) Na+ channels and KATP channels may be differently trafficked to the lateral membrane. Within the spatial dimension of duplex patch clamping, about half of the patches contained Na+ channels at the lateral membrane, whereas KATP channels were present in every single patch. Differential trafficking of these two channels in lateral membranes is also suggested from high-resolution scanning ion conductance microscopy (SICM), which demonstrated that the majority of Na+ channels in lateral membranes are clustered in crests of mouse ventricular cardiomyocytes, with hardly any Na+ channels present in the grooves (Rivaud et al., 2017). Early recordings with this technique, combined with whole-cell voltage clamping, by contrast suggested that lateral KATP channels are present as submicrometer clusters in Z-grooves of the sarcolemma (Korchev et al., 2000). The finding is in support of the presence of KATP channels in caveolae (Yang et al., 2018), which are often found at t-tubular structures (Hong and Shaw, 2017). Nevertheless, our duplex patch clamp data demonstrated functional co-localization of Na+ channels an KATP channels in about half of the patches and future studies should be directed at identification of the targeting mechanisms of these co-localized channels.
What might be the physiological relevance and pathophysiological implications?
It is not clear what the role of KATP channels at the ICD might be, and why they are functionally coupled to Na+ channels. We have not examined action potential characteristics, since we believe that these local changes may not reflect global electrophysiological properties of the cell. Rather, we emphasize that our findings support the growing body of evidence that cardiac ion channels do not travel and organize as lone entities, but as complexes. Our data are fully supported by recent studies, such as the finding of co-translational 'microtranslatomes' that contain both K+ channels and Na+ channels (Eichel et al., 2019), and findings that K+ and Na+ channels can co-traffic in cardiac cells (Ponce-Balbuena et al., 2018). Given its small size (nanometers in scale) and convoluted nature, the ICD cleft space is severely diffusion restricted. Therefore, with repetitive electrical activity, Na+ entering the cell via Na+ channels may cause local intracellular Na+ accumulation and Na+ depletion in the ICD cleft, which is counteracted by ATP-driven Na+ extrusion via the Na+/K+ pump in exchange for K+ influx. This, in turn, may lead to K+ depletion in the ICD cleft space. A K+ flux coupling mechanism must exist to maintain homeostasis. In addition to their functional coupling to Na+ channels (this study), KATP channels and the Na+/K+ pump are also functionally coupled, such that an increased Na+/K+ pump activity activates KATP channels (Priebe et al., 1996), which is thought to occur because of local sub-membrane ATP depletion (and ADP accumulation). We propose therefore that at high heart rates, the elevated Na+/K+ pump activity may locally activate the ICD KATP channels in order to balance K+ fluxes and maintain the ionic hemostasis in the ICD cleft (Figure 8—figure supplement 1). From genetic studies, the overwhelmingly predominant clinical phenotype of KCNJ11 (Kir6.2) variants is insulin secreting disorders. Arrhythmias may well be a secondary and understudied phenotype. We know from pharmacological studies (with both humans and animals) that cardiac arrhythmias are a very real phenomenon associated with KATP channel openers and blockers (Foster and Coetzee, 2016). In the model proposed, a relationship between KATP channel activation and cardiac conduction is predicted, which is evident from the literature. For example, while studying KATP channels in the cardiac specialized conduction system, we have observed that conduction slowing in ischemic Langendorff-perfused mouse hearts was essentially prevented by the KATP channel blocker glibenclamide (Bao et al., 2011). This finding was in keeping with the literature that glibenclamide decreases conduction delays during ischemia in open-chest dogs (Bekheit et al., 1990), prevents the beneficial effect of IPC on electrical uncoupling during ischemia (Tan et al., 1993), and prevents asymmetric conduction slowing during acute ischemia in canine interventricular septum (Morita et al., 2008). Our data additionally demonstrate another level of pathophysiological relevance. We found that genetic variants associated with insulin disorders that cause KATP channel trafficking defects may also affect Na+ channel surface expression. These suggest that there may be implications for heart disease and conduction disorders in diabetic patients with KATP channel trafficking mutations. Conversely, genetic defects resulting in Na+ channel trafficking alterations have the potential to affect KATP channel surface expression, and therefore the susceptibility of patients with inherited forms of arrhythmias to ischemia/reperfusion injury. These possible relationships need to be explored in future studies given the clinical relevance and therapeutic potential of our findings.
Study limitations
At present, the physiological or pathophysiological implications of the functional interactions between Na+ and KATP channels are unknown. Human iPSC-derived cardiomyocytes are a poor substitute to study this question since these cells have an immature electrophysiology phenotype with little KATP channel expression. These cells also lack fully developed intercalated disks. These limitations are shared by other cardiac cellular models, such as HL-1 cells and cultured primary neonatal cardiac myocytes. An in vivo model with disrupted AnkG/Nav1.5/KATP interaction would be ideal to address effects in cardiomyopathies or in clinically relevant arrhythmias. Unfortunately no such model is currently available. Such an in vivo model would also be able to address the question of whether disrupted AnkG/Nav1.5/KATP interaction affects the ICD structure. We deem this to be unlikely, though, given that patients with mutations in the Nav1.5 AnkG binding domain (and disrupted trafficking of Nav1.5 to the ICD) develop arrhythmias (Brugada syndrome) but not cardiomyopathies (Mohler et al., 2004), which would be expected to occur if structural disorder of the ICD occurred.
Materials and methods
Key resources table
| Reagent type (species) or resource | Designation | Source or reference | Identifiers | Additional information |
|---|---|---|---|---|
| Cell line (Homo-sapiens) | HEK293 | ATCC | Cat# CRL-1573, RRID:CVCL_0045 | Mycoplasma contamination negative |
| Recombinant DNA reagent | Nav1.5 | Tan et al., 2018 | ||
| Recombinant DNA reagent | Kir6.2 | Yang et al., 2018 | ||
| Recombinant DNA reagent | Kir6.2-myc | Yang et al., 2018 | ||
| Recombinant DNA reagent | Avi-Kir6.2-myc | Yang et al., 2018 | ||
| Recombinant DNA reagent | Kir6.2-KKK | This paper | Genscript | |
| Recombinant DNA reagent | Kir6.2-H259R | This paper | Genscript | |
| Recombinant DNA reagent | Kir6.1 | This paper | Genscript | |
| Recombinant DNA reagent | Kir6.2-AAA | Tong et al., 2006 | ||
| Recombinant DNA reagent | SUR2A | Yang et al., 2018 | ||
| Recombinant DNA reagent | Ankyrin-B | Addgene | RRID:Addgene_31057 | |
| Recombinant DNA reagent | Ankyrin-G | Addgene | RRID:Addgene_31059 | |
| Transfected construct | Adenovirus mCherry | This paper | Vector Biolabs | |
| Transfected construct (human) | Adenovirus Kir6.2-mEos3.2 | This paper | Vector Biolabs | |
| Peptide, recombinant protein | Kir6.2 ankyrin binding motif | Genscript | VPIVAEEDGGGGGRKKRRQRRRPQ | |
| Peptide, recombinant protein | Nav1.5 ankyrin binding motif | Genscript | VPIAVAESDGGGGGRKKRRQRRRPQ | |
| Antibody | Anti-Nav1.5 (Mouse monoclonal) | Sigma Aldrich | Cat# S8809, RRID:AB_477552 | WB (1:2000) |
| Antibody | Anti-Nav1.5 (Rabbit polyclonal) | Sigma Aldrich | Cat# S0819, RRID:AB_261927 | IF(1:200), STORM (1:50) |
| Antibody | Anti-Kir6.2 (Goat polyclonal) | Santa Cruz | Cat# sc-11226, RRID:AB_2130475 | WB (1:500) |
| Antibody | Anti-Kir6.2 (Chicken polyclonal) | Hong et al., 2012 | C62 | IF(1:50), STORM (1:50) |
| Antibody | Anti-Kir6.2 (Rabbit polyclonal) | Hong et al., 2012 | Lee62 | STORM (1:50) |
| Antibody | Anti-AnkyrinG (Mouse monoclonal) | Neuromab | Cat# N106/20, RRID:AB_2750699 | IF(1:500), STORM (1:50), WB (1:2000) |
| Antibody | Anti-AnkyrinB (Mouse monoclonal) | Neuromab | N105/17 | IF(1:500), STORM (1:50), WB (1:2000) |
| Antibody | Anti-myc (Mouse monoclonal) | Sigma Aldrich | 9E10 | WB (1:6000) |
| Antibody | Anti-GAPDH (Mouse monoclonal) | Sigma Aldrich | Cat# G8795, RRID:AB_1078991 | WB (1:20000) |
| Antibody | Anti-caveolin3 (Mouse monoclonal) | Transduction Laboratories | C38320 | WB (1:50000) |
| Antibody | donkey anti-mouse-HRP | Jackson ImmunoResearch | Cat# 715-035-150, RRID:AB_2340770 | WB (1:10000) |
| Antibody | donkey anti-goat-HRP | Jackson ImmunoResearch | Cat# 705-035-147, RRID:AB_2313587 | WB (1:10000) |
| Antibody | goat anti-chicken Alexa Fluor568 | Thermo Scientific | Cat# A-11041, RRID:AB_2534098 | IF(1:200) |
| Antibody | donkey anti-rabbit Alexa Fluor488 | Jackson ImmunoResearch | Cat# 711-545-152, RRID:AB_2313584 | IF(1:200) |
| Antibody | donkey anti-mouse Cy3 | Jackson ImmunoResearch | Cat# 715-165-151, RRID:AB_2315777 | IF(1:200) |
| Software, algorithm | GraphPad Prism | GraphPad Prism | RRID:SCR_002798 |
cDNA constructs and mutagenesis
Request a detailed protocolWild-type Nav1.5, Kir6.2, SUR2A constructs, Kir6.2-AAA, Kir6.2-myc and Avi-Kir6.2 cDNAs were previously used (Tong et al., 2006; Yang et al., 2018; Tan et al., 2018). Kir6.1, Kir6.2-KKK and Kir6.2-H259R were synthesized by Genscript. Ankyrin-G (#31059) and ankyrin-B (#31057) constructs were from AddGene.
Cell culture and transfection
Request a detailed protocolHEK-293 cells (ATCC CRL-1573), negative in mycoplasma contamination test, were cultured in EMEM with 10% fetal bovine serum. Lipofectamine 2000 (ThermoFisher, Waltham, MA) was used to transfect ankyrins, Nav1.5 and KATP channel subunit cDNAs. When cells were transfected with multiple cDNAs, the empty vector (pcDNA3) was included to keep the total cDNA amount equal in transfection reactions. Nav1.5 and KATP channels were co-transfected with the cDNA amount ratio of Nav1.5:Kir6.2:SUR2A to be 10:1:9. Rat ventricular cardiomyocytes were enzymatically isolated as previously described (Hong et al., 2011). All procedures conformed to the Guide for Care and Use of Laboratory Animals of the National Institutes of Health and were approved by the NYU IACUC committee (protocol s17-00352). Cells were plated on laminin-coated coverslips and cultured in EMEM. Adenovirus carrying mEos3.2 labeled Kir6.2 (Vector Biolabs, Malvern, PA, USA) were added at an MOI of 1000 for 12 hr incubation. An mCherry expressing adenovirus was used as control. Cultured cardiomyocytes were used for experiments 72 hr post-infection. Peptides corresponding to the ankyrin binding sites of Kir6.2 (VPIVAEEDGGGGGRKKRRQRRRPQ) or Nav1.5 (VPIAVAESDGGGGGRKKRRQRRRPQ) were synthesized by Genscript, and incubated cardiomyocytes for 24 hr before patch clamp.
Patch clamp electrophysiology
Request a detailed protocolStandard patch-clamping was performed using an Axopatch-200B amplifier and recording data with a Digidata 1550A and Clampex 10 software. For inside-out KATP current recordings, the pipette resistance was 3 ~ 4 MΩ when filled with pipette solution consisting of (in mM): 110 potassium gluconate, 30 KCl, 2 CaCl2, 1 MgCl2, 10 HEPES, and pH 7.4. The bath solution consisted of (in mM): 110 potassium gluconate, 30 KCl, 1 EGTA, 1 MgCl2, 10 HEPES, and pH 7.2. Following patch excision, the pipette potential was held at +80 mV and current was digitized at 1 kHz. Currents were recorded immediately after patch excision and recordings with any sign of rundown were discarded. The ‘cytosolic’ ATP concentration was changed by a rapid solution changer (RSC160, BioLogic SAS, Seyssinet-Pariset, France). For whole-cell Nav1.5 current recordings in HEK293 cells, the pipette resistance was 2 ~ 3 MΩ when filled with pipette solution consisting of (in mM): 50 CsCl, 60 CsF, 10 TEA·Cl, 20 EGTA, 5 Na2ATP, 10 HEPES, and pH 7.2 with CsOH. The bath solution consisted of (in mM): 30 NaCl, 110 CsCl, 4 KCl, 1 CaCl2, 1 MgCl2, 10 HEPES, 5 Glucose and pH 7.35 with CsOH. NaCl in bath solution dropped to 5 mM and compensated by CsCl when recording in cardiomyocytes.
For duplex recording of Na+ and KATP current from the same patch in cardiomyocytes, the pipette resistance was ~2 MΩ when filled with pipette solution consisting of (in mM): 125 NaCl, 5.4 KCl, 10 TEA·Cl, 1 MgCl2, 0.33 NaH2PO4, 1 4-aminopyridine, 10 HEPES, and pH 7.35 with NaOH. The bath solution consisted of (in mM): 140 KCl, 0.33 NaH2PO4, 1 EGTA, 1 MgCl2, 10 HEPES and pH 7.2 with KOH. Nav1.5 current was first measured by a voltage step protocol with P/N substraction in cell-attached mode, Nav1.5 channel was activated by depolarizations from −100 mV to voltages between −80 mV to +80 mV, then membrane under the pipette tip was excised and KATP current was measured with rapid ATP perfusion in inside-out mode with holding potential of +80 mV.
Electrophysiological recordings with angle SICM
Request a detailed protocolScanning ion conductance microscopy (SICM) is a non-contact scanning probe microscopy technique based on the principle that the flow of ions through the tip of a nanopipette filled with electrolytes decreases when the pipette approaches the surface of the sample (Hansma et al., 1989; Korchev et al., 1997a; Korchev et al., 1997b). In this study, we used a variant of SICM called angular approach scanning ion conductance microscopy described in detail by Shevchuk et al. (2016). The system was used in the same configuration as Leo-Macias et al. (2016). Briefly, the scanning probe was mounted in a PatchStar micromanipulator (Scientifica, UK) that allows to adjust the angle for the scanning, selected as 33° in this work for the purpose of scanning the ICD of adult cardiomyocytes with nanoscale resolution. Borosilicate glass nanopipettes pulled from 1.0 mm outer diameter, 0.4 mm ID capillary were used in all experiments. Axopatch 200B patch clamp amplifier (Axon Instruments; Molecular Devices) was used to measure the pipette current as well as to record ion channel activity. Cell-attached currents were digitized using Digidata 1440A and a pClamp 10 data acquisition system (Axon Instruments; Molecular Devices).
After the ICD region was recognized by the scanning, the pipette was moved to the area of sealing, the feedback of the hoping mode was switched off and a gigaseal was formed by lowering the pipette until it makes contact with the surface of the ICD. Cell-attached patch-clamp configuration was then used to record of Na+ and KATP channels simultaneously. Recordings were performed at room temperature using the following solutions; external solution containing (in mM): 145 KCl; 1 MgCl2; 1 CaCl2; 2 EGTA; 10 glucose; 10 HEPES; and pH 7.4 with KOH; internal recording solution containing (in mM): 135 NaCl; 0.4 NaH2PO4; 1 MgCl2; 5.4 KCl; 1 CaCl2; 5.5 glucose; 5 HEPES; 20 TEA-Cl; 0.2 CdCl2; 10 CsCl; 10, 4-AP; and pH 7.4 with NaOH. Pinacidil was added to both solutions at a concentration of 200 µM to activate KATP channels. The pipette used for cell-attached recordings had an average resistance of ~30 MΩ. To generate a current–voltage (I–V) relationship that allow the simultaneous recording of Na+ and KATP channels, the membrane under the patch was held at a voltage of −120 mV and incremental steps of 10 mV were applied from −100 to +90 mV. Data were low-pass filtered at 1 kHz using the built-in Bessel filter of the amplifier and sampled at 20 kHz.
Biotinylation assay
Request a detailed protocolHEK293 cells expressing Nav1.5 and Avi-Kir6.2-myc were incubated with 0.33 mM biotin for 1 hr at 4°C. After washing with PBS, cells were homogenized in RIPA buffer. Equal amount of biotinylated proteins was incubated with Neutravidin agarose beads (Thermo Scientific) at 4°C overnight. The supernatants were discarded and biotinylated proteins were eluted by a mixture of loading buffer and 200 mM DTT. Western blots were quantified by ImageJ.
Membrane fractionation
Request a detailed protocolFlash-frozen hearts were ground to a fine powder in liquid nitrogen using a pestle and mortar. Samples were homogenized on ice with 30 strokes of a glass-glass homogenizer, followed by 30 strokes in a Dounce homogenizer in (in mM) 250 sucrose, 1 EDTA, 10 HEPES, 1 DTT and pH 7.4 supplemented with protease inhibitor cocktail (Roche Applied Science). Following brief centrifugation (1000 g for 5 min at 4°C), the pellet was re-homogenized in fresh homogenization buffer with 25 strokes of a tight-fitting Dounce and cleared by brief centrifugation (1000 g, 5 min, 4°C). The resulting supernatant was combined with that of the previous step. The supernatant was centrifuged at 50,000 rpm using a 90 Ti rotor (Beckman Coulter, Brea, CA) for 1 hr at 4°C. The resulting membrane pellets were solubilized with rotation overnight at 4°C in 20 mM HEPES, 0.5% Triton X100, pH 7.4.
Immunocytochemistry and immunohistochemistry
Request a detailed protocolAs previously described (Yang et al., 2018), isolated rat cardiomyocytes or rat heart slices were fixed with 4% paraformaldehyde. Cells or tissue were permeabilized with 0.1% Triton X-100 and blocked with 5% donkey serum in PBS. Primary and secondary antibodies buffered in blocking solution were sequentially applied. After washing and mounting, images were obtained by Zeiss 700 confocal microscope (Zeiss, Jena, Germany).
Stochastic optical reconstruction microscopy (STORM)
Request a detailed protocolFreshly isolated rat cardiomyocytes were plated on laminin-coated coverslips for 1 hr before fixation with 4% paraformaldehyde. Cells were then permeabilized with 0.1% Triton in PBS for 10 min, and incubated in blocking solution (PBS based 2% Glycine, 2% BSA and 0.2% Gelatin) for 30 min. Primary antibodies diluted 1:50 in blocking solution incubated the cells for 1 hr at room temperature. After three washes with PBS, secondary antibodies against a combination of mouse conjugated with Alexa Fluor 647 and rabbit conjugated with Alexa Fluor 568 or a combination of rabbit conjugated with Alexa Fluor 647 and chicken conjugated with Alexa Fluor 568 (1:10000, Invitrogen) were incubated for 15 min at room temperature. Imaging conditions were achieved by addition of 200 mmol/L mercaptoethylamine and an oxygen scavenging system (0.4 mg/ml glucose oxidase, 0.8 µg/mL catalase and 10% (wt/wt) glucose) to the fluorophore-containing sample.
As previously described (Kim et al., 2019), samples were imaged using a custom-built platform based on an inverse microscopy setup (Leica DMI3000). Sample emission was split into two channels through proper dichroic and emission narrow-band bandpass filters (green channel 580/60, red channel 680/40, Semrock), in conjunction with a Dual View (DV2-Photometrics) to image two colors simultaneously, onto a single EM-CCD camera (Andor iXon+ 897). For accurate alignment and mapping of the two color channels, we first imaged diffraction-limited fluorescent beads that have a wide emission spectra spanning both channels (Invitrogen). The location of the beads was matched for both channels based on the use of a polynomial morph-type mapping function, whereby mapping coefficients are generated by Gaussian and centroid fits to the sub-diffraction limit point-spread functions of the fluorescence beads. The two-color image was reconstructed at 20 nm/pixel using the following QuickPALM parameters, FWHM = 4 and S/N = 2.00. The reconstructed super-resolved images of each channel were then super-imposed to generate a two color super-resolved image. The mapping error in the super-resolved image was 20 nm. ROIs of intercalated disc were manually drawn for each reconstructed super-resolution images and further cluster detection were obtained using ImageJ and cluster distance analysis accomplished by a home-built Python script that utilized the image processing packages scikit-image (van der Walt et al., 2014), and ‘Mahotas,’ an open source software for scriptable computer vision (http://dx.doi.org/10.5334/jors.ac). Please refer to our previous studies (Agullo-Pascual et al., 2013) for extensive methodological details of our custom-developed analysis pipeline, its technical specifications and limitations, as well as specifics of its resolution both in the X-Y and in the Z planes.
Antibodies
Primary antibodies used were: mouse anti-GAPDH (G8795, Sigma-Aldrich; 1:10000 for western blot), mouse anti-c-Myc (M4439, Sigma-Aldrich; 1:6000 for western blot), mouse anti-Nav1.5 (S8809, Sigma-Aldrich; 1:2000 for western blot), rabbit anti-Nav1.5 (S0819, Sigma-Aldrich; 1:200 for immunostaining, 1:50 for STORM), chicken anti-Kir6.2 (C62; 1:50 for immunostaining and STORM), rabbit anti-Kir6.2 (Lee62; 1:50 for STORM), goat anti-Kir6.2 (N18, Santa Cruz; 1:500 for western blot), mouse anti-ankyrin-B (105/17, Neuromab; 1:2000 for western blot, 1:50 for STORM) and mouse anti-ankyrin-G (106/20, Neuromab; 1:2000 for western, 1:50 for STORM). Secondary antibodies used were donkey anti-mouse-HRP (715-035-150, Jackson, 1:10000), donkey anti-goat-HRP (705-035-147, Jackson, 1:10000), goat anti-chicken Alexa Fluor568 (A-11041, Thermo Scientific; 1:200), donkey anti-rabbit Alexa Fluor488 (711-545-152, Jackson; 1:200), and donkey anti-mouse Cy3 (715-165-151, Jackson; 1:200). All antibodies used in this study have been fully validated, either experimentally or in the literature. Details can be found in Figure 6—figure supplement 1 and Supplementary file 1.
Statistical analysis
Request a detailed protocolThe sample size was determined using power analysis. The number of biological replicates are indicated in the figure legends. Single random sampling was used for all experiments. When comparing two groups, we used the Student’s t-test. A one-way or two-way ANOVA was used for comparison of multiple groups, followed by the Tukey's post-hoc analysis for comparisons to a single control. A value of p<0.05 was considered significant.
Data availability
All data generated or analysed during this study are included in the manuscript and supporting files.
References
-
Unique properties of the ATP-sensitive K⁺ channel in the mouse ventricular cardiac conduction systemCirculation. Arrhythmia and Electrophysiology 4:926–935.https://doi.org/10.1161/CIRCEP.111.964643
-
Membrane domains based on ankyrin and spectrin associated with cell-cell interactionsCold Spring Harbor Perspectives in Biology 1:a003012.https://doi.org/10.1101/cshperspect.a003012
-
Different subcellular populations of L-type Ca2+ channels exhibit unique regulation and functional roles in cardiomyocytesJournal of Molecular and Cellular Cardiology 52:376–387.https://doi.org/10.1016/j.yjmcc.2011.08.014
-
Desmosomes and the sodium channel complex: implications for arrhythmogenic cardiomyopathy and brugada syndromeTrends in Cardiovascular Medicine 24:184–190.https://doi.org/10.1016/j.tcm.2014.02.001
-
Na+ channel function, regulation, structure, trafficking and sequestrationThe Journal of Physiology 593:1347–1360.https://doi.org/10.1113/jphysiol.2014.281428
-
KATP channels in the cardiovascular systemPhysiological Reviews 96:177–252.https://doi.org/10.1152/physrev.00003.2015
-
Elucidating sodium channel NaV1.5 clustering in cardiac myocytes using super-resolution techniquesCardiovascular Research 104:231–233.https://doi.org/10.1093/cvr/cvu221
-
Cardiac ATP-sensitive K+ channel associates with the glycolytic enzyme complexFASEB Journal : Official Publication of the Federation of American Societies for Experimental Biology 25:2456–2467.https://doi.org/10.1096/fj.10-176669
-
Heterogeneity of ATP-sensitive K+ channels in cardiac myocytes: enrichment at the intercalated diskThe Journal of Biological Chemistry 287:41258–41267.https://doi.org/10.1074/jbc.M112.412122
-
Cardiac T-Tubule microanatomy and functionPhysiological Reviews 97:227–252.https://doi.org/10.1152/physrev.00037.2015
-
A β(IV)-spectrin/CaMKII signaling complex is essential for membrane excitability in miceJournal of Clinical Investigation 120:3508–3519.https://doi.org/10.1172/JCI43621
-
Distinct lethal arrhythmias susceptibility is associated with sex-related difference in myocardial connexin-43 expressionNeuro Endocrinology Letters 29:798–801.
-
Scanning ion conductance microscopy of living cellsBiophysical Journal 73:653–658.https://doi.org/10.1016/S0006-3495(97)78100-1
-
Functional localization of single active ion channels on the surface of a living cellNature Cell Biology 2:616–619.https://doi.org/10.1038/35023563
-
Ankyrin-B regulates Kir6.2 membrane expression and function in heartJournal of Biological Chemistry 285:28723–28730.https://doi.org/10.1074/jbc.M110.147868
-
Voltage-gated nav channel targeting in the heart requires an ankyrin-G dependent cellular pathwayThe Journal of Cell Biology 180:173–186.https://doi.org/10.1083/jcb.200710107
-
Structural requirements for interaction of sodium channel beta 1 subunits with ankyrinJournal of Biological Chemistry 277:26681–26688.https://doi.org/10.1074/jbc.M202354200
-
Severe congenital hyperinsulinism caused by a mutation in the Kir6.2 subunit of the adenosine triphosphate-sensitive potassium channel impairing trafficking and functionThe Journal of Clinical Endocrinology & Metabolism 90:5401–5406.https://doi.org/10.1210/jc.2005-0202
-
Localization of the Kv1.5 K+ channel protein in explanted cardiac tissueJournal of Clinical Investigation 96:282–292.https://doi.org/10.1172/JCI118032
-
Differential distribution of Kir2.1 and Kir2.3 subunits in canine atrium and ventricleAmerican Journal of Physiology-Heart and Circulatory Physiology 283:H1123–H1133.https://doi.org/10.1152/ajpheart.00934.2001
-
KV4.3 Expression Modulates NaV1.5 Sodium CurrentFrontiers in Physiology 9:178.https://doi.org/10.3389/fphys.2018.00178
-
Sodium channel remodeling in subcellular microdomains of murine failing cardiomyocytesJournal of the American Heart Association 6:e007622.https://doi.org/10.1161/JAHA.117.007622
-
BookGeometric Parameters of Pipettes and Membrane PatchesIn: Sakmann B, Neher E, editors. Single-Channel Recording. Plenum Press. pp. 637–650.https://doi.org/10.1007/978-1-4615-7858-1_2
-
A stochastic model of ion channel cluster formation in the plasma membraneThe Journal of General Physiology 151:1116–1134.https://doi.org/10.1085/jgp.201912327
-
Angular approach scanning ion conductance microscopyBiophysical Journal 110:2252–2265.https://doi.org/10.1016/j.bpj.2016.04.017
-
Cardiac sodium channel NaV1.5 distribution in myocytes via interacting proteins: The multiple pool modelBiochimica Et Biophysica Acta (BBA) - Molecular Cell Research 1833:886–894.https://doi.org/10.1016/j.bbamcr.2012.10.026
-
Trafficking to the apical and basolateral membranes in polarized epithelial cellsJournal of the American Society of Nephrology 25:1375–1386.https://doi.org/10.1681/ASN.2013080883
-
A homozygous SCN5A mutation associated with atrial standstill and sudden deathPacing and Clinical Electrophysiology pp. 1036–1042.https://doi.org/10.1111/pace.13386
-
Consequences of cardiac myocyte-specific ablation of KATP channels in transgenic mice expressing dominant negative Kir6 subunitsAmerican Journal of Physiology-Heart and Circulatory Physiology 291:H543–H551.https://doi.org/10.1152/ajpheart.00051.2006
-
Identification and characterization of two ankyrin-B isoforms in mammalian heartCardiovascular Research 107:466–477.https://doi.org/10.1093/cvr/cvv184
Article and author information
Author details
Funding
National Institutes of Health (HL126905)
- William A Coetzee
Fondation Leducq
- Eli Rothenberg
- Mario Delmar
Rafael del Pino Foundation
- Marta Pérez-Hernández
Biotechnology and Biological Sciences Research Council (BB/M022080)
- Andriy Shevchuk
British Heart Foundation (RG/17/13/33173)
- Jose Sanchez-Alonso
- Julia Gorelik
American Heart Association (17POST33370050)
- Hua-Qian Yang
National Institutes of Health (HL146514)
- William A Coetzee
National Institutes of Health (HL134328)
- Mario Delmar
National Institutes of Health (HL136179)
- Mario Delmar
National Institutes of Health (HL145911)
- Mario Delmar
National Institutes of Health (HL126802)
- Julia Gorelik
The funders had no role in study design, data collection and interpretation, or the decision to submit the work for publication.
Acknowledgements
This work was supported by R01 HL126905 (WAC), R01 HL146514 (WAC), RO1 HL134328, RO1 HL136179, RO1 HL145911 and a Fondation Leducq Transatlantic Network (MD), an Excellence Scholarship from the Rafael del Pino Foundation (MP-H), BBSRC BB/M022080/1 (AS), ROI HL126802 (JG) British Heart Foundation RG/17/13/33173 (JG and JSA), and an AHA Postdoctoral Fellowship award 17POST33370050 (HQY).
Ethics
Animal experimentation: This study was performed in strict accordance with the recommendations in the Guide for the Care and Use of Laboratory Animals of New York University School of Medicine (protocol s17-00352).
Version history
- Received: October 2, 2019
- Accepted: January 11, 2020
- Accepted Manuscript published: January 14, 2020 (version 1)
- Version of Record published: January 24, 2020 (version 2)
Copyright
© 2020, Yang et al.
This article is distributed under the terms of the Creative Commons Attribution License, which permits unrestricted use and redistribution provided that the original author and source are credited.
Metrics
-
- 1,671
- views
-
- 307
- downloads
-
- 23
- citations
Views, downloads and citations are aggregated across all versions of this paper published by eLife.
Download links
A two-part list of links to download the article, or parts of the article, in various formats.
Downloads (link to download the article as PDF)
Open citations (links to open the citations from this article in various online reference manager services)
Cite this article (links to download the citations from this article in formats compatible with various reference manager tools)
Ankyrin-G mediates targeting of both Na+ and KATP channels to the rat cardiac intercalated disc
eLife 9:e52373.
https://doi.org/10.7554/eLife.52373
Further reading
-
- Medicine
- Microbiology and Infectious Disease
Background:
End-stage renal disease (ESRD) patients experience immune compromise characterized by complex alterations of both innate and adaptive immunity, and results in higher susceptibility to infection and lower response to vaccination. This immune compromise, coupled with greater risk of exposure to infectious disease at hemodialysis (HD) centers, underscores the need for examination of the immune response to the COVID-19 mRNA-based vaccines.
Methods:
The immune response to the COVID-19 BNT162b2 mRNA vaccine was assessed in 20 HD patients and cohort-matched controls. RNA sequencing of peripheral blood mononuclear cells was performed longitudinally before and after each vaccination dose for a total of six time points per subject. Anti-spike antibody levels were quantified prior to the first vaccination dose (V1D0) and 7 d after the second dose (V2D7) using anti-spike IgG titers and antibody neutralization assays. Anti-spike IgG titers were additionally quantified 6 mo after initial vaccination. Clinical history and lab values in HD patients were obtained to identify predictors of vaccination response.
Results:
Transcriptomic analyses demonstrated differing time courses of immune responses, with prolonged myeloid cell activity in HD at 1 wk after the first vaccination dose. HD also demonstrated decreased metabolic activity and decreased antigen presentation compared to controls after the second vaccination dose. Anti-spike IgG titers and neutralizing function were substantially elevated in both controls and HD at V2D7, with a small but significant reduction in titers in HD groups (p<0.05). Anti-spike IgG remained elevated above baseline at 6 mo in both subject groups. Anti-spike IgG titers at V2D7 were highly predictive of 6-month titer levels. Transcriptomic biomarkers after the second vaccination dose and clinical biomarkers including ferritin levels were found to be predictive of antibody development.
Conclusions:
Overall, we demonstrate differing time courses of immune responses to the BTN162b2 mRNA COVID-19 vaccination in maintenance HD subjects comparable to healthy controls and identify transcriptomic and clinical predictors of anti-spike IgG titers in HD. Analyzing vaccination as an in vivo perturbation, our results warrant further characterization of the immune dysregulation of ESRD.
Funding:
F30HD102093, F30HL151182, T32HL144909, R01HL138628. This research has been funded by the University of Illinois at Chicago Center for Clinical and Translational Science (CCTS) award UL1TR002003.
-
- Medicine
Recent genome-wide association studies (GWAS) have identified a link between single-nucleotide polymorphisms (SNPs) near the MBOAT7 gene and advanced liver diseases. Specifically, the common MBOAT7 variant (rs641738) associated with reduced MBOAT7 expression is implicated in non-alcoholic fatty liver disease (NAFLD), alcohol-associated liver disease (ALD), and liver fibrosis. However, the precise mechanism underlying MBOAT7-driven liver disease progression remains elusive. Previously, we identified MBOAT7-driven acylation of lysophosphatidylinositol lipids as key mechanism suppressing the progression of NAFLD (Gwag et al., 2019). Here, we show that MBOAT7 loss of function promotes ALD via reorganization of lysosomal lipid homeostasis. Circulating levels of MBOAT7 metabolic products are significantly reduced in heavy drinkers compared to healthy controls. Hepatocyte- (Mboat7-HSKO), but not myeloid-specific (Mboat7-MSKO), deletion of Mboat7 exacerbates ethanol-induced liver injury. Lipidomic profiling reveals a reorganization of the hepatic lipidome in Mboat7-HSKO mice, characterized by increased endosomal/lysosomal lipids. Ethanol-exposed Mboat7-HSKO mice exhibit dysregulated autophagic flux and lysosomal biogenesis, associated with impaired transcription factor EB-mediated lysosomal biogenesis and autophagosome accumulation. This study provides mechanistic insights into how MBOAT7 influences ALD progression through dysregulation of lysosomal biogenesis and autophagic flux, highlighting hepatocyte-specific MBOAT7 loss as a key driver of ethanol-induced liver injury.


