1. Introduction
Over the past several years, GWAS have successfully identified thousands of common genetic variants associated with complex traits and common diseases (Visscher et al., Reference Visscher, Brown, McCarthy and Yang2012; Welter et al., Reference Welter, MacArthur, Morales, Burdett, Hall, Junkins, Klemm, Flicek, Manolio, Hindorff and Parkinson2014). However, many common variants identified explain only a small proportion of heritability (Maher, Reference Maher2008; McCarthy et al., Reference McCarthy, Abecasis, Cardon, Goldstein, Little, Ioannidis and Hirschhorn2008; Bansal et al., Reference Bansal, Libiger, Torkamani and Schork2010). It has been hypothesized that some of the heritability may be explained by unidentified rare variants (Pritchard, Reference Pritchard2001; Pritchard & Cox, Reference Pritchard and Cox2002; Manolio et al., Reference Manolio, Collins, Cox, Goldstein, Hindorff, Hunter, McCarthy, Ramos, Cardon, Chakravarti, Cho, Guttmacher, Kong, Kruglyak, Mardis, Rotimi, Slatkin, Valle, Whittemore, Boehnke, Clark, Eichler, Gibson, Haines, Mackay, McCarroll and Visscher2009). Next generation sequencing technology is being conducted to identify rare variants associated with complex traits. Since frequencies of rare variants are very low, it will be difficult to detect single rare variants. Hence, many existing methods for single common variants would not work and are underpowered for single rare variants. Recently, to increase the power of rare variants association tests, many statistical methods have been proposed. These methods can be classified into burden tests and nonburden tests.
Burden tests collapse the multiple rare variants within a given region into a single variable, then test the association between the single variable and the trait of interest. For example, the cohort allelic sums test (Morgenthaler & Thilly, Reference Morgenthaler and Thilly2007), the combined multivariate and collapsing method (CMC; Li & Leal, Reference Li and Leal2008), the weighted sum statistic (Madsen & Browning, Reference Madsen and Browning2009), the variable minor allele frequency threshold method (Price et al., Reference Price, Kryukov, de Bakker, Purcell, Staples, Wei and Sunyaev2010) and so on. The same strategy is used in many methods (Feng et al., Reference Feng, Elston and Zhu2011; Lin & Tang, Reference Lin and Tang2011; Sha et al., Reference Sha, Zhang and Zhang2011; Fang et al., Reference Fang, Sha and Zhang2012; Sha et al., Reference Sha, Wang and Zhang2013). These burden tests are more powerful when all rare variants within a region influence the phenotype in the same direction (Basu & Pan, Reference Basu and Pan2011). Nonburden tests, such as the C-alpha (Neale et al., Reference Neale, Rivas, Voight, Altshuler, Devlin, Orho-Melander, Kathiresan, Purcell, Roeder and Daly2011), the optimally weighted combination of variants (Sha et al., Reference Sha, Wang, Wang and Zhang2012), and the sequence kernel association test (SKAT; Wu et al., Reference Wu, Lee, Cai, Li, Boehnke and Lin2011), are based on the kernel machine regression method and are robust to the different directions of effects of variants.
There are several limitations for the above rare variant association methods. First, these association tests mainly target rare variants by putting large weights on rare variants and small weights on common variants. When common variants are also associated with the trait, these association methods can lead to loss of power. In fact, the relative contribution of common and rare variants is unknown for many complex traits. Recent studies show that some complex diseases are caused by both common and rare variants (Walsh & King, Reference Walsh and King2007, Bodmer & Bonilla, Reference Bodmer and Bonilla2008, Stratton & Rahman, Reference Stratton and Rahman2008, Ng et al., Reference Ng, Turner and Robertson2009, Teer & Mullikin, Reference Teer and Mullikin2010). So it is reasonable to assume that rare and common variants commonly influence the complex traits. Sha et al. (Reference Sha, Wang, Wang and Zhang2012) analytically derived optimal weights under a certain criterion and proposed a variable weight test for testing the effect of an optimally weighted combination of variants (VW-TOW). The VW-TOW aimed to test the effects of both rare and common variants. Second, these association tests suffer from power loss with the inclusion of a large proportion of neutral variants. To guard against the noise caused by the inclusion of neutral variants, Lin et al. (Reference Lin, Lou, Gao and Liu2014) proposed an ADA method that adaptively combines per-site P-values with the weights based on MAFs. Before combining P-values, they imposed a truncation threshold upon the per-site P-values. However, their association method only targeted rare variants.
In this paper, we extend the ADA method and propose a RC-ADA method that detects both rare and common variants in a given region by adaptive combination of P-values. For the given region, each common variant or each rare variant is separately tested, to obtain per-site P-values. We use a suited weight scheme for rare and common variants when per-site P-values are combined. To guard against the noise caused by neutral variants, variants with P-values larger than a threshold will be truncated. We don't fix a P-value truncation threshold, on the contrary, we allow multiple candidate truncation thresholds (0.10, 0.11, 0.12, · · · , 0.20) to choose the optimal threshold for any given data set. Our proposed method is applicable to binary traits, and is robust to the directions of effects of causal variants and the inclusion of a large proportion of neutral variants. Extensive simulation studies are used to compare the performance of the proposed method with that of other existing methods. Simulation results show that the RC-ADA is more powerful across a wide of range of scenarios.
2. Materials and methods
We consider a binary trait. Assume n individuals are sequenced in a genomic region (e.g. a candidate gene) with m variant sites. Denote Y i as the trait value of the ith individual (1 for case and 0 for control) and denote G i = (G i1, G i2, · · · , G im ) T as genotypic score of the ith individual, where G ik ∈ {0, 1, 2} is the number of minor alleles the ith individual has at the kth variant. Our analysis goal is to detect whether there is any association between the trait and the genomic region (a group of rare and common variants). We firstly test the association between the trait and each variant in the region. We divide variants into rare variants (MAF < the rare variant threshold [RVT]) and common variants (MAF > RVT). For each rare variant in the region, P-value is obtained by the Fisher's exact test (Fisher, Reference Fisher1922; Cheung et al., Reference Cheung, Wang, Leal and Wang2012). For each common variant in the region, we consider a logistic regression model:
 $${\rm logit}P({Y_i} = 1) = {\beta _0} + {\beta _1}G_{ik}^c, $$
where superscript c represents the common variant. The score statistic of testing β 1 = 0 is:
 $${T_k} = \displaystyle{{{{\left( {\sum\limits_{i = 1}^n ({Y_i} - \overline Y )(G_{ik}^c - \overline {G_k^c} )} \right)}^2}} \over {\overline Y (1 - \overline Y )\sum\limits_{i = 1}^n {{(G_{ik}^c - \overline {G_k^c} )}^2}}},$$
where
 $\overline Y = \displaystyle{1 \over n}\sum\limits_{i = 1}^n {Y_i},\overline {G_k^c} = \displaystyle{1 \over n}\sum\limits_{i = 1}^n G_{ik}^c $
. T
k
is approximated by
$\overline Y = \displaystyle{1 \over n}\sum\limits_{i = 1}^n {Y_i},\overline {G_k^c} = \displaystyle{1 \over n}\sum\limits_{i = 1}^n G_{ik}^c $
. T
k
is approximated by
 $\chi _1^2 $
distribution.
$\chi _1^2 $
distribution.
Let the per-site P-values of the m variants be p 1, p 2, · · · , p m , respectively. We name the sites with larger variant frequencies in cases than in controls, ‘deleterious-inclined variant sites', and those with larger variant frequencies in controls than in cases ‘protective-inclined variant sites'. To test the significance of the region and to guard against the noise caused by neutral variants, we combine the per-site P-values that are smaller than a given truncation threshold. Suppose that we consider J candidate truncation thresholds θ 1, θ 2, · · · , θ J . For the jth truncation threshold θ j , the significance score of the deleterious-inclined variant sites is:
 $$S_j^ + = - \sum\limits_{i = 1}^m {\xi _i} \cdot {I_{[{\,p_i} \lt {\theta _j}]}} \cdot {w_i} \cdot {\rm l}og{\,p_i},$$
where the indicator variable ξ i is 1 if the ith site is deleterious-inclined and 0 otherwise, w i is the weight of the ith site, and I [p i <θ j ] is 1 if the P-value of the ith site is smaller than the jth truncation threshold θ j and 0 otherwise. Similarly, for the jth truncation threshold θ j , the significance score of the protective-inclined variant sites is:
 $$S_j^ - = - \sum\limits_{i = 1}^m {\phi _i} \cdot {I_{[{\,p_i} \lt {\theta _j}]}} \cdot {w_i} \cdot {\rm l}og{\,p_i},$$
where the indicator variable ϕ
i
is 1 if the ith site is protective-inclined and 0 otherwise. In this paper, we specify 11 candidate truncation thresholds (0.1, 0.11, 0.12, · · · , 0.2) (we will discuss the selection of candidate truncation thresholds in the Discussion section). Since the goal is to test the association regardless of the direction of the effects, we use the statistic
 ${S_j} = \max (S_j^ + , S_j^ - )$
. Let P
j
be the P-value of the statistic S
j
, for j = 1, 2, · · · , J. The overall test statistic is T = minP
j
. Because variants within a functional region are usually not independent, we need permutations to obtain the P-values of the statistic S
j
(j = 1, 2, · · · , J) and the overall test statistic T. The permutations process is the same as that of Lin et al. (Reference Lin, Lou, Gao and Liu2014).
${S_j} = \max (S_j^ + , S_j^ - )$
. Let P
j
be the P-value of the statistic S
j
, for j = 1, 2, · · · , J. The overall test statistic is T = minP
j
. Because variants within a functional region are usually not independent, we need permutations to obtain the P-values of the statistic S
j
(j = 1, 2, · · · , J) and the overall test statistic T. The permutations process is the same as that of Lin et al. (Reference Lin, Lou, Gao and Liu2014).
Since rare variants and common variants are both likely to be associated with the trait, upweighting the contribution of rare variants and downweighting the contribution of common variants is not appropriate. So we use the same weight scheme as proposed by Ionita-Laza et al. (Reference Ionita-Laza, Lee, Makarov, Buxbaum and Lin2013) for rare and common variants. For rare variants, we use the weights w j = Beta(MAF j ;1, 25). However, this weight scheme does not work for common variants because it assigns almost zero weight to common variants. For example, w = 0·0004 for a MAF of 0·30, but w = 7·28 for a MAF of 0·05. So for common variants, we use the weight w j = Beta(MAF j ;0.5, 0.5), which slowly decreases with increasing MAF. For example, for MAF = 0·05, w = 1·46, for MAF = 0·10, w = 1·06, for MAF = 0·30, w = 0·69, and for MAF = 0·5, w = 0·64. Our proposed method is referred to as ‘RC-ADA', because the per-site P-values of rare and common variants sites are combined adaptively.
3. Simulation studies
(i) Simulation design
The GAW17 dataset is used for simulation studies. This dataset contains genotypes of 697 unrelated individuals on 3205 genes. We follow the simulation set-up of Sha et al. (Reference Sha, Wang, Wang and Zhang2012). Specifically, we choose four genes: ELAVL4 (gene 1), MSH4 (gene 2), PDE4B (gene 3) and ADAMTS4 (gene 4) with 10, 20, 30 and 40 variants, respectively. We merge the four genes into a super gene (Sgene) with 100 variants. In our simulation studies, we generate genotypes of n individuals based on the genotypes of 697 individuals in the Sgene. We infer haplotypic phases in the Sgene for the 697 individuals. To generate the genotypes with 100 variants of n individuals, we randomly combine two haplotypes of 1394 haplotypes of the 697 individuals. In the following, we describe how to generate trait values.
To evaluate type I error rate, we generate trait values by using the logistic model:
 $${\rm logit}P({Y_i} = 1) = {\beta _0}.$$
β 0 is chosen such that the disease prevalence is 0·05. We estimate the empirical type I error rate as the proportion of P-values less than α = 0·01 or 0·05.
To evaluate power, we consider two cases: (1) causal variants contain both rare and common variants, (2) all causal variants are rare variants. In case 1, we randomly select one common variant and 30% of all rare variants as causal variants. In fact, our proposed method can be applied to multiple common variants. In case 2, we randomly choose 30% of all rare variants as causal variants. In the two cases, we randomly assign d% of the rare causal variants as deleterious variants, and let the remaining (100–d%) of the rare causal variants be protective variants. The value of d is set to 10, 20, 50, 80 and 100, respectively. For power comparisons, we also consider three different values of RVT (0·01, 0·03 and 0·05). We generate binary traits by:
 $${\rm logit}P({Y_i} = 1) = {\beta _0} + \sum\limits_{i = 1}^{{n_d}} \beta _i^d G_i^d - \sum\limits_{\,j = 1}^{{n_p}} \beta _j^p G_j^p + {\beta _c}{G_c},$$
where n d and n p are the number of deleterious and protective rare variants, respectively. G c is the genotype of the common causal variant. β 0 is chosen such that the disease prevalence is 0·05. Under the two considered cases, we set the magnitude of each β j to a|log10MAF j | such that rarer variants have larger effects, where a = ln5/4 = 0·402. In case 2, β c is 0.
We compare the performance of our proposed method with that of the CMC method (Li & Leal, Reference Li and Leal2008), the SKAT method (Wu et al., Reference Wu, Lee, Cai, Li, Boehnke and Lin2011), the VW-TOW method (Sha et al., Reference Sha, Wang, Wang and Zhang2012), and the ADA method (Lin et al., Reference Lin, Lou, Gao and Liu2014). The ADA method and the VW-TOW method are implemented with their respective R script.
(ii) Evaluation on type I error rates
For type I error evaluation, we consider different values of RVT and different significance levels. In each simulation set-up, P-values are estimated by 1000 permutations and type I error rates are evaluated by 1000 replications. Sample size is set at 1000 (500 cases and 500 controls). Table 1 summarizes the estimated type I error rates for given different values of RVT and different significance levels. From this table, we can see that the estimated type I error rates are not significantly different from the nominal levels. So all test methods are valid tests.
Table 1. The estimated type I error rates for all tests.
Note: RVT represents the rare variant threshold; α represents the significance level.
(iii) Power comparisons
To evaluate the power of the proposed approach, we consider two cases: (1) both rare variants and one common variant are causal variants, (2) all causal variants are rare variants. In each of two cases, we consider different values of RVT, and different percentages of deleterious rare variants. Sample size is set at 1000 (500 cases and 500 controls). In case 1, we also consider different percentages of neutral variants among all rare variants (10%, 30%, 50% and 70%) and different sample sizes (500, 1000, and 2000). In each simulation scenario, P-values are estimated by 1000 permutations and powers are evaluated by 500 replications at a significance level of 0·05.
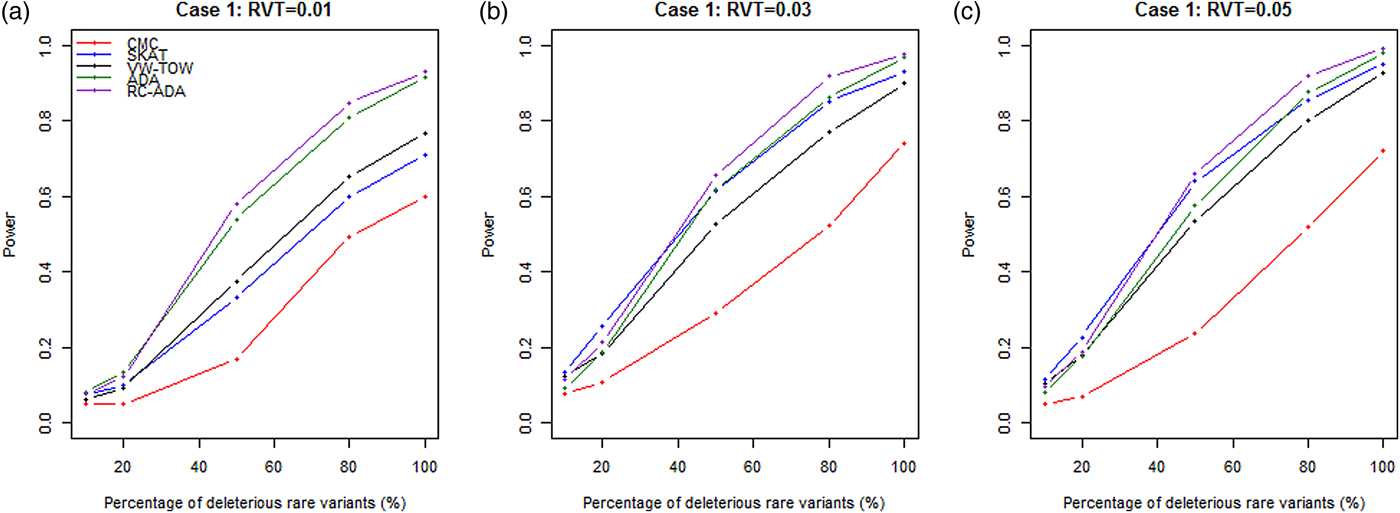
In Fig. 1, we report the power of the proposed RC-ADA method and of the existing four methods (CMC, SKAT, VW-TOW and ADA) for different percentages of deleterious rare variants based on case 1. Fig.1a shows that the RC-ADA and the ADA are much more powerful than the other three tests when RVT is 0·01. Fig.1b and c show that the RC-ADA, the SKAT and the ADA are much more powerful than the VW-TOW and the CMC. The RC-ADA is the most powerful in many cases. Among all methods, the CMC is the least powerful one. The CMC loses power because it gives common variants the same weights as rare variants, thus common neutral variants will introduce more noise. The RC-ADA is more powerful than the ADA. This is because the ADA only considers rare variants, but the RC-ADA considers both rare and common variants and imposes proper weights. The power of all methods increases when the percentage of deleterious rare variants is increased. The reason for this, pointed out by Wu et al. (Reference Wu, Lee, Cai, Li, Boehnke and Lin2011) and Sha et al. (Reference Sha, Wang, Wang and Zhang2012), is that protective variants imply negative log ORs and lower disease risk and hence lower MAFs in cases and causes more difficulties in observing rare variants in cases. The power of all methods is improved when RVT is larger.

Fig. 1. Power comparisons of five tests for different percentages of deleterious rare variants based on case 1. RVT represents the rare variant threshold for (a) 0·01, (b) 0·03 and (c) 0·05. x-axis represents the percentage of deleterious rare variants. Sample size is 1000. Power is estimated at the 0·05 significance level.
Power comparisons of five methods for different percentages of deleterious rare variants based on case 2 are given in Fig.2. By comparing Fig.2 with Fig.1, we see that patterns of power comparisons based on case 2 are very similar to that based on case 1. This is because we set smaller ORs for common causal variants.

Fig. 2. Power comparisons of five tests for different percentages of deleterious rare variants based on case 2. RVT represents the rare variant threshold for (a) 0·01, (b) 0·03 and (c) 0·05. x-axis represents the percentage of deleterious rare variants. Sample size is 1000. Power is estimated at the 0·05 significance level.
Comparisons of power as a function of percentage of neutral variants among all rare variants based on the case 1 are given in Fig.3. As shown in Fig.3, we see that the RC-ADA and the ADA are more powerful than the other three methods. The RC-ADA is the most powerful method in all the cases. The RC-ADA and the ADA have high power because they can guard against the noise caused by neutral variants by imposing a truncation threshold upon the per-site P-values. The power of the RC-ADA, the ADA, the SKAT and the VW-TOW are relatively robust to the increasing of neutral variants, while the power of the CMC decreases rapidly with the increasing of neutral variants.

Fig. 3. Power comparisons of five tests for different percentages of neutral variants among all rare variants based on case 1. RVT represents the rare variant threshold for (a) 0·01, (b) 0·03 and (c) 0·05. A total of 80% of rare causal variants are deleterious variants. x-axis represents the percentage of neutral variants among all rare variants. Sample size is 1000. Power is estimated at the 0·05 significance level.
Power comparisons of the five methods for different sample sizes based on case 1 are given in Fig.4. This figure shows that the power of all methods increases with an increase in sample size.
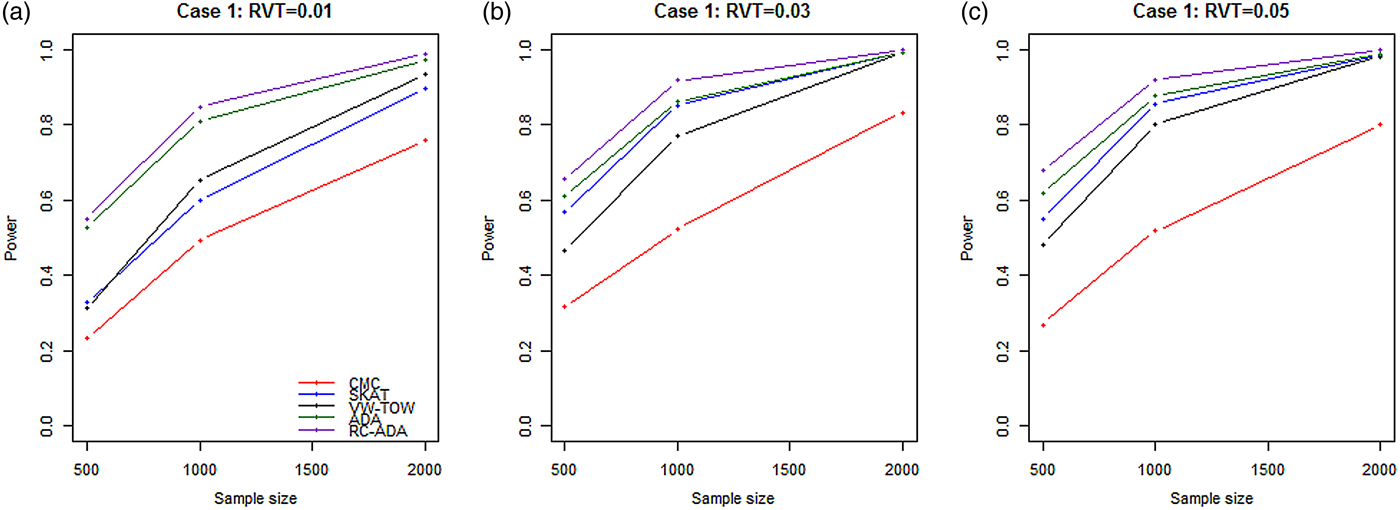
Fig. 4. Power comparisons of five tests for different sample sizes based on case 1. RVT represents the rare variant threshold for (a) 0·01, (b) 0·03 and (c) 0·05. A total of 80% of rare causal variants are deleterious variants. x-axis represents sample sizes. Power is estimated at the 0·05 significance level.
In summary, the RC-ADA is the most powerful method across a wide of range of scenarios.
4. Discussion
Many diseases are caused by both common and rare variants. However, most of the recently developed methods only detect rare variants. In this paper, we have proposed a powerful RC-ADA method for rare and common causal variant detection. We used extensive simulation studies to compare the performance of the RC-ADA with that of the existing methods. Our simulation results show that the RC-ADA is the most powerful method for testing rare and common variants in most cases.
For detecting rare variants, many methods put large weights on rare variants and small weights on common variants. Thus, these methods will lose power when the disease is caused by both rare and common variants. By choosing adaptive weights, our proposed RC-ADA shows good performance for detecting rare and common variants.
In our proposed RC-ADA, to guard against the noise caused by the inclusion of neutral variants, we imposed a truncation threshold upon the per-site P-values. Instead of fixing a threshold, we search for the optimal threshold among multiple candidate truncation thresholds. In this paper, we consider 11 candidate P-value truncation thresholds, 0.10, 0.11, 0.12, · · · , 0.20. In fact, we also consider two other cases. In the first case, we use 21 candidate P-value truncation thresholds, 0.05, 0.06, 0.07, · · · , 0.25. In the second case, we consider respective P-value truncation thresholds for rare variants and common variants. We consider a more stringent threshold for common variants. For example, 0.05, 0.06, 0.07, · · · , 0.15 for common variants, and 0.10, 0.11, 0.12, · · · , 0.20 for rare variants. Table 2 lists the power of the RC-ADA with three sets of candidate P-value truncation thresholds. Table 2 shows that using the other two cases doesn't contribute a noticeable power gain to the RC-ADA.
Table 2. Power(%) of RC-ADA method with three sets of candidate truncation thresholds.
Note: RVT is set at 0·03. Power is estimated at the 0·05 significance level. d represents the percentage of deleterious rare variants.
The authors would like to thank the joint Editor and referees for comments that greatly improved the presentation of the paper. This research was supported by the National Natural Science Foundation of China (no.11201129). The Genetic Analysis workshops are supported by GAW grant R01 GM031575 from the National Institute of General Medical Sciences. Preparation of the Genetic Analysis Workshop 17 Simulated Exome Dataset was supported in part by NIH R01 MH059490 and used sequencing data from the 1,000 Genomes Project (http://www.1000genomes.org).
Declaration of Interest
None.