Beta-Band Resonance and Intrinsic Oscillations in a Biophysically Detailed Model of the Subthalamic Nucleus-Globus Pallidus Network
 Lucas A. Koelman
 Madeleine M. Lowery
- Neuromuscular Systems Laboratory, School of Electrical and Electronic Engineering, University College Dublin, Dublin, Ireland
Increased beta-band oscillatory activity in the basal ganglia network is associated with Parkinsonian motor symptoms and is suppressed with medication and deep brain stimulation (DBS). The origins of the beta-band oscillations, however, remains unclear with both intrinsic oscillations arising within the subthalamic nucleus (STN)—external globus pallidus (GPe) network and exogenous beta-activity, originating outside the network, proposed as potential sources of the pathological activity. The aim of this study was to explore the relative contribution of autonomous oscillations and exogenous oscillatory inputs in the generation of pathological oscillatory activity in a biophysically detailed model of the parkinsonian STN-GPe network. The network model accounts for the integration of synaptic currents and their interaction with intrinsic membrane currents in dendritic structures within the STN and GPe. The model was used to investigate the development of beta-band synchrony and bursting within the STN-GPe network by changing the balance of excitation and inhibition in both nuclei, and by adding exogenous oscillatory inputs with varying phase relationships through the hyperdirect cortico-subthalamic and indirect striato-pallidal pathways. The model showed an intrinsic susceptibility to beta-band oscillations that was manifest in weak autonomously generated oscillations within the STN-GPe network and in selective amplification of exogenous beta-band synaptic inputs near the network's endogenous oscillation frequency. The frequency at which this resonance peak occurred was determined by the net level of excitatory drive to the network. Intrinsic or endogenously generated oscillations were too weak to support a pacemaker role for the STN-GPe network, however, they were considerably amplified by sparse cortical beta inputs and were further amplified by striatal beta inputs that promoted anti-phase firing of the cortex and GPe, resulting in maximum transient inhibition of STN neurons. The model elucidates a mechanism of cortical patterning of the STN-GPe network through feedback inhibition whereby intrinsic susceptibility to beta-band oscillations can lead to phase locked spiking under parkinsonian conditions. These results point to resonance of endogenous oscillations with exogenous patterning of the STN-GPe network as a mechanism of pathological synchronization, and a role for the pallido-striatal feedback loop in amplifying beta oscillations.
Introduction
Pathological oscillations in the basal ganglia-thalamocortical (BGTC) network have long been implicated in the motor symptoms of Parkinson's disease. Beta-band (13–30 Hz) oscillations are consistently strengthened with dopamine depletion both in individuals with Parkinson's disease (PD) and parkinsonian animal models (Sharott et al., 2005; Kuhn et al., 2008; Mallet et al., 2008b), and are reduced by deep brain stimulation (DBS) and pharmacological interventions that alleviate parkinsonian motor symptoms (Kühn et al., 2006; Weinberger et al., 2006; Ray et al., 2008; Eusebio et al., 2011). The magnitude of subthalamic nucleus local field potential beta oscillations is also correlated with the severity and degree of improvement of bradykinetic/akinetic motor symptoms and rigidity (Kühn et al., 2006; Bronte-Stewart et al., 2009). Although beta-band oscillations may not be causal to bradykinetic/akinetic symptoms (Leblois et al., 2007), they offer potential as a biomarker for symptom severity and the underlying network pathophysiology in advanced Parkinson's Disease. The origin of beta-band oscillations in the BGTC network, however, remains unclear. The most prominent hypotheses emphasize the importance of dopamine-modulated strengthening of particular feedback loops within the BGTC network. Computational models have provided a valuable tool with which to explore various hypotheses regarding the mechanisms by which oscillatory activity with the network is generated. Different models have placed the origin of beta and sub-beta band oscillations in the STN-GPe network (Terman et al., 2002; Gillies and Willshaw, 2007; Holgado et al., 2010; Pavlides et al., 2012), in cortical and thalamo-cortical circuits (Pavlides et al., 2015; Sherman et al., 2016; Liu et al., 2017; Reis et al., 2019), in striatal or pallidostriatal circuits (McCarthy et al., 2011; Corbit et al., 2016), or in the full BGTC loop (Leblois, 2006; Kang and Lowery, 2013; Pavlides et al., 2015; Kumaravelu et al., 2016). These models show that under many conditions the network is prone to oscillate, through intrinsic pacemaking or susceptibility to an extrinsic rhythm.
The reciprocally connected subthalamo-pallidal (STN-GPe) network is a key site in the basal ganglia in which beta-band oscillations are manifest in Parkinson's disease (Mallet et al., 2008a,b). This network was an early focus of modeling studies due to its reciprocally connected structure and ability to generate low frequency oscillations in tissue cultures (Plenz and Kital, 1999). Models of the STN-GPe as a pacemaker initially focused on the generation of low frequency oscillations within the frequency range of parkinsonian tremor (Gillies et al., 2002; Terman et al., 2002), with focus shifting to the beta-band with increasing evidence of a link between beta activity and parkinsonian motor symptoms (Holgado et al., 2010; Pavlides et al., 2012).
More recent experimental evidence suggests that, rather than the STN-GPe network operating in a pacemaking mode, patterning by cortex may play a critical role in the generation of pathological beta-band oscillations in Parkinson's disease. This is supported by observations of high functional coupling between cortex and STN (Magill et al., 2004; Sharott et al., 2005; Mallet et al., 2008a; Litvak et al., 2011; Moran et al., 2011), and that oscillatory activity in STN-GPe is contingent on inputs from the cortex and can be abolished by disrupting them (Magill et al., 2001; Drouot et al., 2004; Tachibana et al., 2011). Cortical patterning of the STN-GPe network by means of feedback inhibition provides a proposed mechanism for this functional coupling (Baufreton et al., 2005; Bevan et al., 2006; Mallet et al., 2008a, 2012; Tachibana et al., 2011). According to this hypothesis, weak oscillatory activity arriving via cortico-STN afferents is amplified in the STN-GPe network when feedback inhibition from the GPe is offset in phase with cortical excitation. While such feedback-mediated oscillations have been observed in vivo (Paz, 2005) and in slices (Baufreton et al., 2005), the ability of the network to generate autonomous oscillations and its resonant response properties are still poorly understood. Specifically, it is not clear whether the STN-GPe network plays an active part in generating beta-band oscillations, nor whether it amplifies or merely sustains them. Neither is it fully understood how beta-band oscillations relate to other pathological patterns of neural activity in the subthalamic nucleus (STN) and external globus pallidus (GPe) that correlate more strongly with parkinsonian motor symptoms, notably increased neural bursting (Sanders et al., 2013; Sharott et al., 2014). It is clear, however, that interventions in the loop and its afferents that reduce beta-band oscillations (Tachibana et al., 2011) or bursting (Gradinaru et al., 2009; Pan et al., 2016; Sanders and Jaeger, 2016) lead to improvements in motor symptoms. Similarly, the STN (Benabid et al., 2009) and GPe, in non-human primates (Vitek et al., 2012), are effective targets for DBS.
Previous modeling studies have focused on alterations in connection patterns and strength within or between nuclei, typically represented by mean-field or single-compartment spiking neuron models. While such models are computationally efficient, they may not fully capture the role of intrinsic properties of neurons in shaping pathological activity patterns. Although cell-specific ion channels can be used, single-compartment neuron models lump together ion channels and synapses in one isopotential compartment in a way that may not capture the complex dynamics that arise when non-uniformly distributed ion channels (Gillies and Willshaw, 2005) interact with synapses associated with distinct subcellular regions (Bevan et al., 1995; Galvan et al., 2004; Pan et al., 2016). Hence they may not fully account for the mechanisms contributing to pathological activity within the STN and the role that synaptic-ionic current interactions play in sustaining beta-band oscillations and excessive burst firing.
It has recently been demonstrated that following dopamine depletion the balance of excitatory and inhibitory synaptic currents in STN neurons is shifted toward inhibition (Chu et al., 2017; Wang et al., 2018), known to promote burst responses by increasing the availability of Ca2+ and Na+ channels de-inactivated at hyperpolarized potentials (Baufreton et al., 2005). In the GPe increased inhibition, caused mainly by strengthening of striato-pallidal afferents, is also believed to play a role in generating pathological oscillations as demonstrated in model simulation (Gillies et al., 2002; Terman et al., 2002; Holgado et al., 2010; Kumar et al., 2011). Increased GPe inhibition has been suggested to cause increased engagement of HCN channels (Chan, 2004), which are involved in phase resetting and controlling the regularity of firing. However, whether functional coupling between BG nuclei is also moderated by the excitation-inhibition balance is not fully understood.
The aim of this study was, therefore, to examine the relative contributions of intrinsic, endogenously generated oscillations and patterning by exogenous oscillatory inputs in the generation of synchronous beta-band oscillatory activity in a biophysically detailed model of the parkinsonian STN-GPe network and the underlying biophysical mechanisms. A second aim was to understand how pathological oscillations and bursting patterns are related to the balance of excitation and inhibition in the STN and GPe. The STN-GPe network was modeled using biophysically detailed multi-compartmental cell models of STN and GPe neurons that capture the interaction between synaptic and intrinsic currents distributed within the dendritic structure and involved in autonomous pacemaking and bursting (Gillies and Willshaw, 2005; Gunay et al., 2008). The generation of oscillations both autonomously within the network and in response to beta frequency inputs from the cortex (CTX) and indirect pathway striatal medium spiny neurons (iMSN) was examined as the balance of excitation and inhibition within the network was systematically varied, and oscillatory inputs with varying phase relationships were added. A better understanding of the relative contribution of these different factors and their interaction has the potential to improve understanding of the mechanism of action of existing anti-parkinsonian therapies, including DBS and to guide the development of more effective circuit interventions.
Methods
Model Architecture
The network model of the STN-GPe network consisted of four populations of neurons (Figure 1): the STN and GPe neurons, modeled as multi-compartmental conductance-based models, and their cortical and striatal inputs, modeled as Poisson or bursting spike generators.
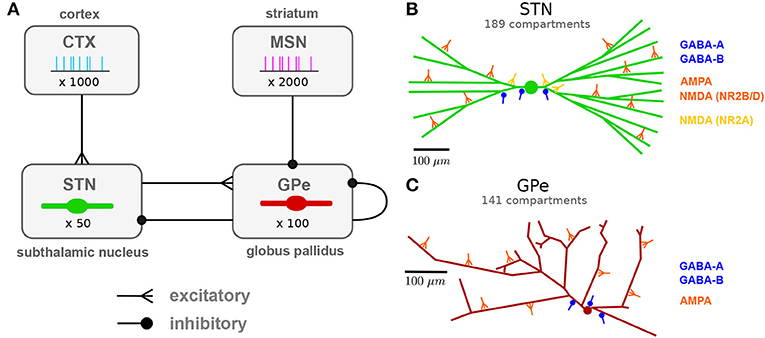
Figure 1. Network architecture: population and subcellular connectivity. (A) Neuronal populations and their projections modeled in the network. Subthalamic projection neurons (STN) and prototypic neurons of the external globus pallidus (GPe) were modeled using multi-compartmental neuron models. Cortical projection neurons (CTX) and indirect pathway striatal medium spiny neurons (iMSN) were modeled as spike generators. (B) Branching structure of the STN neuron model and representative synapses by afferent type, indicating subcellular distribution of synapses. Cortical glutamergic afferents synapse primarily onto thin dendrites, distally relative to the soma, but NMDA receptors with faster NR2A subunits mainly target the soma and proximal areas. Pallidal GABAergic afferents target proximal areas of the cell. (C) Branching structure of the GPe neuron model and representative synapses by afferent type. GABAergic GPe-GPe collaterals mainly target somata and proximal dendrites, whereas glutamergic afferents were placed in distal regions. Full details of the model are provided in the section Methods.
Population sizes were chosen to preserve the decrease in population sizes and convergence of projections along the indirect and hyperdirect pathways in the basal ganglia. The STN and GPe populations consisted of 50 and 100 multi-compartmental cells, respectively, to approximate the ratio of 13,000 STN cells to 30,000 GPe prototypic cells (Oorschot et al., 1999; Abdi et al., 2015) unilaterally in the rat. As a source of synaptic noise, an additional 10% of the cells in the STN and GPe populations were modeled as Poisson spike generators firing at a mean rate equal to the experimentally reported rate for the modeled state.
The cortical and striatal populations consisted of 1,000 and 2,000 cells, respectively, modeled as spike generators. These numbers were chosen to have 20 independent pre-synaptic spike generators per post-synaptic cell to model convergence along the hyperdirect CTX-STN and indirect iMSN-GPe projection. For the iMSN-GPe projection, convergence from all medium spiny neurons (MSN) to GPe, ignoring subpopulations, is 2,800,000 MSN cells to 46,000 GPe cells (Oorschot, 1996) resulting in a convergence factor of 60. Assuming that convergence is similar between iMSN and GPe prototypic neurons, our number is an underestimation by a factor three. Because iMSN cells in our model spike independently and since the number of synapses per cell was lower than in reality, this was considered acceptable.
Stochastic connectivity profiles for the connections illustrated in Figure 1 were generated by randomly selecting a fixed number of afferents from the pre-synaptic population for each post-synaptic cell. The ratios of number of afferents from each source population were determined, where possible, based on the reported number of synaptic boutons per afferent type and the number of contacts per axon (Table 1). Each multi-synaptic contact was represented by a single synapse to reduce the number of simulated synapses to a more tractable number.
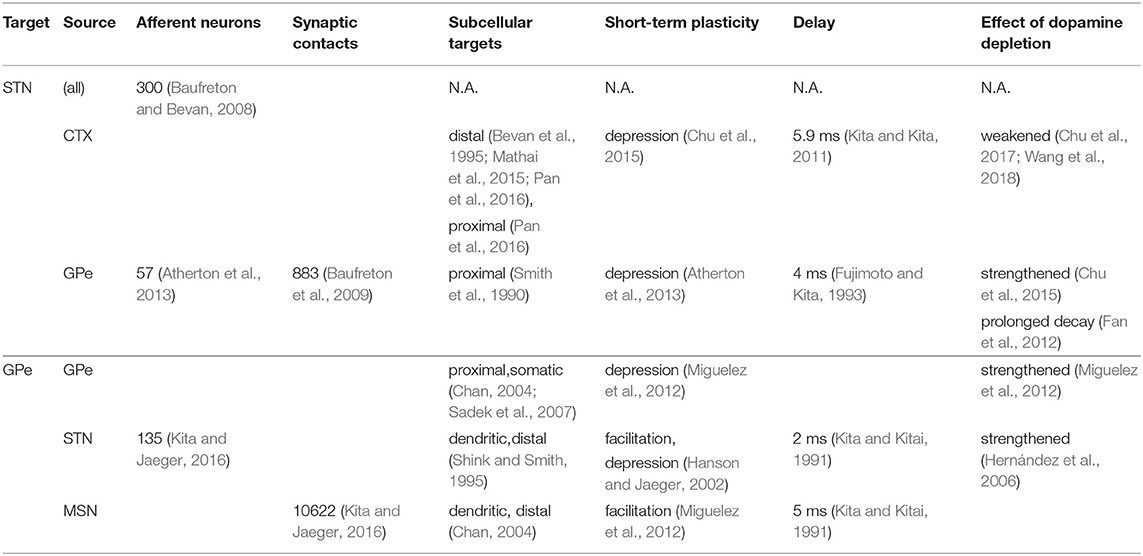
Table 1. Experimentally reported connection parameters used to calibrate the model.
Conductance-Based Models
The membrane potential vj (mV) in each compartment j of a multi-compartmental cable model is governed by:
where x (cm) is the position along the cable, cm (μF/cm2) is the specific membrane capacitance, d (cm) is the cable diameter, Ra is the specific axial resistance (Ωcm), gm (S/cm2) is the passive membrane conductance, Em (mV) the leakage reversal potential, Iion, j (mA/cm2) are the ionic currents flowing across the membrane of compartment j, and Isyn, j (mA/cm2) are the synaptic currents at synapses placed in the compartment. Each ionic current is governed by an equation of the form:
where is the maximum conductance of the channel (S/cm2), Ex is the reversal potential (mV), and mx and hx the open fractions of the activation and inactivation gates. The dynamics of the activation and inactivation gates m and h are governed by
with m∞(v) and τm(v) representing the voltage-dependent steady state value and time constant of the gate. For some currents the gating dynamics are described in terms of the opening and closing rates αm and βm related through , :
Reversal potentials are assumed constant unless otherwise noted. The reversal potential for Ca2+ currents was calculated using the Nernst equation from the intra- and extracellular ion concentrations:
where T is the temperature in Kelvin, R is the universal gas constant, F is the Faraday constant, and z is the valence of the calcium ion (+2). Intracellular calcium buffering in a sub-membrane shell is modeled as:
where c is a unit conversion constant, d is the thickness of the sub-membrane shell, and τCa is the time constant of decay.
Synaptic connections between cells were modeled by spike detectors in the somatic compartments, coupled to synapses in the target cells by a time delay. As no interactions between axons and other biophysical processes such as electric fields were required, axonal structures were omitted from the model and represented as delays between connected neurons. This constrained the computational complexity of the model, avoiding the requirement to simulate large number of additional compartments without altering the network behavior. Synapses were modeled by a dual exponential profile with rise and decay times τrise and τdecay modulated by the fraction of synaptic resources in the active state which was governed by Tsodyks-Markram dynamics (Tsodyks et al., 1998):
where, is the peak synaptic conductance, B-A represents the synaptic gating variable, fpeak is a normalization factor so that B-A reaches its maximum at time tpeak after the time of spike arrival tspk, R is the fraction of vesicles available for release, USE is the release probability, and τrec and τfacil are the time constants for recovery from short-term depression and facilitation, respectively. The synaptic reversal potentials Esyn were 0 mV for AMPA and NMDA, −80 mV for GABAA, and −95 mV for GABAB. For NMDA synapses there is an additional voltage-dependent gating variable representing magnesium block (Jahr and Stevens, 1990):
The metabotropoc GABAB receptor-mediated current was modeled as an intracellular signaling cascade based on the model by Destexhe and Sejnowski (1995). The equations describing G-protein activation and the synaptic current were retained, but the bound receptor fraction including the effects of desensitization was represented by the fraction of resources in the active state in the Tsodyks-Markram scheme (B-A). The equation governing the G-protein production rate thus became
where G is the G-protein concentration, and K3 and K4 are the rates of G-protein production and decay, respectively. The G-protein concentration G gates the peak synaptic conductance according to a sigmoid activation function represented by the Hill equation:
STN Cell Model
STN neurons were modeled using the rat subthalamic projection neuron model by Gillies and Willshaw (2005) (ModelDB accession number 74298). The neuron morphology is based on quantitative characterization of the dendritic trees of STN neurons in vitro. The model includes 10 intrinsic ionic currents (Table 2) :
where INaF and INaP are the transient fast-acting and persistent sodium current, IKDR, IKv31, and IsKCa the delayed rectifier, fast rectifier and calcium-activated potassium current, ICaT, ICaL, and ICaN the low-voltage-activated T-type, high-voltage-activated L-type, and high-voltage-activated N-type calcium currents, IHCN the hyperpolarization-activated cyclic nucleotide (HCN) current, and IL the leak current. The equations governing the dynamics of the gating variables are listed in Table 2. The channel density distributions are described extensively in Gillies and Willshaw (2005). As a source of noise, a current with a Gaussian amplitude distribution, mean zero and standard deviation 0.1 was added to the somatic compartment.
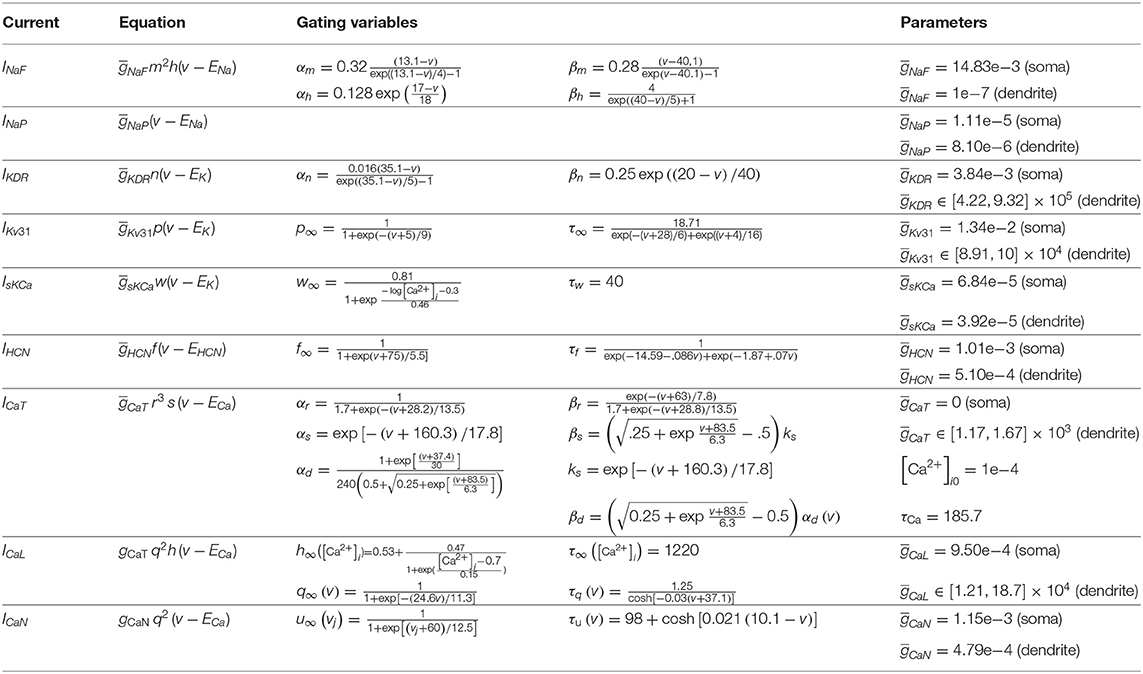
Table 2. STN model intrinsic current equations from Gillies and Willshaw (2005).
The synaptic currents included an excitatory glutamergic input from cortex, acting through AMPA and NMDA receptors, and an inhibitory GABAergic input from the GPe, acting through GABAA and GABAB receptors (Table 3):
In the control condition STN neurons had 20 excitatory afferents from CTX neurons and 8 inhibitory afferents from GPe neurons. The location of synapses on STN neurons and axonal propagation delays were based on experimental observations (Table 1). Cortico-subthalamic (CTX-STN) synapses were modeled as conductance-based synapses with Tsodyks-Markram dynamics (Tsodyks et al., 1998). On each of its target cells, a cortical axon had one synapse located distally in the dendritic tree and one located proximally near the soma. Distal synapses had both an AMPA and slower NMDA conductance component. The latter represented slower-kinetics NMDA receptors with majority NR2B and NR2D subunits that have dendritic punctual expression (Pan et al., 2016). Proximal synapses had only an NMDA component and represented NMDA receptors with fast-kinetics NR2A subunits. Synaptic parameter values are listed in Table 3. Synaptic rise and decay time constants τrise and τdecay for AMPA and NMDA NR2A constants were based on traces reported in Chu et al. (2015). For the slower NMDA NR2B synapses, values were based on Flint et al. (1997). The propagation delay td was taken from Kita and Kita (2011). Synapses were made to exhibit short-term depression upon high-frequency activation, based on observations by Froux et al. (2018). The ratio of the total AMPA to NMDA conductance were based on the ratios reported in Shen and Johnson (2005) for the normal and dopamine-depleted conditions, taking into account the reduction of synaptic terminals reported in Chu et al. (2017). Absolute values for the synaptic conductances were hand-tuned to bring the mean population firing rates into the reported range for the rat in dopamine-depleted condition (Mallet et al., 2008b; Kita and Kita, 2011). Synapses from GPe neurons were located proximally, close to the soma. Synapses of GPe-STN afferents had a fast GABAA and a slower GABAB component. Rise and decay time constants for the GABAA conductance were based on Fan et al. (2012). Short-term plasticity parameters were chosen so that synapses exhibited short-term depression, as shown in Atherton et al. (2013). Parameters for the GABAB synapse were taken from the model by Destexhe and Sejnowski (1995), and the decay time constant K4 was adapted so that the GABAB conductance exhibited depression upon continued pre-synaptic stimulation.
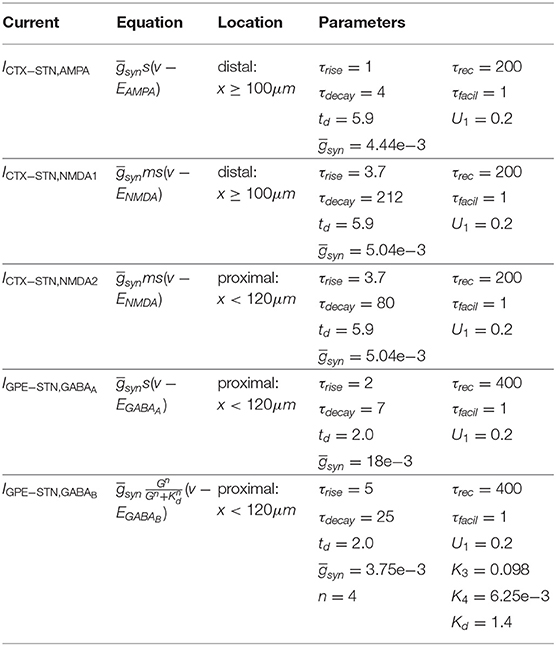
Table 3. STN model synaptic current equations.
GPe Cell Model
GPe neurons were modeled using the baseline rat GPe neuron model by Gunay et al. (2008) (ModelDB accession number 114639). The model is based on a reconstructed morphology from the adult rat and contains nine types of ion channels with varying densities in the soma, dendrite, and axon initial segment:
where INaF and INaP are the transient fast-acting and persistent sodium current, IKv2 and IKv3 the slow and fast delayed rectifier potassium current, IKv4f and IKv4s the fast and slow component of the A-type, transient potassium current, IKCNQ the M-type potassium current, IsKCa the calcium-dependent potassium current, ICaHVA the high-threshold, non-inactivating calcium current (reflecting a mixture of L, N, and P/Q-type calcium channel types), and IHCN, f and IHCN, s the fast and slow component of the HCN channel. The equations governing the dynamics of the gating variables are listed in Table 4. The channel density distributions are those described in Gunay et al. (2008) for model t9842. As a source of noise, a current that with a Gaussian amplitude distribution, mean zero and standard deviation 0.0075 was added to the somatic compartment, to represent membrane voltage noise of similar amplitude the STN cell model, given the lower somatic input resistance of the STN model.
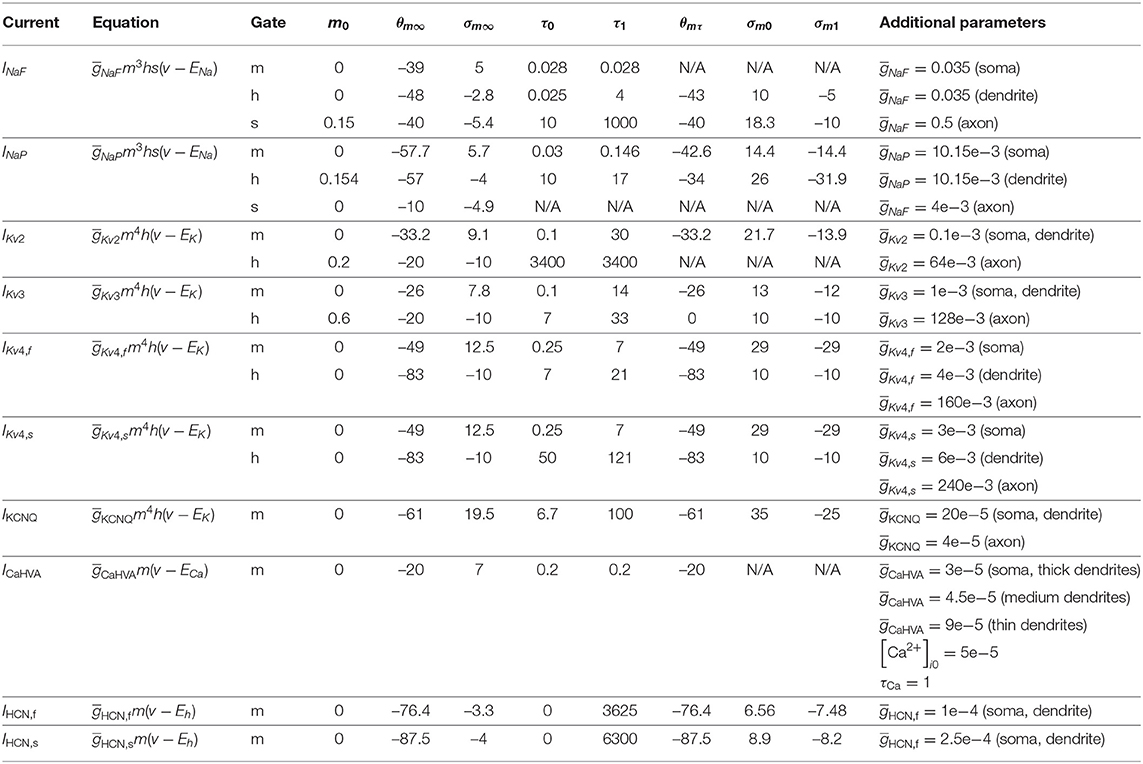
Table 4. GPe model intrinsic current equations from Gunay et al. (2008).
GPe neurons each had 10 excitatory afferents from STN neurons, 6 inhibitory afferents from GPe-GPe collaterals, and 30 inhibitory afferents from iMSN (Table 5). The location of synapses on GPe neurons and axonal propagation delays were based on experimental observations reported in the literature (Table 1). Relative magnitudes of synaptic conductances were chosen to bring the population firing rate into the reported range for the rat (Mallet et al., 2008b; Kita and Kita, 2011). Rise and decay time constants for AMPA conductances were set to 1 and 4 ms, respectively, and for GABAA conductances they were set to 2 and 5 ms, respectively. Synapses from STN neurons were located distally, in the dendritic tree. They consisted of an AMPA component and were modeled using Tsodyks-Markram dynamics. The parameters describing short-term plasticity dynamics were chosen to match traces reported in Hanson and Jaeger (2002). Synapses from GPe were located proximally, near the soma and had both a fast GABAA component with Tsodyks-Markram dynamics, and a slow metabotropic GABAB component. Short-term plasticity parameters were chosen so that synapses exhibited short-term depression (Miguelez et al., 2012). Synapses from striatal neurons had a GABAA component and were made to exhibit short-term facilitation based on Miguelez et al. (2012).
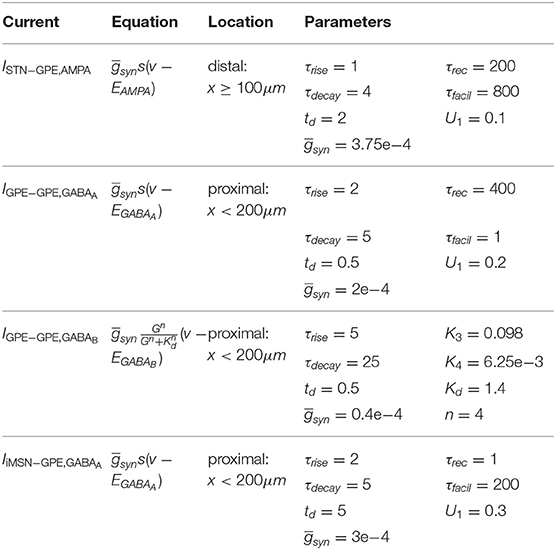
Table 5. GPe model synaptic current equations.
Modeling the Parkinsonian State
To model the parkinsonian state, the biophysical properties of the network and cell models were modified based on experimental observations made in the dopamine depleted and control conditions as reported in the literature. Various biophysical parameters, including synaptic strengths and time constants are affected by dopamine depletion, and were adjusted as detailed below. Scaling factors for synaptic and ionic conductances were set to experimentally reported values where available. Otherwise they were chosen to bring the mean population firing rates into physiological ranges reported for the rat in a state of cortical activation during light anesthesia (Mallet et al., 2008b; Kita and Kita, 2011).
The mean firing rate of STN surrogate spike sources was increased from 14.6 to 29.5 Hz in the parkinsonian state (Mallet et al., 2008b). The peak GABAA and GABAB conductance of GPe to STN synapses was increased by 50% and the GABAB decay time constant increased by 2 ms to model the increase in the number of contacts, vesicle release probability, and decay kinetics of GPe afferents (Fan et al., 2012). To model the reduction in cortico-STN axon terminals and their dendritic targets (Chu et al., 2017; Wang et al., 2018) the number of CTX-STN afferents was reduced to 70% of the normal condition, corresponding to the ratio of vGluT1 expression in the normal and dopamine depleted condition used to label axon terminals (Chu et al., 2017). To model functional strengthening of remaining synapses, the AMPA and NMDA peak conductances of remaining synapses were multiplied by the ratio of the current scaling factors reported in Shen and Johnson (2005) to the fraction of remaining synapses. The effect of functional strengthening and weakening of the CTX-STN projection was further investigated by systematically varying the peak synaptic conductances in the simulations experiments. Finally, HCN currents were reduced by 50% to model reduced depolarization and spontaneous activity after dopamine depletion (Zhu et al., 2002; Cragg et al., 2004) and modulation of HCN current by D2R receptors (Yang et al., 2016).
In GPe neurons the peak AMPA conductance of STN afferents was increased by 50% to model the modulatory effect of dopamine on glutamergic excitatory currents (Johnson and Napier, 1997; Hernández et al., 2006; Kita, 2007). The strengthening of GPe-GPe collaterals (Miguelez et al., 2012; Nevado-Holgado et al., 2014) was modeled by increasing the peak GABAA and GABAB conductances by 50%. The mean firing rate of GPe surrogate spike sources was decreased from 33.7 to 14.6 (Mallet et al., 2008a). Finally, the HCN channel conductance was decreased by 50% in accordance with experimental data (Chan et al., 2011).
In simulations without oscillatory inputs, cortical projection neurons were modeled as Poisson spike generators firing at 10 Hz, a multiple of the experimentally reported rate of 2.5 Hz (Li et al., 2012), so that each synapse represented the combined inputs of four pre-synaptic neurons (making use of the additive property of the Poisson distribution). In simulations with oscillatory inputs, oscillatory spike trains were generated as follows: on top of the aforementioned background firing pattern, bursts were added in each period of a regular oscillation at the chosen oscillation frequency. In each period of the oscillation 10% of neurons were selected randomly to emit a burst. The onset time of the burst was the same in each selected neuron, so that bursts occurred in-phase between neurons, but the number of spikes in a burst was variable with inter-spike intervals sampled from the interval [5, 6] ms. All background spikes occurring in a time window centered on a burst were deleted to prevent unrealistically high inter-spike intervals. Figure 7D shows a rastergram with representative spike trains generated using this method.
The increase in excitability and spontaneous activity of iMSN (Kita and Kita, 2011; Fieblinger et al., 2014) was modeled by increasing the mean firing rate of the Poisson spike generators from 1.5 to 6.64 Hz. In experiments where iMSN cells fired oscillatory bursts the same algorithm as described for cortical projection neurons was used. The modulation of GABAergic transmission from iMSN to GPe neurons (Cooper and Stanford, 2001; Shin et al., 2003) was modeled by increasing the initial release probability and the peak GABAA conductance of synapses by 50%.
Simulation Details
The model was simulated in the NEURON simulation environment (Hines and Carnevale, 1997) and implemented in Python. The default fixed time step integrator with a time step of 0.025 ms was used for all simulations. Compartmental membrane voltages were initialized to a random value between −63 and −73 mV in GPe and between −60 and −70 mV in STN cells. Gating variables were initialized to their equilibrium values for the initial membrane voltage. Simulation data for the first 2,000 ms of each simulation were discarded, and the analyzed intervals were of duration 4,000 ms unless otherwise noted. Simulations were run on the UCD Sonic cluster using 8 parallel processes per simulation on a single computing node, consisting of two Intel Ivybridge E5-2660 v2 CPUs (10 cores per CPU).
Signal Analysis
Signal analyses were performed using the SciPy toolbox (Jones et al., 2001) for Python. Power spectral densities (PSDs) were calculated using Welch's periodogram method, using overlapping segments of 2 s duration with 50% overlap and a Hanning window. Given the sampling period of 0.05 ms this led to a frequency resolution of 0.5 Hz. The population PSD was calculated as the mean PSD of all somatic membrane voltages. The instantaneous phase of each population was estimated by applying the Hilbert transform to the average somatic membrane voltage of cells in the population, after band-pass filtering using a neutral-phase filter (Butterworth filter, 4th order, command sosfiltfilt) in an 8 Hz wide frequency band centered on the dominant oscillation frequency. For populations that were modeled as surrogate spike trains (cortex and striatum), artificial membrane voltage signals were first constructed by convolving the spike trains with a typical action potential waveform. Bursts were detected using a simple algorithm where a burst consisted of a minimum of four spikes with inter-spike intervals (ISIs) ≤ 20 ms.
Results
The STN-GPe pacemaker hypothesis was first investigated by modeling cortical inputs to the STN as Poisson spike generators without any periodic or oscillatory component. Cortical patterning of neural activity in the STN-GPe network via the hyperdirect pathway was then investigated by modeling cortical input to the STN inputs as periodically bursting spike trains. To investigate whether changing the excitation-inhibition balance in STN and GPe contributed to changes in spontaneous synchronization and functional coupling between nuclei, the ratio of excitation and inhibition was systematically increased by altering the strength of individual projections between nuclei. The ratio of total excitatory to inhibitory synaptic currents (E/I ratio) was altered by scaling the peak conductance of all synapses belonging to a given projection known to be strengthened or weakened by dopamine depletion. The role of additional oscillatory inputs entering the STN-GPe network via the indirect striato-pallidal pathway and their phase relationship to cortical inputs were then investigated.
The Balance of Excitation and Inhibition Balance in the STN Affects the Oscillation Frequency of the STN-GPe Network and Firing Mode of STN Neurons
Increasing the strength of the CTX-STN projection by increasing the conductance of cortico-subthalamic synapses revealed parameter regimes that favored low frequency bursting in STN neurons and phase-locking to an emergent beta-band rhythm in the STN-GPe network (Figures 2A–D). For lower values of synaptic conductance the network exhibited synchronous oscillatory activity at 12–13 Hz (Figure 2A), with both STN and GPe neurons entrained to the oscillation (Figures 2Bi–iii). This high entrainment regimen coincided with low neuronal firing rates (Figure 2E) where short spike sequences, mostly singlets and doublets, showed a high phase preference as evidenced by the high population and individual neuronal phase vector lengths (Figure 2Bii).
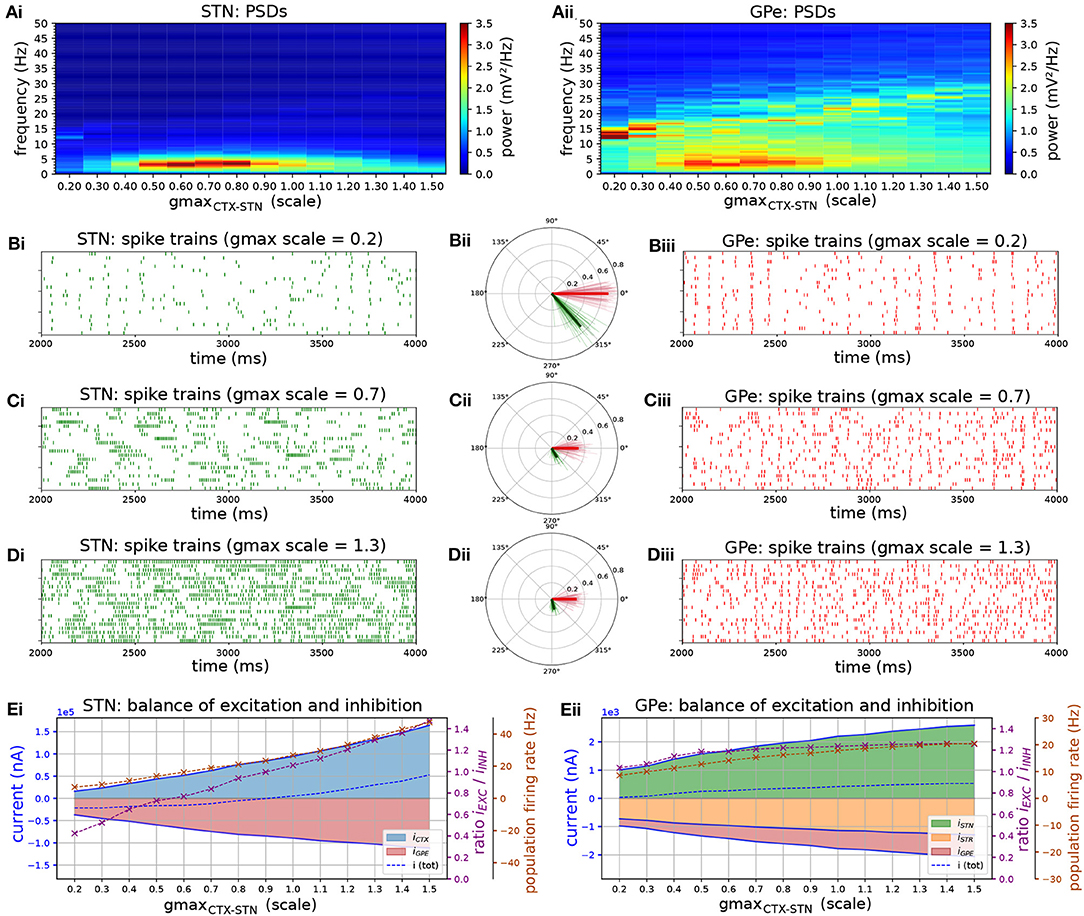
Figure 2. The level of excitation by cortex determines firing patterns and oscillation frequency in the autonomous STN-GPe network. Behavior of the autonomous STN-GPe network for increasing values of the CTX to STN synaptic conductance. (A) Mean PSD of the somatic membrane voltages of STN (Ai) and GPe (Aii) neurons. (B–D) Representative spike trains and phase vectors for STN (column i, green) and GPe population (column iii, red) for three different scale factors of the CTX to STN conductance [scale 0.2; 0.7; 1.3 in rows (C–E), respectively]. Column ii shows phase vectors of the STN and GPe populations (in green; red, respectively, mean population vectors plotted as thick solid lines and cell vectors as thin transparent lines) reflecting phase locking to the instantaneous GPe phase. Phase vectors were measured with respect to the instantaneous phase of the GPe population extracted using a bandpass filter with passband of 8 Hz centered on the frequency bin with maximum power in the 13–30 Hz band. (E) Balance of excitation and inhibition in the STN (Ei) and GPe (Eii) based on synaptic currents recorded in three neurons. Population firing rate (brown), E/I ratio (purple), and net synaptic current (blue). Shaded areas represent estimated total synaptic current from one pre-synaptic population during a simulation. Total current was estimated by recording all synapses on 3 randomly selected cells in each population and adjusting for the true number of cells.
Increasing the synaptic conductance caused a proportional increase in excitatory current to the STN (Figure 2E, blue area), with a corresponding increase in inhibition (red area) as a result of the negative feedback structure of the STN-GPe loop. However, because the GPe population exhibited a saturating population firing rate curve (Figure 2Eii), feedback inhibition to STN was outpaced by cortical excitation, resulting in a shift to net excitation (E/I > 1). This saturating firing rate curve in the GPe was a result of two negative feedback mechanisms that have a homeostatic effect on the GPE's E/I ratio: reciprocal inhibition through intra-GPe colaterals and short-term depression of STN to GPe synapses (Hanson and Jaeger, 2002). The increase of excitatory drive in the network increased the frequency at which oscillations emerged within the network (Figure 2Aii, peak in the PSD is shifted), though the level of synchronization of neurons was relatively weak. This was particularly the case in the STN, as evidenced by the low phase vector lengths (Figures 2Cii,Dii,Eii). Despite the lower vector lengths, reflecting more dispersed spike timings within a period of the oscillation, spikes in both STN and GPe neurons showed a consistent phase preference with respect to the ongoing oscillation, as evidenced by the alignment of individual neuronal and population phase vector. The STN population vector led that of GPe by 45 degrees indicating that STN neurons excited GPe neurons which responded with a delay of 10 ms, resulting in a wave of inhibition to the STN with a long recovery period comparable to the oscillation period. Although excitation outpaced inhibition in STN neurons, higher inhibitory currents resulted in increased transient inhibition of STN dendrites, engaging the ion channels underlying burst responses. This brought STN neurons into a slow burst firing mode characterized by sparse, strong bursts (Figure 2Ci). These low-frequency fluctuations in firing rate were transmitted to GPe neurons as evident in the power spectra of both nuclei (Figures 2Ai,ii).
Increasing the strength of GPe-GPe colaterals (Figure 3) similarly increased the level of excitation of STN neurons but by a different mechanism. By increasing self-inhibition within the GPe, and thereby decreasing inhibition of targets in the STN (Figure 3D, red area), the E/I ratio in both populations moved in opposite directions. As the E/I ratio in STN increased toward dominant excitation (Figure 3D), neural activity shifted from strong low-frequency bursting (characterized by a high intra-burst firing rate and high low-frequency power) (Figures 3Ai,Bi,F) toward more regular firing with decreasing coefficient of variation of inter-spike intervals (CVISI) and intra-burst firing rate (Figures 3Ci,F). The E/I ratio and population firing rate in the GPe showed a saturating characteristic (Figure 3Dii) caused by the negative feedback structures inherent in the loop as before (Figure 3D) as it was progressively disinhibited. GPe neurons were more strongly entrained to the emergent oscillation (17–26 Hz) whereas STN spiking showed a weaker phase preference (Figures 3Bii,Cii,E). This result was the same whether the instantaneous phase was extracted from the STN or GPe population.
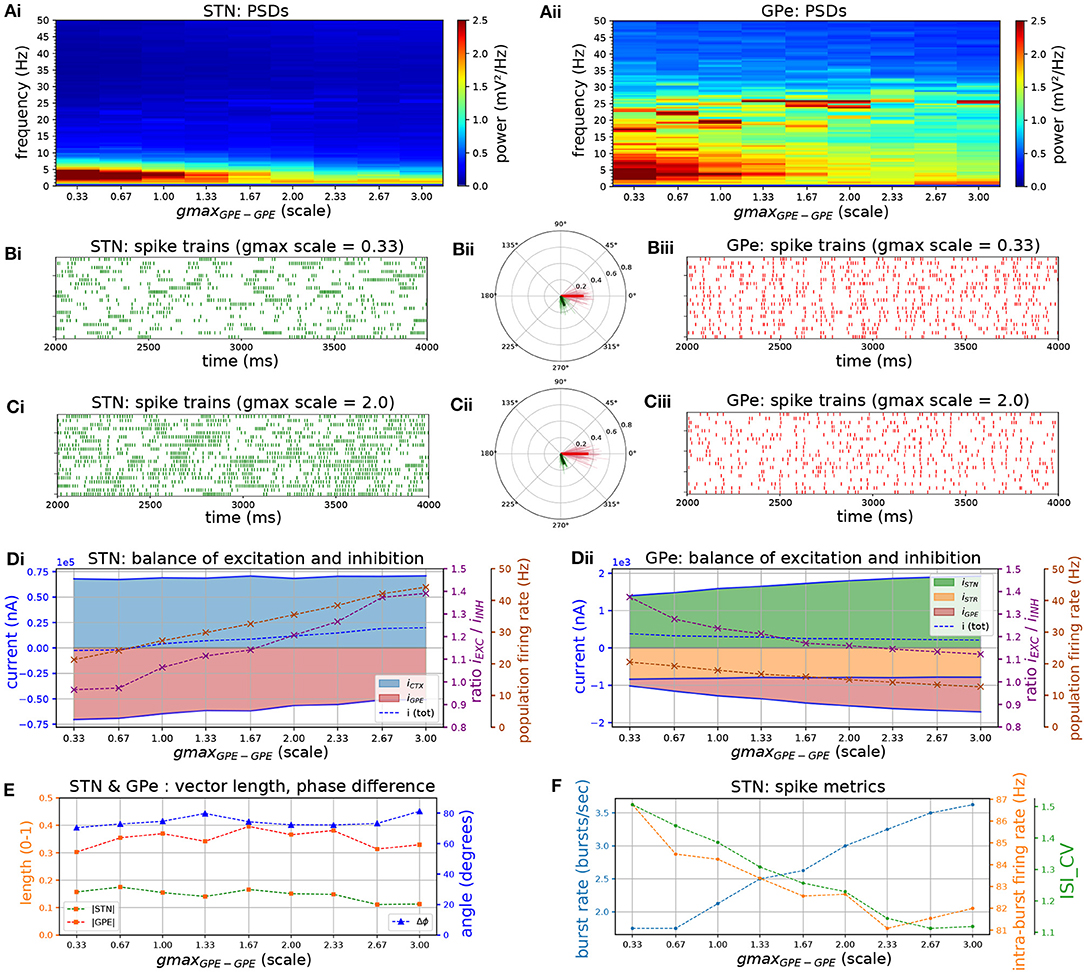
Figure 3. Increasing the level of collateral GPe-GPe inhibition shifts the excitation-inhibition balance in STN and GPe in opposite directions. Behavior of the autonomous STN-GPe network for increasing values of GPe-GPe synaptic conductance. (A) Mean PSD of the somatic membrane voltages of STN (Ai) and GPe (Aii) neurons. (B,C) Representative spike trains and phase vectors for STN (column i, green) and GPe population (column iii, red) for two values of the GPe to GPe conductance [scale 0.33; 2.0 in rows (B,C), respectively]. Column ii shows phase vectors of the STN and GPe populations (in green; red, respectively, mean population vectors plotted as thick solid lines and cell vectors as thin transparent lines) reflecting phase locking to the instantaneous GPe phase. (D): Balance of excitation and inhibition in the STN (Di) and GPe (Dii) based on synaptic currents recorded in three neurons. Mean population firing rate (brown), E/I ratio (purple), and net synaptic current (blue). Shaded areas represent estimated total synaptic current from one pre-synaptic population during a simulation. (E) Population vector length and angle of STN and GPe population (green; red, respectively). (F) Metrics that characterize bursting in STN neurons: median burst rate, intra-burst firing rate, and coefficient of variation of ISIs across all STN cells.
Strength and Time-Course of GPe-STN Inhibition Controls Bursting and Phase-Locking in STN Neurons
Following dopamine depletion the inhibitory GPe-STN connection is strengthened by a proliferation of synapses and increased decay kinetics of GABA currents (Fan et al., 2012). Moreover, the expression of both GABAA (Fan et al., 2012) and GABAB (Shen and Johnson, 2005) receptors is upregulated leading to larger evoked synaptic currents. To investigate the effects of increased inhibition and altered kinetics of inhibitory post-synaptic currents (IPSC) in STN neurons on network activity patterns, an increase in the GABAA and GABAB conductances was simulated and the relative contribution of both currents was altered.
Increasing the conductance of both GABAA and GABAB synapses lead to an increase in low-frequency bursting of STN neurons (Figures 4A–C). Bursting was periodic at low frequencies (~ 2–5 Hz) but was not synchronized between cells (Figure 4Ci). Increasing the conductance also shifted the firing mode of STN neurons toward longer bursts with higher intra-burst firing rate against a lower background firing rate, characterized by a high coefficient of variation of ISIs (Figures 4D,F). Bursting with high intra-burst firing rates is mediated by a shift toward net inhibition in STN neurons (Figure 4D), leading to increased availability of voltage-sensitive Na+ and Ca2+ channels through de-inactivation at hyperpolarized membrane voltages (Baufreton et al., 2005; Gillies and Willshaw, 2005; Hallworth and Bevan, 2005). The GPe neuron model does not possess the same high density of Ca2+ channels that underlies plateau potentials and strong bursting, and therefore has a lower tendency toward burst firing. While STN neurons were more weakly entrained to the beta oscillation they preferentially fired in an interval leading the GPe by 65 degrees (Figures 4B,C,E). The shift toward low-frequency, fast bursting coincided with an increase in synchronization in the network, as measured by the population vector length of the STN and GPe.
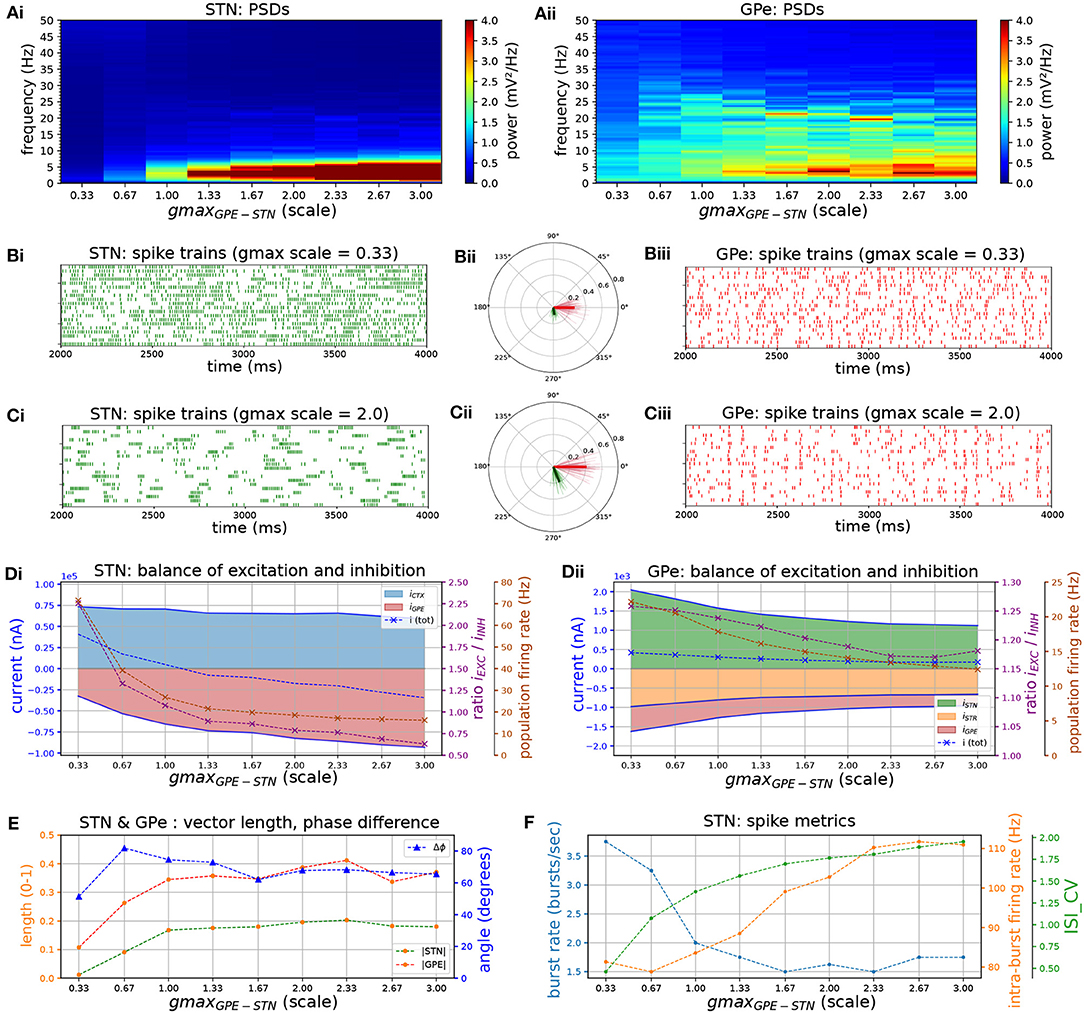
Figure 4. Increasing the level of GPe-STN inhibition shifts STN to a low-frequency burst firing mode. Behavior of the autonomous STN-GPe network for increasing values of the GPe to STN synaptic conductance. (A) Mean PSD of the somatic membrane voltages of STN (Ai) and GPe (Aii) neurons. (B,C) Representative spike trains and phase vectors for STN (column i, green) and GPe population (column iii, red) for two values of the GPe to STN conductance [scale 0.33; 2.0 in rows (C,D), respectively]. Column ii shows phase vectors of the STN and GPe populations (in green; red, respectively, mean population vectors plotted as thick solid lines and cell vectors as thin transparent lines) reflecting phase locking to the instantaneous GPe phase. (D) Balance of excitation and inhibition in the STN (Di) and GPe (Dii) based on synaptic currents recorded in three neurons. Population firing rate (brown), E/I ratio (purple), and net synaptic current (blue). Shaded areas represent estimated total synaptic current from one pre-synaptic population during a simulation. (E) Population vector length and angle of STN (green) and GPe (red) population. (F) Metrics that characterize bursting in STN neurons: median burst rate, intra-burst firing rate, and coefficient of variation of ISIs across all STN cells.
To investigate the effect of IPSC kinetics on the generation of beta oscillations within the network, the relative strength of the GABAA and GABAB-mediated current was changed by decreasing the GABAB conductance by 50% and increasing the GABAA conductance progressively (Figure 5). As this increased the level of inhibition in STN neurons, it resulted in a small shift in the oscillation frequency across the parameter sweep (Figure 5A). The simulations results showed that the slow nature of the GABAB-mediated current prevented GPe neurons from patterning their targets with short duration IPSC required for strong entrainment in the 20–30 Hz range. When the GABAA conductance was increased, and the GABAB conductance decreased accordingly, both STN and GPe neurons entrained strongly to the beta rhythm as evident in phase histograms and spike trains (Figures 5B,C). When the experiment of Figure 2 was repeated in the adjusted network with a higher GABAA to GABAB ratio, the oscillation frequency in both STN and GPe also showed a clear sensitivity to the strength of the Poisson distributed cortical excitatory input (Figure 5D).
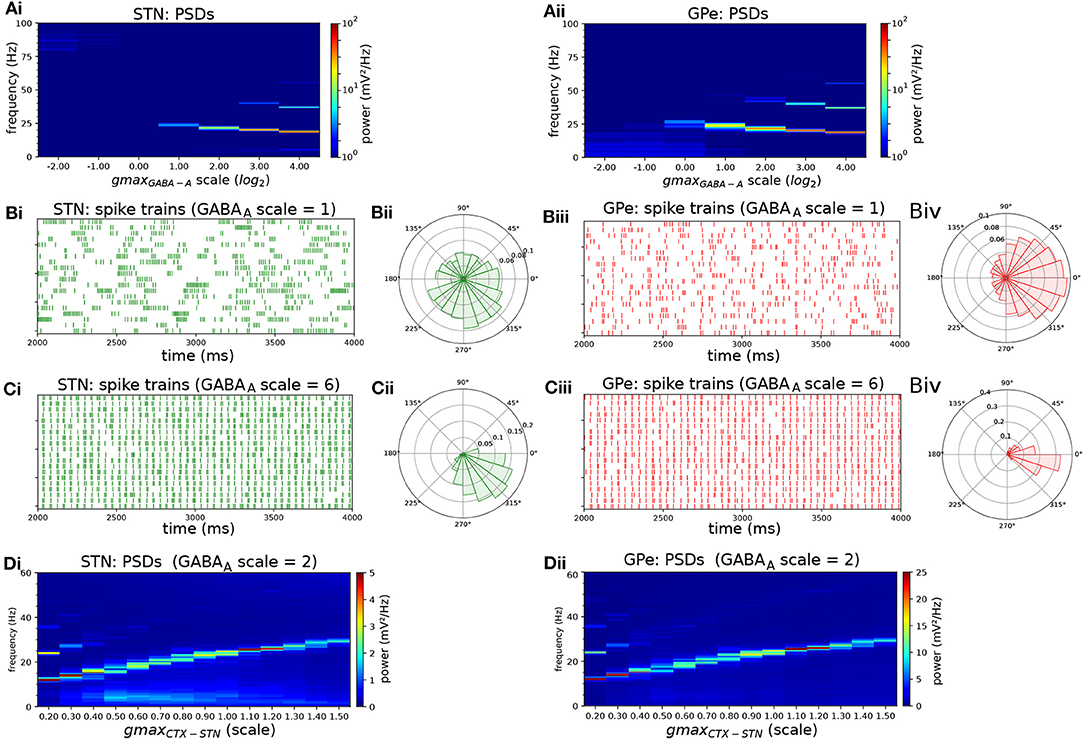
Figure 5. Endogenous oscillations in the STN-GPe network are strengthened by shifting the GPe-STN synaptic current from slow GABAB receptors to fast GABAA receptors. Behavior or the STN-GPe network for increasing values of the GABAA to GABAB conductance ratio. The GABAB conductance of the GPe to STN projection was decreased by 50% and the GABAA conductance was increased progressively. (A) Mean PSD of the somatic membrane voltages of STN (Ai) and GPe (Aii) neurons. (B,C) Representative spike trains and phase histograms of STN (green) and GPe neurons (red) in baseline model without scaling of conductances (B) and model where GABAA conductance was scaled by a factor 6 and GABAB conductance was scaled by factor 0.2, chosen so that the E/I ratio was close to that in the baseline model (B: baseline model, E/I ratio was 0.89; 0.97 in STN, GPe respectively; C: scaled conductances, ratio was 0.89; 0.93). The presence of stronger GABAB currents results in higher phase dispersion (B) compared to the case with weaker GABAB currents and stronger, fast GABAA currents (C). (D) Mean PSD of somatic membrane voltages of STN (Di) and GPe (Dii) neurons for increasing CTX-STN conductance and adjusted GABAA to GABAB ratio. The GABAB conductance of GPe to STN synapses was halved, and the GABAA conductance was doubled.
STN-GPe Network Shows Resonant Properties and Phase Locks to Cortical Beta Inputs
The degree of phase locking of the STN-GPe network to synchronous cortical rhythms and its sensitivity to intrinsic network parameters was then examined. The network was simulated with cortical inputs modeled as spike trains exhibiting sparse, synchronous bursts. The frequency of the synchronous cortical inputs was first increased from 3 to 60 Hz and the frequency response and phase locking strength of the STN-GPe loop was estimated (Figures 6A–C). Spectral power and phase locking, measured by the population vector length, were strongest when the cortical oscillation frequency was close to the network's endogenous oscillation frequency (Figures 6B,C), indicating a resonance effect. Spectral power at the oscillation frequency was increased considerably above that observed for Poisson distributed cortical inputs (compare Figures 6Ai,ii to Figures 2Ai,ii). Moreover, the frequencies that were amplified by the STN-GPe network corresponded well to the beta-band, i.e., 13–30 Hz (Figure 2B). To study the dependence of the resonance peak on the excitation-inhibition balance in the STN, the cortical input strength was then varied while the oscillation frequency remained fixed (Figure 6D). The range of synaptic conductances was chosen so that the STN population firing rate traversed the experimentally reported range of 17–37 Hz (Mallet et al., 2008b; Kita and Kita, 2011) in the dopamine depleted state during cortical activation (Figure 7C). Maximum phase locking coincided with frequency of maximum endogenous oscillation power observed in the absence of oscillatory inputs (Figures 2Di,ii). The results demonstrate how the resonant frequency of the network can be shifted by changing the excitation-inhibition balance, biasing the network toward a slower or faster oscillation. GPe neurons synchronized stronger to the oscillatory input compared to STN neurons (Figures 6B,C, 7Bi,ii), which showed a tendency to burst, mirroring the results for spontaneous synchronization in the autonomous STN-GPe network. Analogous to the autonomous loop, when the slow bursting behavior was reduced by shifting the GPe to STN synaptic current from GABAB to faster GABAA receptors, synchronization and phase locking of both STN and GPe neurons was greatly increased.
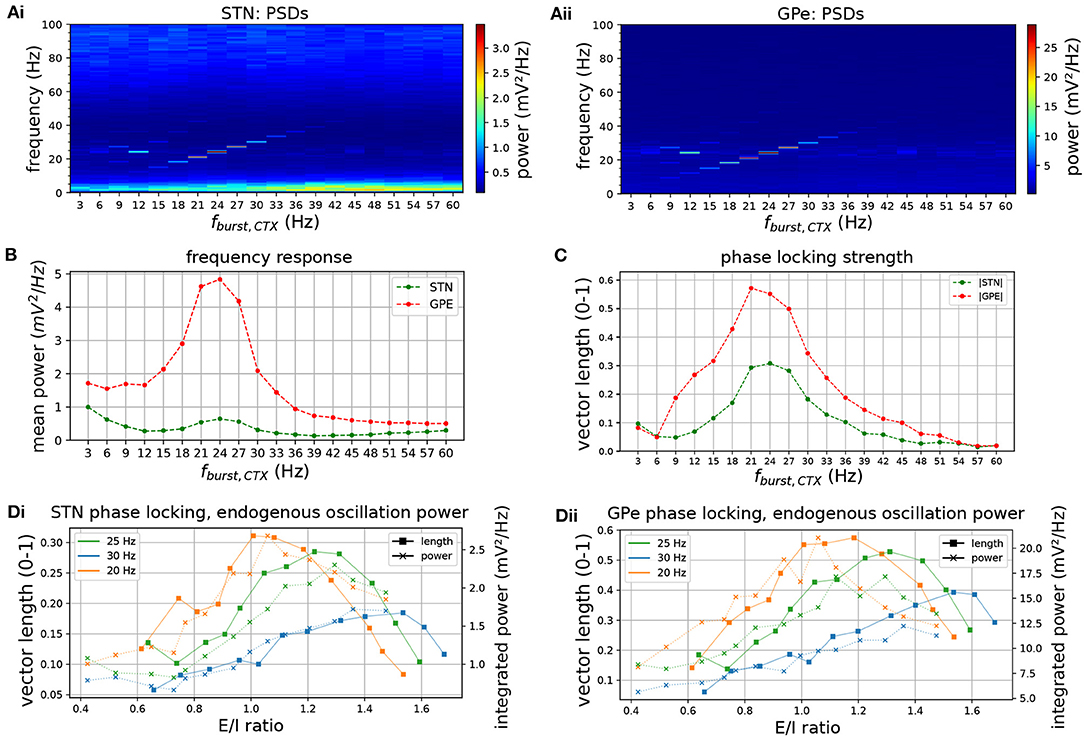
Figure 6. Frequency response and phase locking of the STN-GPe network to cortical oscillatory bursting inputs. Sweep of cortical oscillation frequency (top row) and phase locking to cortical oscillations for increasing CTX-STN synapse strength (bottom row). (A) Mean PSD of somatic membrane voltages in STN (Ai) and GPe (Aii) for increasing oscillatory bursting frequency. (B) Mean PSD of the somatic membrane voltages of STN (green) and GPe (red) neurons, averaged within a 5 Hz wide frequency band centered on the cortical oscillation frequency. (C) Population vector length, indicating strength of phase locking to the cortical oscillation of STN (green) and GPe (red) neurons. (D) Change in population vector length (solid lines) for a fixed cortical oscillation frequency (20 Hz, 25 hz, 30 Hz in green, blue, orange, respectively) and increasing CTX-STN input synaptic conductance, reflected in an increased ratio of excitation to inhibition (E/I ratio). Endogenous oscillation power in simulations without oscillatory cortical input is plotted for comparison (dotted lines, power integrated in 5 Hz band centered on cortical frequency in equivalent simulation with cortical inputs). An increased E/I ratio results in maximum phase locking at a higher oscillation frequency, and power of endogenous oscillations follows trend of phase locking strength.
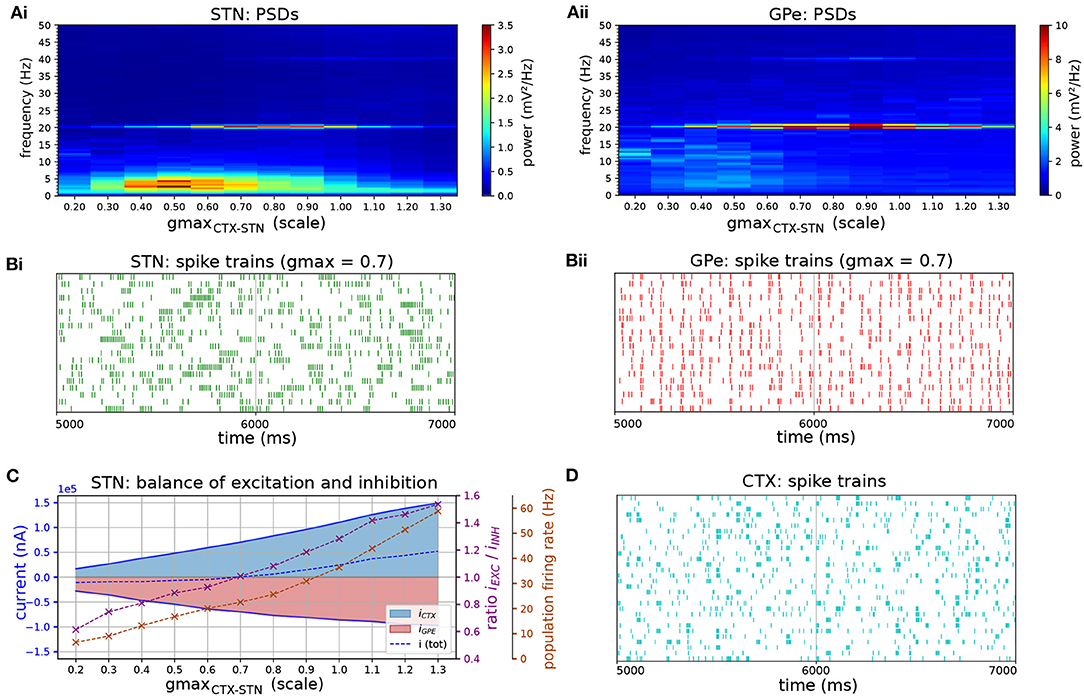
Figure 7. Response of STN-GPe network to cortical oscillatory bursting at 20 Hz. (A) Mean PSD of somatic membrane voltages in STN (Ai) and GPe (Aii) as a function of the synaptic conductance (scale factor) of CTX-STN inputs. The peak at 20 Hz reaches a maximum when synapses are at 70% of their baseline strength, whereas the peak in low-frequency power (2-5 Hz) occurs at 50%. (B) Representative spike trains of STN (Bi, green) and GPe neurons (Bii, red) in simulation with synaptic conductances scaled to 70%, corresponding to maximum phase locking and 20 Hz power. (C) Balance of excitation and inhibition in the STN (Ci) and GPe (Cii) based on synaptic currents recorded in three neurons. Population firing rate (brown), E/I ratio (purple), and net synaptic current (blue). (D) Cortical oscillatory bursting pattern illustrated using representative spike trains. In each cycle of the oscillation 10% of cells were selected at random to fire a burst in phase with the oscillation, with a variation of 1 ms on the onset and spike timings.
Influence of Phase Relationship Between Cortical and Striatal Beta Inputs
Striatal microcircuits exhibit beta-band oscillations in healthy primates (Feingold et al., 2015) and parkinsonian rodent models (McCarthy et al., 2011; Sharott et al., 2017) and have been hypothesized to be part of the pacemaking circuit that generates them. In the previous section, the STN-GPe network was shown to generate weak beta-band oscillations in the absence of exogenous beta inputs (Figures 2, 3, 4), and to phase lock to cortical beta-band inputs which amplified oscillatory activity (Figure 6). A potential role of the pallido-striatal loop could be to amplify beta-band oscillations in the STN-GPe network to a more pathological level, as part of a double resonant loop converging on the GPe. A suggested mechanism is that altered striatal activity in PD could shift the phase of firing of the GPe relative to the STN to one that supports STN phase locking through increasing the availability of Na+ and Ca2+ channels post-inhibition and pre-excitation (Baufreton et al., 2005; Mallet et al., 2008a, 2012). Alternatively, oscillations that originate in striatal circuits could be transmitted via the striato-pallidal projection and thus introduced into the STN-GPe network (McCarthy et al., 2011; Corbit et al., 2016). Of the two loops converging on GPe neurons, inhibitory striatal afferents would be better suited to interrupt ongoing activity and influence the phase compared to excitatory STN afferents. Hence, the iMSN to GPe projection could play an important role in patterning neural activity in the STN-GPe network.
Phase vector plots in the previous section show that STN and GPe neurons settle into a particular phase relationship where STN leads GPe by 60–90 degrees which contributed to sustaining beta-band oscillations. We hypothesized that inhibitory inputs from the striatum would either disrupt this phase relationship, thereby suppressing beta-band oscillations, or reinforce them depending on where in the phase of the beta oscillation they arrive. To investigate this hypothesis, surrogate striatal spike trains exhibiting beta frequency bursts were generated and the phase with respect to the incoming cortical oscillation was increased in increments of 45 degrees by varying the onset time of bursts. As iMSN-GPe synapses exhibit short-term facilitation, bursts administered through this projection led to an increase in inhibition to the GPe that was greater than the relative increase in spike rate. To compensate for this effect and maintain a physiological firing rate range of the GPe neurons, the peak conductance of iMSN-GPe synapses was reduced by 60%.
Varying the phase of striatal relative to cortical bursts revealed that populations connected by an inhibitory projection, i.e., iMSN, GPe, and STN maintained a rigid phase relationship with respect to the cortical oscillation (Figure 8: population vectors in green, red, purple formed a rigid frame that rotated relative to the cyan-colored cortical population vector). The local maximum in phase locking occurred when excitatory CTX and inhibitory GPe afferents to STN fired in anti-phase, occurring when the CTX-iMSN phase difference was set to 225 degrees (Figures 8B,D,Ei). This supports the feedback inhibition hypothesis where cortical patterning is promoted when GPe-STN inhibition is offset in phase relative to cortical excitation in PD (Baufreton et al., 2005; Mallet et al., 2008a, 2012). The changing phase relationship of cortical spiking relative to the three other populations also shifted the balance of excitatory and inhibitory currents in the STN (Figure 8Ai). Maximum phase locking occurred where the STN was maximally inhibited (E/I ratio ≈ 1.1, population firing rate ≈ 21 Hz), whereas minimum phase locking coincided with maximum excitation (E/I ratio ≈ 1.3, population firing rate ≈ 40 Hz). In the GPe this relationship between phase locking strength and firing rate was reversed (Figure 8Ai) whereas the relationship with E/I ratio showed no clear trend. The optimal phase relationship of 225 degrees further strengthened phase locking to the applied beta rhythm compared to the situation with only cortical oscillatory inputs. Maximum vector length was increased by a factor of two, confirming increased synchronization, in both populations when compared to the case where only cortical beta frequency inputs were simulated. Maximum power at the oscillation frequency was also increased by a factor of 2.7 in STN and 5.2 in GPe.
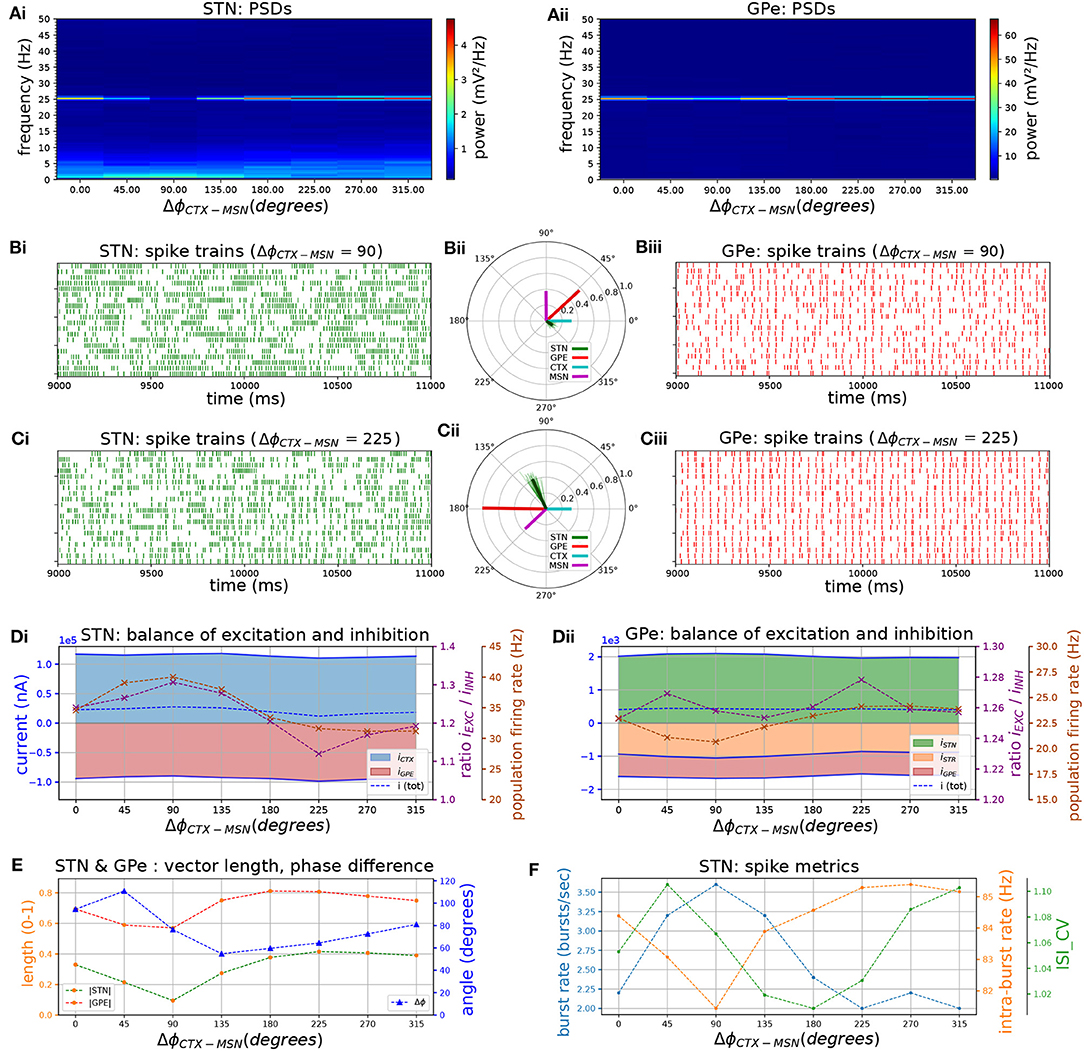
Figure 8. The phase relationship between cortical and striatal beta-band inputs to the STN-GPe network affects the strength of phase-locking by setting the relative timing of excitatory and inhibitory STN afferents. Response of the STN-GPe network to oscillatory bursting inputs applied via both cortico-subthalamic (CTX-STN) and striato-pallidal (iMSN-GPe) afferents. The phase difference between cortical and striatal oscillatory bursts was increased in steps of 45°. All phase vectors were measured with respect to the instantaneous phase of the cortical oscillation. (A) Mean PSD of the somatic membrane voltages of STN (Ai) and GPe (Aii) neurons, showing weakening and strengthening of oscillations as relative phases of inputs are rotated. (B,C) Representative spike trains and phase vectors of STN (column i, green) and GPe population (column iii, red) for CTX-iMSN phase difference of 90° (C) and 225° (D). Column ii shows phase vectors of the STN, GPe, CTX, iMSN populations (in green; red; blue; purple, respectively; mean population vectors plotted as thick solid lines and cell vectors as thin transparent lines). (D) Balance of excitation and inhibition in the STN (Di) and GPe (Dii) based on synaptic currents recorded in three neurons. Population firing rate (brown), E/I ratio (purple), and net synaptic current (blue). Shaded areas represent estimated total synaptic current from one pre-synaptic population during a simulation. (E) Population vector length and angle of STN (green) and GPe (red) population. (F) Metrics that characterize bursting in STN neurons: median burst rate, intra-burst firing rate, and coefficient of variation of ISIs across all STN cells.
Mechanism of Phase Locking
To further illustrate the interaction between synaptically coupled STN and GPe neurons in the model under conditions of synchronous oscillatory beta-band activity, the mechanism of phase locking of STN cells is presented in Figure 9. Pooled cortical spike trains (Figures 9A,B, green) illustrate how sparse cortical beta bursts (Figure 7B) result in distributed synaptic inputs to individual STN neurons that are not tightly phase locked, but have a combined firing rate that is modulated at the beta frequency. While these exogenous cortical inputs had high spike timing variability, STN and GPe spikes became highly structured and tightly locked to the beta oscillation through the feedback inhibition mechanism. The cortical beta modulation is transmitted to the STN and then to the GPe through their excitatory projections (see phase vectors in Figure 8Dii). When the inhibitory feedback arrives back in STN this shuts down spiking (Figure 9A) and simultaneously primes the cell for the next period of increased cortical excitation by de-inactivating Ca2+ channels (Figure 9C) and Na+ channels. As the cortical firing rate rises again, synaptic currents (Figure 9B) combine with dendritic Ca2+ currents to overcome any lingering inhibition and cause the next wave of phase-locked STN spikes. The striatal beta inputs further decreased spiking variability of GPe neurons by narrowing their time window of firing through phasic inhibition (purple phase vector in Figure 8Dii).
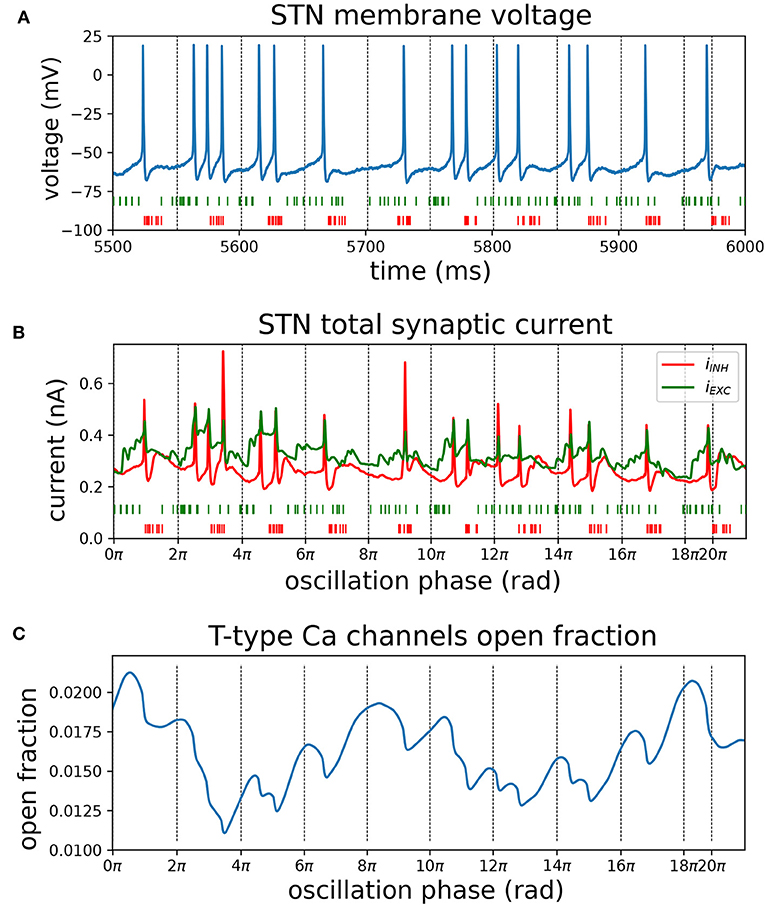
Figure 9. Mechanisms contributing to phase locking of STN cells to cortical beta oscillations. Recordings of synaptic currents and T-type calcium (CaT) channel inactivation from an identified phase-locked STN cell during a simulation with high phase locking (analogous to Figure 8D, cortical and striatal beta bursts at 20 Hz with phase difference of 225 degrees). Inactivation variables were recorded from each compartment with CaT ion channels and averaged over all compartments in the cell. Zero-crossings of the instantaneous beta phase are indicated using vertical dotted lines. (A) Somatic membrane voltage during phase-locked interval (blue). Spike trains from excitatory (green) and inhibitory (red) afferents to the cell were pooled. (B) Total excitatory and inhibitory synaptic current (in green; red, respectively) and pooled spike trains underneath. (C) Mean CaT channel inactivation across the cell's dendritic tree. High values correspond to de-inactivation. Transient de-inactivation approximately one half period after an inhibitory barrage engages depolarizing T-type Ca2+ current and contributes to phase-locked spiking.
Discussion
A new model of the STN-GPe network is presented that incorporates biophysically detailed multi-compartment cell models. The individual STN and GPE cell models capture the interaction of intrinsic and synaptic membrane currents with non-uniform subcellular distributions across the dendritic structure, which can not be captured in single compartment models. The model illustrates how phase locking of STN and GPe neurons, and increased bursting of STN neurons, can arise from the interaction of these currents when their relative strengths and temporal relationships are altered. The STN-GPe model network showed an intrinsic susceptibility to beta-band synchrony that manifest as weak, autonomously-generated endogenous oscillations and selective amplification of exogenous beta-band synaptic inputs at the network's preferred oscillation frequency. The frequency at which endogenous beta oscillatory activity occurred varied with the ratio of excitatory to inhibitory currents to the STN. Varying the phase relationships between external beta-frequency inputs to the network through cortical and striatal pathways further increased or suppressed the level of amplification of cortical beta inputs by modulating the temporal dispersion of action potentials in STN neurons and thereby influencing the precision of phase locking. Varying synaptic strengths within the network affected the balance of excitation and inhibition in both STN and GPe neurons and produced a rich set of behaviors, not only modulating firing rates but also affecting synchronization and bursting properties of neurons. Homeostatic mechanisms mediated by feedback connections and short-term synaptic plasticity dynamics served to stabilize the excitation-inhibition balance in the GPe and reduced the sensitivity of its population firing rate to variations in pre-synaptic rates.
Oscillatory Properties of the Multi-compartmental STN-GPe Network
In the autonomous STN-GPe network, under conditions of Poisson distributed external synaptic inputs, STN neurons exhibited weak synchronization to the endogenous beta rhythm but retained a weak phase preference with respect to the stronger oscillation in the GPe population (Figures 2–4). The synchronization strength of STN neurons was found to depend on the relative strength of GABAA and GABAB receptors in STN dendrites (Figure 5), with an increase in the proportion of fast-acting GABAA receptors resulting in an increase in the strength of oscillation. The endogenous oscillation frequency of the STN-GPe network was further influenced by the balance of excitatory and inhibitory currents in the STN. This balance affected the net level of excitatory drive in the network, shifting the oscillation frequency toward the higher beta range for increased levels of excitatory drive (Figures 2A, 5D). Besides affecting population firing rates and the frequency of synchronous oscillations, the excitation-inhibition balance also strongly influenced the firing pattern of STN neurons: for a low ratio of excitation to inhibition and sufficiently strong inhibitory currents, STN neurons transitioned to a firing mode characterized by low-frequency tight bursts (high intra-burst firing rate, Figures 2–4). Low-frequency bursting was periodic at 2–5 Hz but was not synchronized between cells. This shift in firing pattern toward sparse, tight bursting is in correspondence with changes in burst-related measures such as intra-burst firing rate and sub-beta band power that are most predictive of akinetic-bradykinetic symptoms in humans (Sharott et al., 2014) and monkeys (Sanders et al., 2013). The firing rate and pattern of GPe neurons was less sensitive than that of STN neurons to variations in its excitatory or inhibitory drive due to the contribution of negative feedback control by homeostatic mechanisms that operated in synergy to stabilize its E/I ratio. However, GPe neurons did synchronize more strongly under conditions of low excitatory drive from the STN enabling them to act more autonomously and synchronize through inhibitory collaterals within the GPe network.
When beta-band spiking inputs were applied to the STN-GPe network via cortico-STN afferents, the STN-GPe network phase locked to the beta rhythm. Frequencies near the autonomous oscillation frequency for a given E/I ratio were preferentially amplified, reflected in increased phase locking and power of the somatic membrane voltage at that frequency (Figure 6). This is supportive of experimental observations that oscillatory activity in STN is contingent on cortical oscillations (Magill et al., 2001), likely transmitted though the hyperdirect pathway (Tachibana et al., 2011). Phase locking and beta frequency power were further strengthened by the addition of striatal oscillatory inputs with a particular phase relationship to cortical oscillatory inputs (Figure 8). Maximum phase-locking occurred when GPe spiking was aligned in anti-phase with cortical inputs to the STN (Figures 8C,E). When excitation and inhibition occurred in anti-phase, inhibition was likely more effective at transiently hyperpolarizing the membranes of STN neurons, suggested by the local minimum in their E/I ratio (Figure 8Di). Strong hyperpolarization can evoke low-latency, temporally precise responses to an excitatory stimulus by de-inactivating Ca2+ and Na+ channels, and thereby priming them to respond to excitatory cortical inputs (Bevan et al., 2007). This mechanism may be responsible for the increase in phase locking under this phase relationship. In contrast, phase alignment of cortical and GPe neurons, corresponding to coincident firing, desynchronized STN neurons (Figure 8C). These findings are in agreement with recent experimental observations which demonstrate that co-stimulation of GABAergic and glutamergic STN afferents disperses STN spiking and has a desynchronizing effect on the population (Amadeus Steiner et al., 2019). Overall, the simulation results are consistent with the hypothesis of cortical patterning and resonance of beta activity within the STN-GPe network through feedback inhibition, whereby GPe inhibition arriving in anti-phase to cortical excitation promotes phase locking of STN neurons to beta-band cortical inputs (Baufreton et al., 2005).
Relation of Mechanism of Oscillations to Other Models of Oscillatory Activity in the STN-GPe Network
The mechanism by which oscillatory neural activity can be generated in the STN-GPe network, by alternating phases of excitation and inhibition in a delayed negative feedback loop, has been described in previous models (Terman et al., 2002; Holgado et al., 2010; Kumar et al., 2011). The mechanism of oscillation in the model presented here is consistent with this, and the model additionally illustrates the dual role of precisely timed GPe inhibition in transiently reducing STN neuron excitability and hyperpolarizing them such that they are primed to respond with bursting to excitatory cortical inputs (Figure 9). Furthermore, it highlights the sensitivity of the network oscillation to the excitation-inhibition balance in each population and synaptic current properties.
In the multicompartment model, endogenously generated beta frequency oscillations were generated within the STN-GPe network when the strength of short duration GABAA-mediated currents was increased. Since the slow timescale, signaling cascade-mediated GABAB currents are typically not modeled, this result can be easily reconciled with results from single-compartment and firing rate models where high gain within the closed-loop is a necessary condition for strong endogenously-generated oscillations in the STN-GPe network (Holgado et al., 2010; Park et al., 2011; Pavlides et al., 2012; Wei et al., 2015). The strength of the endogenous oscillations in our model was relatively weak, except when inhibitory GPe-STN currents were strongly dominated by fast-acting GABAA-mediated currents and GABAB-mediated slow currents were weak. The oscillation frequency of the network could be modulated by varying the ratio of excitation to inhibition in STN and GPe, and increased as this ratio increased (Figure 6).
The oscillation frequency of the network has been shown to be sensitive to model parameters in previous computational models of the BGTC network. Specifically, in mean field models of the STN-GPe loop the oscillation frequency showed a strong sensitivity to transmission delays and neuronal membrane time constants (Holgado et al., 2010; Liénard et al., 2017), and a weaker sensitivity to coupling strengths (Holgado et al., 2010; Pavlides et al., 2015; Liu et al., 2017), also demonstrated in a spiking model (Wei et al., 2015). In the multicompartment model presented here, where active ion channels on the dendrites contribute to synaptic integration, synaptic strength and effective membrane time constant are interdependent since the membrane charging speed is affected by transient activation of ion channels as a response to synaptic inputs. In biological neurons the balance of excitation and inhibition is tightly regulated through multiple adaptive processes (Turrigiano, 2011), and likely maintains the range of possible oscillation frequencies within a narrow range.
Other than the condition where GPe-STN currents were dominated by fast-acting GABAA currents, strongly synchronized beta-band oscillations appeared only when exogenous beta-band inputs were introduced to the network (Figures 6, 8). These results, therefore, support a role for resonance with oscillations throughout other basal ganglia loops in the generation of increased STN-GPe beta activity in Parkinson's disease. Such an oscillatory drive can be provided either by an extrinsic oscillator, assumed to originate within the cortex in the present model, or by reverberation of oscillations in connected feedback loops such as the pallido-striatal loop (Corbit et al., 2016), intra-striatal loops (McCarthy et al., 2011), or the larger thalamocortical loop (Dovzhenok and Rubchinsky, 2012; Kang and Lowery, 2013; Pavlides et al., 2015; Reis et al., 2019). The model exhibited clear resonance in response to excitatory synaptic inputs to the STN within the beta frequency range (Figure 6). The frequency at which the maximum resonance occurred increased with increasing ratio of excitation to inhibition, similar to the increase in frequency observed in the case of endogenously generated oscillations. Resonance phenomena in the beta-band have previously been reported in computational models of basal ganglia networks, consistent with our modeling results: Pavlides et al. (2015) fitted mean field rate models to experimental data from non-human primates and found that the models that best explained the data relied on a strong cortical oscillation to sustain beta-band oscillations (~15 Hz) in the network. In a comparable mean-field model, Liu et al. (2017) found that upper beta-band (21–35 Hz) oscillations in the STN-GPe loop originated from cortical oscillatory inputs and supported a lower beta-band (12–20 Hz) oscillation that was endogenously generated. Ahn et al. (2016) using 10 single compartment STN and GPe neurons observed multiple resonances in the beta-band when varying the strength of striato-pallidal and pallida-subthalamic inhibition, with resonant peaks occurring consistently between 18 and 21 Hz. Similarly, Fountas and Shanahan (2017) found that STN neurons in their model exhibited high spontaneous beta-band power (18–30 Hz) and synchronized selectively with cortical input in this frequency range.
Model Complexity and Limitations
One of the main advantages of the biophysically detailed model presented here is that the model can capture the non-uniform distribution of afferent inputs from different pre-synaptic populations across the dendritic tree (Tables 3, 5). This targeting of specific regions of the dendrites by different populations can lead to variations in synaptic integration properties within the structure. This feature is potentially of particular importance in the generation of pathological oscillations given that neuronal phase response curves, used to quantify the tendency of neurons to synchronize to their inputs, differ when stimuli are applied to different subcellular regions in STN and GPe neurons (Schultheiss et al., 2010; Farries and Wilson, 2012). Hence, a model that incorporates a full complement of ion channel and the synapse groups that interact with them may be expected to yield a more realistic representation of how synchronization arises in the network. In future studies, this could also contribute to a better understanding of neuronal currents contributing to the local field potential in synchronized and asynchronous states, as synaptic and ionic transmembrane currents combine to form the extracellular currents that underpin this signal (Buzsáki et al., 2012).
A second advantage of such detailed multicompartment models is that parameters have a clear relationship to the underlying biophysical system and are more meaningful in terms of physiological processes compared to models where parameters are lumped, as in single-compartment conductance-based models, or abstracted as in mean-field or generalized integrate-and-fire models. This allows for a more direct translation of experimental findings to parameter variations in the model. On the other hand, detailed cell models are more sensitive to correct estimation of these parameters which is limited by measurements performed for the purpose of model fitting as well as the fitting procedures themselves. Biophysically detailed models offer new ways to study factors contributing to the development of synchrony. Such models provide a means to investigate the relative contributions of physiological mechanisms to the development of synchrony while controlling other factors in a manner that is not possible in vivo. Though the model presented incorporates a higher level of physiological detail than previous models of the STN-GPe network, several simplifications were necessary due to the model complexity, which should be considered.
Downregulation of HCN channel currents with dopamine depletion was modeled as a decrease in its peak conductance. However, dopamine is known to interact with several more ion channels that are involved in linearizing the current-firing rate curve and regularizing autonomous pacemaking of STN neurons (Loucif et al., 2008; Ramanathan et al., 2008; Yang et al., 2016) which are not included in the STN cell model used here (Gillies and Willshaw, 2005). Recent evidence suggests that the loss of autonomous spiking is a necessary condition for the exaggerated cortical patterning of STN related to motor dysfunction (McIver et al., 2018). Better characterization of the ion channels involved in pacemaking and their response to dopamine depletion will enable the systematic exploration of their contribution to STN response properties and pathological firing patterns.
In our network model the main sources of firing rate variability were randomness in the input spiking patterns, the presence of surrogate Poisson spike sources in STN and GPe, membrane noise, and randomness in connection patterns and the position of synapses. However these factors do not capture the full biological variability in morpho-electric cell types, synaptic strength distributions, and resulting firing patterns in each population. In the GPe, two distinct populations have been identified based on their molecular profile and axonal connectivity (Mallet et al., 2012). Only the prototypic sub-population projecting mainly to STN and preferentially firing in anti-phase to it was modeled here, with the arkypallidal sub-populations projecting back to striatum omitted. Moreover, the GPe cell model used was only one representative candidate out of a large set of models with varying ion channel expression and morphology that matched a corresponding database of electrophysiological recordings (Gunay et al., 2008). Similarly, the STN model represents a stereotypic characterization rather than a reconstruction of a specific STN cell and does not capture variability in firing properties and receptor expression. In particular, STN neurons in vivo are known to have variable expression of GABAB receptors (Galvan et al., 2004) which cause strong hyperpolarization responses and longer pauses in some but not all STN neurons (Hallworth and Bevan, 2005) and a strong rebound burst response (Galvan et al., 2004) in a subset of these. A model that accounts for the biological variability in GABAB expression and that of channels underlying the rebound response may reveal a wider range of responses to increased inhibition among STN neurons. In such a model, beta rhythms could be transmitted to a subset of STN neurons whereas others would show longer pauses with stronger rebound bursts. Moreover, the GABAB synapse model used does not fully account for activation of extrasynaptic GABABR due to GABA spillover (Galvan et al., 2004) which is mediated by tonic high-frequency and coincident firing of afferents (Bevan et al., 2006). A model where multiple GABAergic synapses act on a shared pool of extrasynaptic GABABR might increase the importance of synchronized pre-synaptic activity in switching STN neurons to a burst-firing mode.
The effect of the correlation between cortical and striatal inputs to the network was explored by varying the relative phases of both populations when firing in a synchronous oscillatory pattern (Figure 8). Uncorrelated firing between both populations was also explored (Figures 2–7). In reality, beta activity in both populations is likely to be correlated as the striatum receives topographic inputs from the same cortical areas projecting to the STN. Such correlation could lead to transient synchronization effects not explored here, that could promote or counteract additional oscillatory synchronization depending on the exact phase relationships. The effect of varying connectivity patterns between neuronal populations was not directly explored here. The development of neural synchronization and oscillatory activity are known to be dependent on network topology (Zhao et al., 2011), and this effect has previously been studied in a single compartment model of the STN-GPe network (Terman et al., 2002). The network topology used in the present study is closest to the random, sparsely-connected topology in Terman et al. (2002) which was shown to develop synchronized bursting patterns at lower frequencies. Choosing different randomly-generated connection matrices did not qualitatively change our results, however altering the connection topology would likely lead to different synchronization properties. Moreover, it is known that connection patterns within the basal ganglia are altered with dopamine depletion, particularly within the striatum (Cho et al., 2002), leading to a loss of input specificity in neuronal responses (Bronfeld and Bar-Gad, 2011). These alterations in connection patterns and resulting effects on spike correlations were not taken into account as we did not consider cortico-striatal connectivity in our model. As arkypallidal GPe neurons were not modeled, the pallido-striatal feedback loop was not captured. This additional feedback loop has also been suggested as a candidate pacemaker circuit for beta-band oscillations (Corbit et al., 2016), however, blocking of striatal inputs was not found to reduce the power of beta oscillations in rat GPe (Tachibana et al., 2011).
Finally, while there is consistent evidence of increased beta-band oscillatory activity in Parkinsons disease (Sharott et al., 2005; Mallet et al., 2008b) and a reduction of pathological beta band activity with interventions that improve symptoms in patients and animal models of the disease (Kühn et al., 2006; Weinberger et al., 2006; Ray et al., 2008; Eusebio et al., 2011), strong evidence in support of a causal role for pathological beta activity in the symptoms of Parkinsons disease has yet to be established. Indeed, recent studies failed to find evidence of any causal link between artificially induced beta band activity and motor impairment in parkinsonian rats (Swan et al., 2019), nor between the reduction of beta band activity and alleviation of motor symptoms (Pan et al., 2016). A lack of causality, however, may not necessarily be incompatible with the use of beta-band oscillations as a clinical biomarker, particularly for akinetic-bradykinetic forms of Parkinson's Disease at advanced stages of disease progression. Initial trials of adaptive or closed-loop DBS strategies targeted at suppression of beta-band activity have been successful in demonstrating simultaneous reductions in patient symptoms (Little et al., 2013; Velisar et al., 2019). Beta-band power may thus still be a suitable biomarker to indirectly gauge underlying physiological changes that are more directly related to network dysfunction such as alterations in synaptic strengths and functional connectivity within the network.
Sharott et al. (2005), Mallet et al. (2008b), and Kuhn et al. (2008), and are reduced by DBS and pharmacological interventions that alleviate parkinsonian motor symptoms (Kühn et al., 2006; Weinberger et al., 2006; Ray et al., 2008; Eusebio et al., 2011).
Conclusion
In summary, a biophysically detailed model of the parkinsonian STN-GPe network is presented which captures non-uniform distribution of ion channels and synapses in neuronal dendrites. The network model exhibited an intrinsic susceptibility to synchronous neural oscillations within the frequency range of pathological beta-band activity observed in Parkinson's disease. Oscillations in the autonomous STN-GPe network, however, were too weak to support a pacemaker role as the sole origin of beta-band oscillations in the wider BGTC network in Parkinson's disease. In particular in the STN, autonomous beta-band oscillations and phase locking of individual cells were weak unless slower GABAB-mediated currents were substantially reduced. Beta-band oscillations were considerably amplified by a relatively sparse cortical beta input, with clear resonance occurring within the beta frequency range. The frequency at which the resonant peak occurred increased with increasing ratio of excitatory to inhibitory STN inputs. beta-band oscillations were further amplified by striatal beta inputs that promoted anti-phase firing of cortex and GPe. These results support the cortical patterning and network resonance hypothesis for the generation of pathological beta-band oscillatory activity in Parkinson's disease in a multi-compartment model of the STN-GPe network. They also illustrate the potential of the pallido-striatal feedback loop in further amplifying beta oscillations within the network.
Data Availability Statement
The datasets generated for this study are available on request to the corresponding author.
Author Contributions
All experiments were performed in the Neuromuscular Systems Laboratory in University College Dublin, Ireland. LK and ML: conceived and designed the experiments, interpreted results of experiments, prepared the figures, edited and revised the manuscript, and approved the final version of manuscript. LK: performed experiments and analyzed data and drafted the manuscript.
Funding
This work was supported by the European Research Council (ERC) under the European Union's Horizon 2020 research and innovation programme (grant ERC-2014-CoG-646923-DBSModel).
Conflict of Interest
The authors declare that the research was conducted in the absence of any commercial or financial relationships that could be construed as a potential conflict of interest.
Acknowledgments
This manuscript has been released as a pre-print at BioRxiv 611103 (Koelman and Lowery, 2019).
References
Abdi, A., Mallet, N., Mohamed, F. Y., Sharott, A., Dodson, P. D., Nakamura, K. C., et al. (2015). Prototypic and arkypallidal neurons in the dopamine-intact external globus pallidus. J. Neurosci. 35, 6667–6688. doi: 10.1523/JNEUROSCI.4662-14.2015
Ahn, S., Zauber, S. E., Worth, R. M., and Rubchinsky, L. L. (2016). Synchronized beta-band oscillations in a model of the globus pallidus-subthalamic nucleus network under external input. Front. Comput. Neurosci. 10:134. doi: 10.3389/fncom.2016.00134
Amadeus Steiner, L., Barreda Tomás, F. J., Planert, H., Alle, H., Vida, I., and Geiger, J. R. P. (2019). Connectivity and dynamics underlying synaptic control of the subthalamic Nucleus. J. Neurosci. 39, 2470–2481. doi: 10.1523/JNEUROSCI.1642-18.2019
Atherton, J. F., Menard, A., Urbain, N., and Bevan, M. D. (2013). Short-term depression of external globus pallidus-subthalamic nucleus synaptic transmission and implications for patterning subthalamic activity. J. Neurosci. 33, 7130–7144. doi: 10.1523/JNEUROSCI.3576-12.2013
Baufreton, J., Atherton, J. F., Surmeier, D. J., and Bevan, M. D. (2005). Enhancement of excitatory synaptic integration by GABAergic inhibition in the subthalamic nucleus. J. Neurosci. 25, 8505–8517. doi: 10.1523/JNEUROSCI.1163-05.2005
Baufreton, J., and Bevan, M. D. (2008). D2-like dopamine receptor-mediated modulation of activity-dependent plasticity at GABAergic synapses in the subthalamic nucleus: dopaminergic modulation of synaptic plasticity in the subthalamus. J. Physiol. 586, 2121–2142. doi: 10.1113/jphysiol.2008.151118
Baufreton, J., Kirkham, E., Atherton, J. F., Menard, A., Magill, P. J., Bolam, J. P., et al. (2009). Sparse but selective and potent synaptic transmission from the globus pallidus to the subthalamic nucleus. J. Neurophysiol. 102, 532–545. doi: 10.1152/jn.00305.2009
Benabid, A. L., Chabardes, S., Mitrofanis, J., and Pollak, P. (2009). Deep brain stimulation of the subthalamic nucleus for the treatment of Parkinson's disease. Lancet Neurol. 8, 67–81. doi: 10.1016/S1474-4422(08)70291-6
Bevan, M. D., Atherton, J. F., and Baufreton, J. (2006). Cellular principles underlying normal and pathological activity in the subthalamic nucleus. Curr. Opin. Neurobiol. 16, 621–628. doi: 10.1016/j.conb.2006.10.003
Bevan, M. D., Francis, C. M., and Bolam, J. P. (1995). The glutamate-enriched cortical and thalamic input to neurons in the subthalamic nucleus of the rat: convergence with GABA-positive terminals. J. Comp. Neurol. 361, 491–511. doi: 10.1002/cne.903610312
Bevan, M. D., Hallworth, N. E., and Baufreton, J. (2007). “GABAergic control of the subthalamic nucleus,” in Progress in Brain Research, Vol. 160, eds J. M. Tepper, E. D. Abercrombie, and J. P. Bolam (Amsterdam: Elsevier), 173–188. doi: 10.1016/S0079-6123(06)60010-1
Bronfeld, M., and Bar-Gad, I. (2011). Loss of specificity in basal ganglia related movement disorders. Front. Syst. Neurosci. 5:38. doi: 10.3389/fnsys.2011.00038
Bronte-Stewart, H., Barberini, C., Koop, M. M., Hill, B. C., Henderson, J. M., and Wingeier, B. (2009). The STN beta-band profile in Parkinson's disease is stationary and shows prolonged attenuation after deep brain stimulation. Exp. Neurol. 215, 20–28. doi: 10.1016/j.expneurol.2008.09.008
Buzsáki, G., Anastassiou, C. A., and Koch, C. (2012). The origin of extracellular fields and currents — EEG, ECoG, LFP and spikes. Nat. Rev. Neurosci. 13, 407–420. doi: 10.1038/nrn3241
Chan, C. S. (2004). HCN2 and HCN1 channels govern the regularity of autonomous pacemaking and synaptic resetting in globus pallidus neurons. J. Neurosci. 24, 9921–9932. doi: 10.1523/JNEUROSCI.2162-04.2004
Chan, C. S., Glajch, K. E., Gertler, T. S., Guzman, J. N., Mercer, J. N., Lewis, A. S., et al. (2011). HCN channelopathy in external globus pallidus neurons in models of Parkinson's disease. Nat. Neurosci. 14, 85–92. doi: 10.1038/nn.2692
Cho, J., Duke, D., Manzino, L., Sonsalla, P. K., and West, M. O. (2002). Dopamine depletion causes fragmented clustering of neurons in the sensorimotor striatum: evidence of lasting reorganization of corticostriatal input. J. Comp. Neurol. 452, 24–37. doi: 10.1002/cne.10349
Chu, H.-Y., Atherton, J. F., Wokosin, D., Surmeier, D. J., and Bevan, M. D. (2015). Heterosynaptic regulation of external globus pallidus inputs to the subthalamic nucleus by the motor cortex. Neuron 85, 364–376. doi: 10.1016/j.neuron.2014.12.022
Chu, H.-Y., McIver, E. L., Kovaleski, R. F., Atherton, J. F., and Bevan, M. D. (2017). Loss of hyperdirect pathway cortico-subthalamic inputs following degeneration of midbrain dopamine neurons. Neuron 95, 1306.e5–1318.e5. doi: 10.1016/j.neuron.2017.08.038
Cooper, A., and Stanford, I. (2001). Dopamine D2 receptor mediated presynaptic inhibition of striatopallidal GABAA IPSCs in vitro. Neuropharmacology 41, 62–71. doi: 10.1016/S0028-3908(01)00038-7
Corbit, V. L., Whalen, T. C., Zitelli, K. T., Crilly, S. Y., Rubin, J. E., and Gittis, A. H. (2016). Pallidostriatal projections promote oscillations in a dopamine-depleted biophysical network model. J. Neurosci. 36, 5556–5571. doi: 10.1523/JNEUROSCI.0339-16.2016
Cragg, S. J., Baufreton, J., Xue, Y., Bolam, J. P., and Bevan, M. D. (2004). Synaptic release of dopamine in the subthalamic nucleus. Eur. J. Neurosci. 20, 1788–1802. doi: 10.1111/j.1460-9568.2004.03629.x
Destexhe, A., and Sejnowski, T. J. (1995). G protein activation kinetics and spillover of gamma-aminobutyric acid may account for differences between inhibitory responses in the hippocampus and thalamus. Proc. Natl. Acad. Sci. U.S.A. 92, 9515–9519. doi: 10.1073/pnas.92.21.9515
Dovzhenok, A., and Rubchinsky, L. L. (2012). On the origin of tremor in Parkinson's disease. PLoS ONE 7:e41598. doi: 10.1371/journal.pone.0041598
Drouot, X., Oshino, S., Jarraya, B., Besret, L., Kishima, H., Remy, P., et al. (2004). Functional recovery in a primate model of Parkinson's disease following motor cortex stimulation. Neuron 44, 769–778. doi: 10.1016/j.neuron.2004.11.023
Eusebio, A., Thevathasan, W., Doyle Gaynor, L., Pogosyan, A., Bye, E., Foltynie, T., et al. (2011). Deep brain stimulation can suppress pathological synchronisation in parkinsonian patients. J. Neurol. Neurosurg. Psychiatry 82, 569–573. doi: 10.1136/jnnp.2010.217489
Fan, K. Y., Baufreton, J., Surmeier, D. J., Chan, C. S., and Bevan, M. D. (2012). Proliferation of external globus pallidus-subthalamic nucleus synapses following degeneration of midbrain dopamine neurons. J. Neurosci. 32, 13718–13728. doi: 10.1523/JNEUROSCI.5750-11.2012
Farries, M. A., and Wilson, C. J. (2012). Phase response curves of subthalamic neurons measured with synaptic input and current injection. J. Neurophysiol. 108, 1822–1837. doi: 10.1152/jn.00053.2012
Feingold, J., Gibson, D. J., DePasquale, B., and Graybiel, A. M. (2015). Bursts of beta oscillation differentiate postperformance activity in the striatum and motor cortex of monkeys performing movement tasks. Proc. Natl. Acad. Sci. U.S.A. 112, 13687–13692. doi: 10.1073/pnas.1517629112
Fieblinger, T., Graves, S. M., Sebel, L. E., Alcacer, C., Plotkin, J. L., Gertler, T. S., et al. (2014). Cell type-specific plasticity of striatal projection neurons in Parkinsonism and L-DOPA-induced dyskinesia. Nat. Commun. 5:5316. doi: 10.1038/ncomms6316
Flint, A. C., Maisch, U. S., Weishaupt, J. H., Kriegstein, A. R., and Monyer, H. (1997). NR2A subunit expression shortens NMDA receptor synaptic currents in developing neocortex. J. Neurosci. 17, 2469–2476. doi: 10.1523/JNEUROSCI.17-07-02469.1997
Fountas, Z., and Shanahan, M. (2017). The role of cortical oscillations in a spiking neural network model of the basal ganglia. PLoS ONE 12:e0189109. doi: 10.1371/journal.pone.0189109
Froux, L., Le Bon-Jego, M., Miguelez, C., Normand, E., Morin, S., Fioramonti, S., et al. (2018). D5 dopamine receptors control glutamatergic AMPA transmission between the motor cortex and subthalamic nucleus. Sci. Rep. 8:8858. doi: 10.1038/s41598-018-27195-6
Fujimoto, K., and Kita, H. (1993). Response characteristics of subthalamic neurons to the stimulation of the sensorimotor cortex in the rat. Brain Res. 609, 185–192. doi: 10.1016/0006-8993(93)90872-K
Galvan, A., Charara, A., Pare, J.-F., Levey, A., and Smith, Y. (2004). Differential subcellular and subsynaptic distribution of GABAA and GABAB receptors in the monkey subthalamic nucleus. Neuroscience 127, 709–721. doi: 10.1016/j.neuroscience.2004.05.014
Gillies, A., and Willshaw, D. (2005). Membrane channel interactions underlying rat subthalamic projection neuron rhythmic and bursting activity. J. Neurophysiol. 95, 2352–2365. doi: 10.1152/jn.00525.2005
Gillies, A., and Willshaw, D. (2007). Neuroinformatics and modeling of the basal ganglia: bridging pharmacology and physiology. Expert Rev. Med. Devices 4, 663–672. doi: 10.1586/17434440.4.5.663
Gillies, A., Willshaw, D., and Li, Z. (2002). Subthalamic-pallidal interactions are critical in determining normal and abnormal functioning of the basal ganglia. Proc. R. Soc. B Biol. Sci. 269, 545–551. doi: 10.1098/rspb.2001.1817
Gradinaru, V., Mogri, M., Thompson, K. R., Henderson, J. M., and Deisseroth, K. (2009). Optical deconstruction of parkinsonian neural circuitry. Science 324, 354–359. doi: 10.1126/science.1167093
Gunay, C., Edgerton, J. R., and Jaeger, D. (2008). Channel density distributions explain spiking variability in the globus pallidus: a combined physiology and computer simulation database approach. J. Neurosci. 28, 7476–7491. doi: 10.1523/JNEUROSCI.4198-07.2008
Hallworth, N. E., and Bevan, M. D. (2005). Globus pallidus neurons dynamically regulate the activity pattern of subthalamic nucleus neurons through the frequency-dependent activation of postsynaptic GABAA and GABAB receptors. J. Neurosci. 25, 6304–6315. doi: 10.1523/JNEUROSCI.0450-05.2005
Hanson, J. E., and Jaeger, D. (2002). Short-term plasticity shapes the response to simulated normal and Parkinsonian input patterns in the globus pallidus. J. Neurosci. 22, 5164–5172. doi: 10.1523/JNEUROSCI.22-12-05164.2002
Hernández, A., Ibáñez-Sandoval, O., Sierra, A., Valdiosera, R., Tapia, D., Anaya, V., et al. (2006). Control of the subthalamic innervation of the rat globus pallidus by D 2/3 and D 4 dopamine receptors. J. Neurophysiol. 96, 2877–2888. doi: 10.1152/jn.00664.2006
Hines, M. L., and Carnevale, N. T. (1997). The NEURON simulation environment. Neural Comput. 9, 1179–1209. doi: 10.1162/neco.1997.9.6.1179
Holgado, A. J. N., Terry, J. R., and Bogacz, R. (2010). Conditions for the generation of beta oscillations in the subthalamic nucleus-globus pallidus network. J. Neurosci. 30, 12340–12352. doi: 10.1523/JNEUROSCI.0817-10.2010
Jahr, C., and Stevens, C. (1990). Voltage dependence of NMDA-activated macroscopic conductances predicted by single-channel kinetics. J. Neurosci. 10(9):3178–3182. doi: 10.1523/JNEUROSCI.10-09-03178.1990
Johnson, P. I., and Napier, T. C. (1997). GABA- and glutamate-evoked responses in the rat ventral pallidum are modulated by dopamine. Eur. J. Neurosci. 9, 1397–1406. doi: 10.1111/j.1460-9568.1997.tb01494.x
Kang, G., and Lowery, M. M. (2013). Interaction of oscillations, and their suppression via deep brain stimulation, in a model of the cortico-basal ganglia network. IEEE Trans. Neural Syst. Rehab. Eng. 21, 244–253. doi: 10.1109/TNSRE.2013.2241791
Kita, H. (2007). “Globus pallidus external segment,” in Progress in Brain Research, Vol. 160, eds J. M. Tepper, E. D. Abercrombie, and J. P. Bolam (Amsterdam: Elsevier), 111–133. doi: 10.1016/S0079-6123(06)60007-1
Kita, H., and Jaeger, D. (2016). “Organization of the globus pallidus,” in Handbook of Behavioral Neuroscience, Vol. 24, eds H. Steiner and K. Y. Tseng (Amsterdam: Elsevier), 259–276. doi: 10.1016/B978-0-12-802206-1.00013-1
Kita, H., and Kita, T. (2011). Cortical stimulation evokes abnormal responses in the dopamine-depleted rat basal ganglia. J. Neurosci. 31, 10311–10322. doi: 10.1523/JNEUROSCI.0915-11.2011
Kita, H., and Kitai, S. (1991). Intracellular study of rat globus pallidus neurons: Membrane properties and responses to neostriatal, subthalamic and nigral stimulation. Brain Res. 564, 296–305. doi: 10.1016/0006-8993(91)91466-E
Koelman, L. A., and Lowery, M. M. (2019). Autonomous oscillations and phase-locking in a biophysically detailed model of the STN-GPe network. bioRxiv. doi: 10.1101/611103
Kuhn, A. A., Kempf, F., Brucke, C., Gaynor Doyle, L., Martinez-Torres, I., Pogosyan, A., et al. (2008). High-frequency stimulation of the subthalamic nucleus suppresses oscillatory activity in patients with Parkinson's disease in parallel with improvement in motor performance. J. Neurosci. 28, 6165–6173. doi: 10.1523/JNEUROSCI.0282-08.2008
Kühn, A. A., Kupsch, A., Schneider, G.-H., and Brown, P. (2006). Reduction in subthalamic 8-35 Hz oscillatory activity correlates with clinical improvement in Parkinson's disease: STN activity and motor improvement. Eur. J. Neurosci. 23, 1956–1960. doi: 10.1111/j.1460-9568.2006.04717.x
Kumar, A., Cardanobile, S., Rotter, S., and Aertsen, A. (2011). The role of inhibition in generating and controlling Parkinson's disease oscillations in the basal ganglia. Front. Syst. Neurosci 5:86. doi: 10.3389/fnsys.2011.00086
Kumaravelu, K., Brocker, D. T., and Grill, W. M. (2016). A biophysical model of the cortex-basal ganglia-thalamus network in the 6-OHDA lesioned rat model of Parkinson's disease. J. Comput. Neurosci. 40, 207–229. doi: 10.1007/s10827-016-0593-9
Leblois, A. (2006). Competition between feedback loops underlies normal and pathological dynamics in the basal ganglia. J. Neurosci. 26, 3567–3583. doi: 10.1523/JNEUROSCI.5050-05.2006
Leblois, A., Meissner, W., Bioulac, B., Gross, C. E., Hansel, D., and Boraud, T. (2007). Late emergence of synchronized oscillatory activity in the pallidum during progressive parkinsonism: pallidal activity during progressive parkinsonism. Eur. J. Neurosci. 26, 1701–1713. doi: 10.1111/j.1460-9568.2007.05777.x
Li, Q., Ke, Y., Chan, D. C., Qian, Z.-M., Yung, K. K., Ko, H., et al. (2012). Therapeutic deep brain stimulation in Parkinsonian rats directly influences motor cortex. Neuron 76, 1030–1041. doi: 10.1016/j.neuron.2012.09.032
Liénard, J. F., Cos, I., and Girard, B. (2017). Beta-band oscillations without pathways: the opposing roles of D2 and D5 receptors. bioRxiv. doi: 10.1101/161661
Little, S., Pogosyan, A., Neal, S., Zavala, B., Zrinzo, L., Hariz, M., et al. (2013). Adaptive deep brain stimulation in advanced Parkinson disease: adaptive DBS in PD. Ann. Neurol. 74, 449–457. doi: 10.1002/ana.23951
Litvak, V., Jha, A., Eusebio, A., Oostenveld, R., Foltynie, T., Limousin, P., et al. (2011). Resting oscillatory cortico-subthalamic connectivity in patients with Parkinson's disease. Brain 134, 359–374. doi: 10.1093/brain/awq332
Liu, C., Zhu, Y., Liu, F., Wang, J., Li, H., Deng, B., et al. (2017). Neural mass models describing possible origin of the excessive beta oscillations correlated with Parkinsonian state. Neural Netw. 88, 65–73. doi: 10.1016/j.neunet.2017.01.011
Loucif, A. J., Woodhall, G. L., Sehirli, U. S., and Stanford, I. M. (2008). Depolarisation and suppression of burst firing activity in the mouse subthalamic nucleus by dopamine D1/D5 receptor activation of a cyclic-nucleotide gated non-specific cation conductance. Neuropharmacology 55, 94–105. doi: 10.1016/j.neuropharm.2008.04.025
Magill, P., Bolam, J., and Bevan, M. (2001). Dopamine regulates the impact of the cerebral cortex on the subthalamic nucleus–globus pallidus network. Neuroscience 106, 313–330. doi: 10.1016/S0306-4522(01)00281-0
Magill, P. J., Sharott, A., Bolam, J. P., and Brown, P. (2004). Brain State–dependency of coherent oscillatory activity in the cerebral cortex and basal ganglia of the rat. J. Neurophysiol. 92, 2122–2136. doi: 10.1152/jn.00333.2004
Mallet, N., Micklem, B. R., Henny, P., Brown, M. T., Williams, C., Bolam, J. P., et al. (2012). Dichotomous organization of the external globus pallidus. Neuron 74, 1075–1086. doi: 10.1016/j.neuron.2012.04.027
Mallet, N., Pogosyan, A., Marton, L. F., Bolam, J. P., Brown, P., and Magill, P. J. (2008a). Parkinsonian beta oscillations in the external globus pallidus and their relationship with subthalamic nucleus activity. J. Neurosci. 28, 14245–14258. doi: 10.1523/JNEUROSCI.4199-08.2008
Mallet, N., Pogosyan, A., Sharott, A., Csicsvari, J., Bolam, J. P., Brown, P., et al. (2008b). Disrupted dopamine transmission and the emergence of exaggerated beta oscillations in subthalamic nucleus and cerebral cortex. J. Neurosci. 28, 4795–4806. doi: 10.1523/JNEUROSCI.0123-08.2008
Mathai, A., Ma, Y., Paré, J.-F., Villalba, R. M., Wichmann, T., and Smith, Y. (2015). Reduced cortical innervation of the subthalamic nucleus in MPTP-treated parkinsonian monkeys. Brain 138, 946–962. doi: 10.1093/brain/awv018
McCarthy, M. M., Moore-Kochlacs, C., Gu, X., Boyden, E. S., Han, X., and Kopell, N. (2011). Striatal origin of the pathologic beta oscillations in Parkinson's disease. Proc. Natl. Acad. Sci. U.S.A. 108, 11620–11625. doi: 10.1073/pnas.1107748108
McIver, E. L., Chu, H.-Y., Atherton, J. F., Cosgrove, K. E., Kondapalli, J., Wokosin, D., et al. (2018). Chemogenetic restoration of autonomous subthalamic nucleus activity ameliorates Parkinsonian motor dysfunction. bioRxiv. doi: 10.1101/385443
Miguelez, C., Morin, S., Martinez, A., Goillandeau, M., Bezard, E., Bioulac, B., and Baufreton, J. (2012). Altered pallido-pallidal synaptic transmission leads to aberrant firing of globus pallidus neurons in a rat model of Parkinson's disease: increase in pallidal recurrent inhibition in experimental Parkinsonism. J. Physiol. 590, 5861–5875. doi: 10.1113/jphysiol.2012.241331
Moran, R. J., Mallet, N., Litvak, V., Dolan, R. J., Magill, P. J., Friston, K. J., et al. (2011). Alterations in brain connectivity underlying beta oscillations in Parkinsonism. PLoS Comput. Biol. 7:e1002124. doi: 10.1371/journal.pcbi.1002124
Nevado-Holgado, A. J., Mallet, N., Magill, P. J., and Bogacz, R. (2014). Effective connectivity of the subthalamic nucleus-globus pallidus network during Parkinsonian oscillations: effective connectivity of subthalamic nucleus-globus pallidus network. J. Physiol. 592, 1429–1455. doi: 10.1113/jphysiol.2013.259721
Oorschot, D. E. (1996). Total number of neurons in the neostriatal, pallidal, subthalamic, and substantia nigral nuclei of the rat basal ganglia: a stereological study using the cavalieri and optical disector methods. J. Comp. Neurol. 366, 580–599. doi: 10.1002/(SICI)1096-9861(19960318)366:4<580::AID-CNE3>3.0.CO;2-0
Oorschot, D. E., Zhang, R., and Wickens, J. R. (1999). “Absolute number and three-dimensional spatial distribution of rat neostriatal large interneurons: a first and second order stereological study,” in Proceeding of 10th International Congress Stereological, Vol. 87 (Washington, DC).
Pan, M.-K., Kuo, S.-H., Tai, C.-H., Liou, J.-Y., Pei, J.-C., Chang, C.-Y., et al. (2016). Neuronal firing patterns outweigh circuitry oscillations in parkinsonian motor control. J. Clin. Invest. 126, 4516–4526. doi: 10.1172/JCI88170
Park, C., Worth, R. M., and Rubchinsky, L. L. (2011). Neural dynamics in Parkinsonian brain: the boundary between synchronized and nonsynchronized dynamics. Phys. Rev. E 83:042901. doi: 10.1103/PhysRevE.83.042901
Pavlides, A., Hogan, S. J., and Bogacz, R. (2015). Computational models describing possible mechanisms for generation of excessive beta oscillations in Parkinson's disease. PLoS Comput. Biol. 11:e1004609. doi: 10.1371/journal.pcbi.1004609
Pavlides, A., John Hogan, S., and Bogacz, R. (2012). Improved conditions for the generation of beta oscillations in the subthalamic nucleus-globus pallidus network: generation of beta oscillations. Eur. J. Neurosci. 36, 2229–2239. doi: 10.1111/j.1460-9568.2012.08105.x
Paz, J. T. (2005). Rhythmic bursting in the cortico-subthalamo-pallidal network during spontaneous genetically determined spike and wave discharges. J. Neurosci. 25, 2092–2101. doi: 10.1523/JNEUROSCI.4689-04.2005
Plenz, D., and Kital, S. T. (1999). A basal ganglia pacemaker formed by the subthalamic nucleus and external globus pallidus. Nature 400, 677–682. doi: 10.1038/23281
Ramanathan, S., Tkatch, T., Atherton, J. F., Wilson, C. J., and Bevan, M. D. (2008). D2-like dopamine receptors modulate SKCa channel function in subthalamic nucleus neurons through inhibition of Cav2.2 channels. J. Neurophysiol. 99, 442–459. doi: 10.1152/jn.00998.2007
Ray, N., Jenkinson, N., Wang, S., Holland, P., Brittain, J., Joint, C., et al. (2008). Local field potential beta activity in the subthalamic nucleus of patients with Parkinson's disease is associated with improvements in bradykinesia after dopamine and deep brain stimulation. Exp. Neurol. 213, 108–113. doi: 10.1016/j.expneurol.2008.05.008
Reis, C., Sharott, A., Magill, P. J., van Wijk, B. C., Parr, T., Zeidman, P., et al. (2019). Thalamocortical dynamics underlying spontaneous transitions in beta power in Parkinsonism. Neuroimage 193, 103–114. doi: 10.1016/j.neuroimage.2019.03.009
Sadek, A. R., Magill, P. J., and Bolam, J. P. (2007). A single-cell analysis of intrinsic connectivity in the rat globus pallidus. J. Neurosci. 27, 6352–6362. doi: 10.1523/JNEUROSCI.0953-07.2007
Sanders, T. H., Clements, M. A., and Wichmann, T. (2013). Parkinsonism-related features of neuronal discharge in primates. J. Neurophysiol. 110, 720–731. doi: 10.1152/jn.00672.2012
Sanders, T. H., and Jaeger, D. (2016). Optogenetic stimulation of cortico-subthalamic projections is sufficient to ameliorate bradykinesia in 6-ohda lesioned mice. Neurobiol. Dis. 95, 225–237. doi: 10.1016/j.nbd.2016.07.021
Schultheiss, N. W., Edgerton, J. R., and Jaeger, D. (2010). Phase response curve analysis of a full morphological globus pallidus neuron model reveals distinct perisomatic and dendritic modes of synaptic integration. J. Neurosci. 30, 2767–2782. doi: 10.1523/JNEUROSCI.3959-09.2010
Sharott, A., Gulberti, A., Zittel, S., Tudor Jones, A. A., Fickel, U., Munchau, A., et al. (2014). Activity parameters of subthalamic nucleus neurons selectively predict motor symptom severity in Parkinson's disease. J. Neurosci. 34, 6273–6285. doi: 10.1523/JNEUROSCI.1803-13.2014
Sharott, A., Magill, P. J., Harnack, D., Kupsch, A., Meissner, W., and Brown, P. (2005). Dopamine depletion increases the power and coherence of β-oscillations in the cerebral cortex and subthalamic nucleus of the awake rat. Eur. J. Neurosci. 21, 1413–1422. doi: 10.1111/j.1460-9568.2005.03973.x
Sharott, A., Vinciati, F., Nakamura, K. C., and Magill, P. J. (2017). A population of indirect pathway striatal projection neurons is selectively entrained to Parkinsonian beta oscillations. J. Neurosci. 37, 9977–9998. doi: 10.1523/JNEUROSCI.0658-17.2017
Shen, K.-Z., and Johnson, S. W. (2005). Dopamine depletion alters responses to glutamate and GABA in the rat subthalamic nucleus. NeuroReport 16, 171–174. doi: 10.1097/00001756-200502080-00021
Sherman, M. A., Lee, S., Law, R., Haegens, S., Thorn, C. A., Hämäläinen, M. S., et al. (2016). Neural mechanisms of transient neocortical beta rhythms: Converging evidence from humans, computational modeling, monkeys, and mice. Proc. Natl. Acad. Sci. U.S.A. 113, E4885–E4894. doi: 10.1073/pnas.1604135113
Shin, R.-M., Masuda, M., Miura, M., Sano, H., Shirasawa, T., Song, W.-J., et al. (2003). Dopamine D4 receptor-induced postsynaptic inhibition of GABAergic currents in mouse globus pallidus neurons. J. Neurosci. 23, 11662–11672. doi: 10.1523/JNEUROSCI.23-37-11662.2003
Shink, E., and Smith, Y. (1995). Differential synaptic innervation of neurons in the internal and external segments of the globus pallidus by the GABA- and glutamate-containing terminals in the squirrel monkey. J. Comp. Neurol. 358, 119–141. doi: 10.1002/cne.903580108
Smith, Y., Bolam, J. P., and Krosigk, M. (1990). Topographical and synaptic organization of the GABA-containing pallidosubthalamic projection in the rat. Eur. J. Neurosci. 2, 500–511. doi: 10.1111/j.1460-9568.1990.tb00441.x
Swan, C. B., Schulte, D. J., Brocker, D. T., and Grill, W. M. (2019). Beta frequency oscillations in the subthalamic nucleus are not sufficient for the development of symptoms of parkinsonian bradykinesia/akinesia in rats. eneuro. 6:ENEURO.0089-19.2019. doi: 10.1523/ENEURO.0089-19.2019
Tachibana, Y., Iwamuro, H., Kita, H., Takada, M., and Nambu, A. (2011). Subthalamo-pallidal interactions underlying parkinsonian neuronal oscillations in the primate basal ganglia: BG oscillations in Parkinson's disease. Eur. J. Neurosci. 34, 1470–1484. doi: 10.1111/j.1460-9568.2011.07865.x
Terman, D., Rubin, J. E., Yew, A. C., and Wilson, C. J. (2002). Activity patterns in a model for the subthalamopallidal network of the basal ganglia. J. Neurosci. 22, 2963–2976. doi: 10.1523/JNEUROSCI.22-07-02963.2002
Tsodyks, M., Pawelzik, K., and Markram, H. (1998). Neural networks with dynamic synapses. Neural Comput. 10, 821–835. doi: 10.1162/089976698300017502
Turrigiano, G. (2011). Too many cooks? Intrinsic and synaptic homeostatic mechanisms in cortical circuit refinement. Annu. Rev. Neurosci. 34, 89–103. doi: 10.1146/annurev-neuro-060909-153238
Velisar, A., Syrkin-Nikolau, J., Blumenfeld, Z., Trager, M., Afzal, M., Prabhakar, V., et al. (2019). Dual threshold neural closed loop deep brain stimulation in Parkinson disease patients. Brain Stimul. 12, 868–876. doi: 10.1016/j.brs.2019.02.020
Vitek, J. L., Zhang, J., Hashimoto, T., Russo, G. S., and Baker, K. B. (2012). External pallidal stimulation improves parkinsonian motor signs and modulates neuronal activity throughout the basal ganglia thalamic network. Exp. Neurol. 233, 581–586. doi: 10.1016/j.expneurol.2011.09.031
Wang, Y.-Y., Wang, Y., Jiang, H.-F., Liu, J.-H., Jia, J., Wang, K., et al. (2018). Impaired glutamatergic projection from the motor cortex to the subthalamic nucleus in 6-hydroxydopamine-lesioned hemi-parkinsonian rats. Exp. Neurol. 300, 135–148. doi: 10.1016/j.expneurol.2017.11.006
Wei, W., Rubin, J. E., and Wang, X.-J. (2015). Role of the indirect pathway of the basal ganglia in perceptual decision making. J. Neurosci. 35, 4052–4064. doi: 10.1523/JNEUROSCI.3611-14.2015
Weinberger, M., Mahant, N., Hutchison, W. D., Lozano, A. M., Moro, E., Hodaie, M., et al. (2006). Beta oscillatory activity in the subthalamic nucleus and its relation to dopaminergic response in Parkinson's disease. J. Neurophysiol. 96, 3248–3256. doi: 10.1152/jn.00697.2006
Yang, C., Yan, Z., Zhao, B., Wang, J., Gao, G., Zhu, J., and Wang, W. (2016). D2 dopamine receptors modulate neuronal resonance in subthalamic nucleus and cortical high-voltage spindles through HCN channels. Neuropharmacology 105, 258–269. doi: 10.1016/j.neuropharm.2016.01.026
Zhao, L., Beverlin, B., Netoff, T., and Nykamp, D. Q. (2011). Synchronization from second order network connectivity statistics. Front. Comput. Neurosci. 5:28. doi: 10.3389/fncom.2011.00028
Keywords: basal ganglia, subthalamic nucleus, Parkinson's disease, beta-band oscillations, synchronization, globus pallidus, multi-compartmental neuron model
Citation: Koelman LA and Lowery MM (2019) Beta-Band Resonance and Intrinsic Oscillations in a Biophysically Detailed Model of the Subthalamic Nucleus-Globus Pallidus Network. Front. Comput. Neurosci. 13:77. doi: 10.3389/fncom.2019.00077
Received: 27 June 2019; Accepted: 17 October 2019;
Published: 05 November 2019.
Edited by:
Matjaž Perc, University of Maribor, SloveniaCopyright © 2019 Koelman and Lowery. This is an open-access article distributed under the terms of the Creative Commons Attribution License (CC BY). The use, distribution or reproduction in other forums is permitted, provided the original author(s) and the copyright owner(s) are credited and that the original publication in this journal is cited, in accordance with accepted academic practice. No use, distribution or reproduction is permitted which does not comply with these terms.
*Correspondence: Lucas A. Koelman, lucas.koelman@gmail.com