


Introduction
While purifying Escherichia coli dihydroorotase (an enzyme in the biosynthetic pathway of the pyrimidines) to study its catalytic mechanism of action, we discovered that the enzyme exhibited instability of two kinds. The first was instability to oxygen which covalently modified the enzyme and lowered its catalytic activity by about a third; this could be avoided by carefully removing adventitious copper and iron from all solutions and minimizing the exposure of the enzyme to oxygen (Washabaugh and Collins, Reference Washabaugh and Collins1984; Brown and Collins, Reference Brown and Collins1991). The second kind of instability was the tendency of the enzyme to completely inactivate by unfolding (denaturing) at concentrations below about 100 µg ml−1 (Figs 1 and 2) (Washabaugh and Collins, Reference Washabaugh and Collins1986a, Reference Washabaugh and Collins1986b). The actual mechanism of denaturation was the dissociation of a dimer to a monomer which subsequently unfolded irreversibly, increasing the solvent exposed surface area of the polypeptide chain (Washabaugh and Collins, Reference Washabaugh and Collins1986a, Reference Washabaugh and Collins1986b). We tested the ability of many small molecules, mostly salts, to stabilize low concentrations of the enzyme in its native, folded, catalytically active conformation (Fig. 3). It was the anionic part of these salts which had the largest effect, probably because the anions are larger than the cations. When arranged from most stabilizing on the left to most destabilizing on the right with Cl− near the center (Fig. 4), these anions formed a Hofmeister series, so-called because Franz Hofmeister formed a similar series in 1888 based upon their precipitating effects on hen egg white protein (Hofmeister, Reference Hofmeister1888; Collins and Washabaugh, Reference Collins and Washabaugh1985; Hofmeister, Reference Hofmeister2004; Collins, Reference Collins2012). [This sequence is actually the order in which the ions elute from a Sephadex® G-10 column (Washabaugh and Collins, Reference Washabaugh and Collins1986a, Reference Washabaugh and Collins1986b).] The series that we initially produced had neutral, negatively charged, and positively charged species – so it was not obvious what property of these small molecules made them protein-stabilizing or -destabilizing. Our studies determining the molecular basis of Hofmeister effects (Collins and Washabaugh, Reference Collins and Washabaugh1985; Washabaugh and Collins, Reference Washabaugh and Collins1986a, Reference Washabaugh and Collins1986b; Collins, Reference Collins1995, Reference Collins1997, Reference Collins2004, Reference Collins2006, Reference Collins2012; Kiriukhin and Collins, Reference Kiriukhin and Collins2002), the work of Neilson and Enderby using neutron diffraction with isotopic substitution (NDIS) to characterize ion hydration (Skipper and Neilson, Reference Skipper and Neilson1989; Enderby, Reference Enderby1995), and advances in molecular dynamics simulations of aqueous salt solutions (Vrbka et al., Reference Vrbka, Vondrasek, Jagoda-Cwiklik, Vacha and Jungwirth2006; Fennell et al., Reference Fennell, Bizjak, Vlachy and Dill2009; Stirnemann et al., Reference Stirnemann, Wernersson, Jungwirth and Laage2013; Shi and Beck, Reference Shi and Beck2017), all of which we review in this paper, clarify the forces in aqueous solution that give rise to biological structure and allow us for the first time to manipulate biological macromolecules in a systematic way and to control the stability and solubility of proteins.

Fig. 1. Dilution inactivation of 1 Zn/subunit dihydroorotase:dihydroorotase concentration dependence (Washabaugh and Collins, Reference Washabaugh and Collins1986a, Reference Washabaugh and Collins1986b). Duplicate independent experiments were performed (circles and squares). Pure 1 Zn/subunit dihydroorotase (1.32 mg ml−1) in 10 mM Tris phosphate buffer (pH 7.0) was diluted into 10 mM Tris phosphate buffer to produce 0.14–1320 µg ml−1 enzyme in a final volume of 0.20 ml in a 0.5-ml plastic centrifuge tube, and incubated in the absence of substrate under nitrogen at 0 °C. Dihydroorotase activity was measured at 30 °C by following the increase in absorbance at 230 nm with potassium dihydro-dl-orotate as substrate (Washabaugh and Collins, Reference Washabaugh and Collins1984) after 1.5 (open symbols) and 4 h (solid symbols), and protein was determined by the method of Lowry et al. (Reference Lowry, Rosebrough, Farr and Randall1951) as modified by Peterson (Reference Peterson1977). Percent activity is calculated relative to the activity expected after dilution of the stock enzyme (1.32 mg ml−1). This research was originally published in the Journal of Biological Chemistry Washabaugh and Collins (Reference Washabaugh and Collins1986a). © 1986 the American Society for Biochemistry and Molecular Biology.
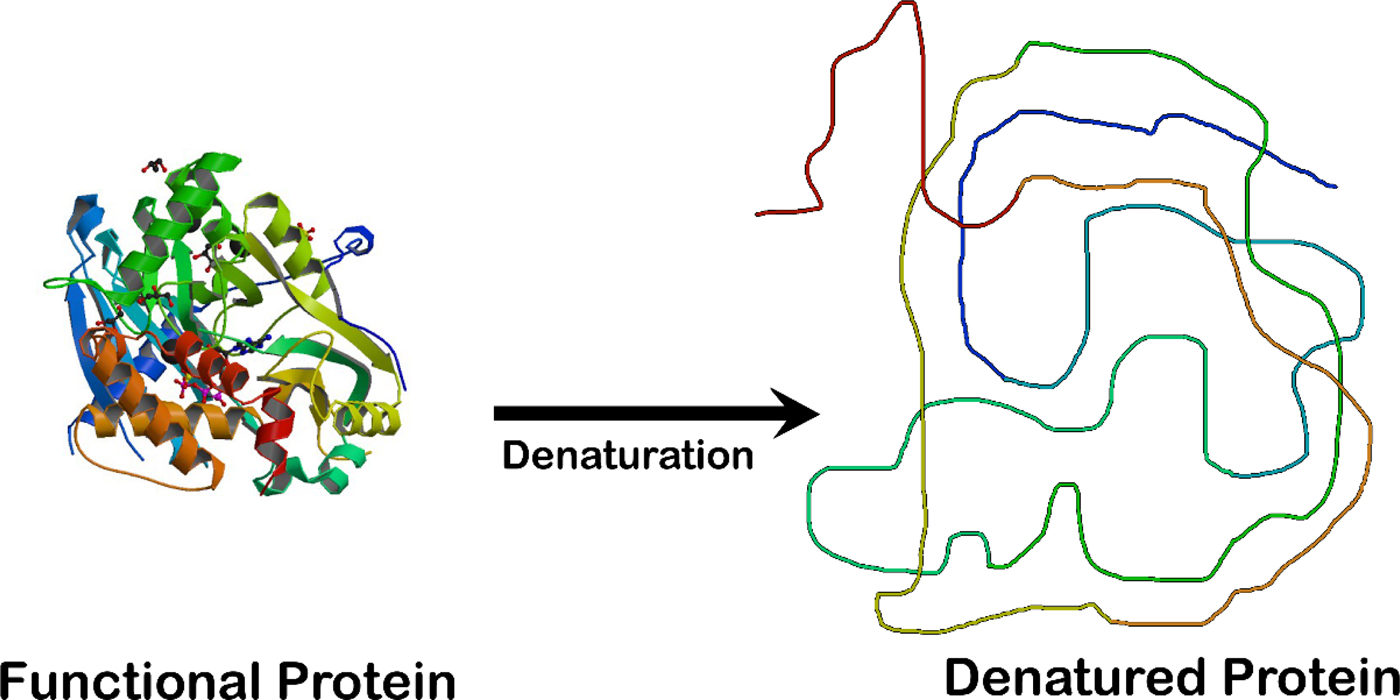
Fig. 2. Unfolding an enzyme which is a globular protein causes a loss of enzymatic activity. The enzyme crystal structure on the left is that of the ligase domain of fungal tRNA ligase Trl1 (Peschek and Walter, Reference Peschek and Walter2018). The diagram on the right is that of an unstructured random coil.

Fig. 3. Effect of Hofmeister solutes on the stability of dilute E. coli dihydroorotase as measured by enzyme activity (Washabaugh and Collins, Reference Washabaugh and Collins1986a, Reference Washabaugh and Collins1986b). 0.2 ml samples containing pure dihydroorotase (10 µg ml−1) in 0–0.60 M solute plus 0.10 M NaCl (to allow comparison to the Sephadex® G-10 experiments), 0.002 M Tris phosphate buffer (pH 7.0) were incubated under nitrogen at 30 °C in 0.5 ml plastic centrifuge tubes. The solute was either Na2SO4, NaCl or guanidine (GUAN+) HCl. Therefore the concentration of NaCl in the middle curve varied from 0.1 to 0.7 M. Dihydroorotase activity was measured over a 24 h period using dihydro-dl-orotate as substrate (Washabaugh and Collins, Reference Washabaugh and Collins1986a, Reference Washabaugh and Collins1986b). Dihydroorotase activity loss was first order in all cases with no abrupt changes occurring because of solute addition. The K i for competitive inhibition of dihydroorotase by 0.10 M Na2SO4 was determined in a separate experiment and, if any inhibition occurred, was greater than 1 M at pH 8.0 and greater than 0.6 M at pH 5.80; we thus conclude that sulfate does not stabilize the enzyme by binding at the active site. This research was originally published in the Journal of Biological Chemistry Washabaugh and Collins (Reference Washabaugh and Collins1986b). © the American Society for Biochemistry and Molecular Biology.

Fig. 4. A Hofmeister series. The ions on the left side of the series stabilize the native structure of globular proteins. The ions on the right side of the series destabilize the native structure of globular proteins. The dotted vertical line near the center indicates where the Jones–Dole viscosity B coefficient changes sign. (Chloride ion, near the center of the series, is actually neutral toward native globular protein structure.)
The molecular basis of the Hofmeister effect
Strong and weak hydration
For simplicity we decided to examine the anions by size-exclusion chromatography using Sephadex® G-10, which is the most highly epichlorohydrin-cross-linked dextran in beaded form commercially available. Sephadex® G-10 may be thought of as neutral beads with a nonpolar surface (Holmberg, Reference Holmberg1983) (Fig. 5) containing uniform size pores which can separate small molecules below a molecular weight of about 700 by a ‘size-exclusion’ mechanism: small molecules penetrate the beads and have a longer pathlength through a packed column (slow elution), whereas larger molecules are excluded from the interior of the beads and have a shorter pathlength through a packed column (fast elution) (Fig. 6). This separation mechanism as described involves no direct interaction of the solute with the neutral Sephadex® G-10 beads. Solutes which have an apparent molecular weight larger than their anhydrous molecular weight are binding some water molecules with a lifetime of at least several picoseconds and effectively carry these water molecules with them through the column (Kiriukhin and Collins, Reference Kiriukhin and Collins2002); solutes which have an apparent molecular weight smaller than their anhydrous molecular weight are adsorbed to the neutral surface of the beads. To ensure that no adventitious charges on the Sephadex® G-10 beads could affect our results, all eluting solutions contain 0.1 M NaCl; leaving the NaCl out of the eluting solutions causes no detectable difference in the chromatographic behavior of ions on Sephadex® G-10. The included volume of the column (the longest pathlength attainable by gel sieving) was determined by chromatographing tritiated water (THO [3HOH]), or with slightly better accuracy, 18O-water (Marsden, Reference Marsden1971; Kiriukhin and Collins, Reference Kiriukhin and Collins2002). Ions eluting later than isotopically labeled water must be adsorbed to the neutral poly-ether surface of the Sephadex® G-10. The excluded volume of the column (the shortest pathlength through the column) was determined by chromatographing macromolecular dextran of average molecular weight of 40 000, or, with slightly better accuracy, by chromatographing the strongly hydrated negatively charged polyglutamate of molecular weight of 13 700 at pH 7 (Washabaugh and Collins, Reference Washabaugh and Collins1986a, Reference Washabaugh and Collins1986b; Kiriukhin and Collins, Reference Kiriukhin and Collins2002). The specific calibration of the column that allows correlating an elution position with a molecular weight is achieved with 18O-water and polymers of glycine (the simplest amino acid) containing from two to six subunits (Kiriukhin and Collins, Reference Kiriukhin and Collins2002). The apparent molecular weight of a salt on Sephadex® G-10 is assigned to the sum of the weight of the anion plus the weight of the cation plus the weight of any additional water molecules bound tightly enough to either ion to have a lifetime of at least several picoseconds at room temperature (30 °C) (Kiriukhin and Collins, Reference Kiriukhin and Collins2002). Apportioning the bound water to a specific ion is achieved by judicious selection of the counterion, yielding an ‘apparent dynamic hydration number’ (Kiriukhin and Collins Reference Kiriukhin and Collins2002). For example, we know that Cl− is weakly hydrated (relative to the strength of water–water interactions) by its slightly negative Jones–Dole viscosity B coefficient (see below), and thus its apparent dynamic hydration number is 0. And since it does not interact with Sephadex® G-10 (see below), it passes through the column by gel sieving and thus is the ideal counterion for determining the dynamic hydration number of cations. Sephadex® G-10 itself contains no charged groups; but to make sure that ions studied using Sephadex® G-10 experience no ion-exchange effects, the eluent always contains 0.1 M NaCl.

Fig. 5. A typical structure isolated from Sephadex® G-25 Holmberg (Reference Holmberg1983), which is less highly cross-linked than Sephadex® G-10. The epichlorohydrin-cross-linked dextrans contain no aromatic residues. This research was originally published in the Proceedings of the National Academy of Sciences. Collins (Reference Collins1995) © 1995 National Academy of Sciences.
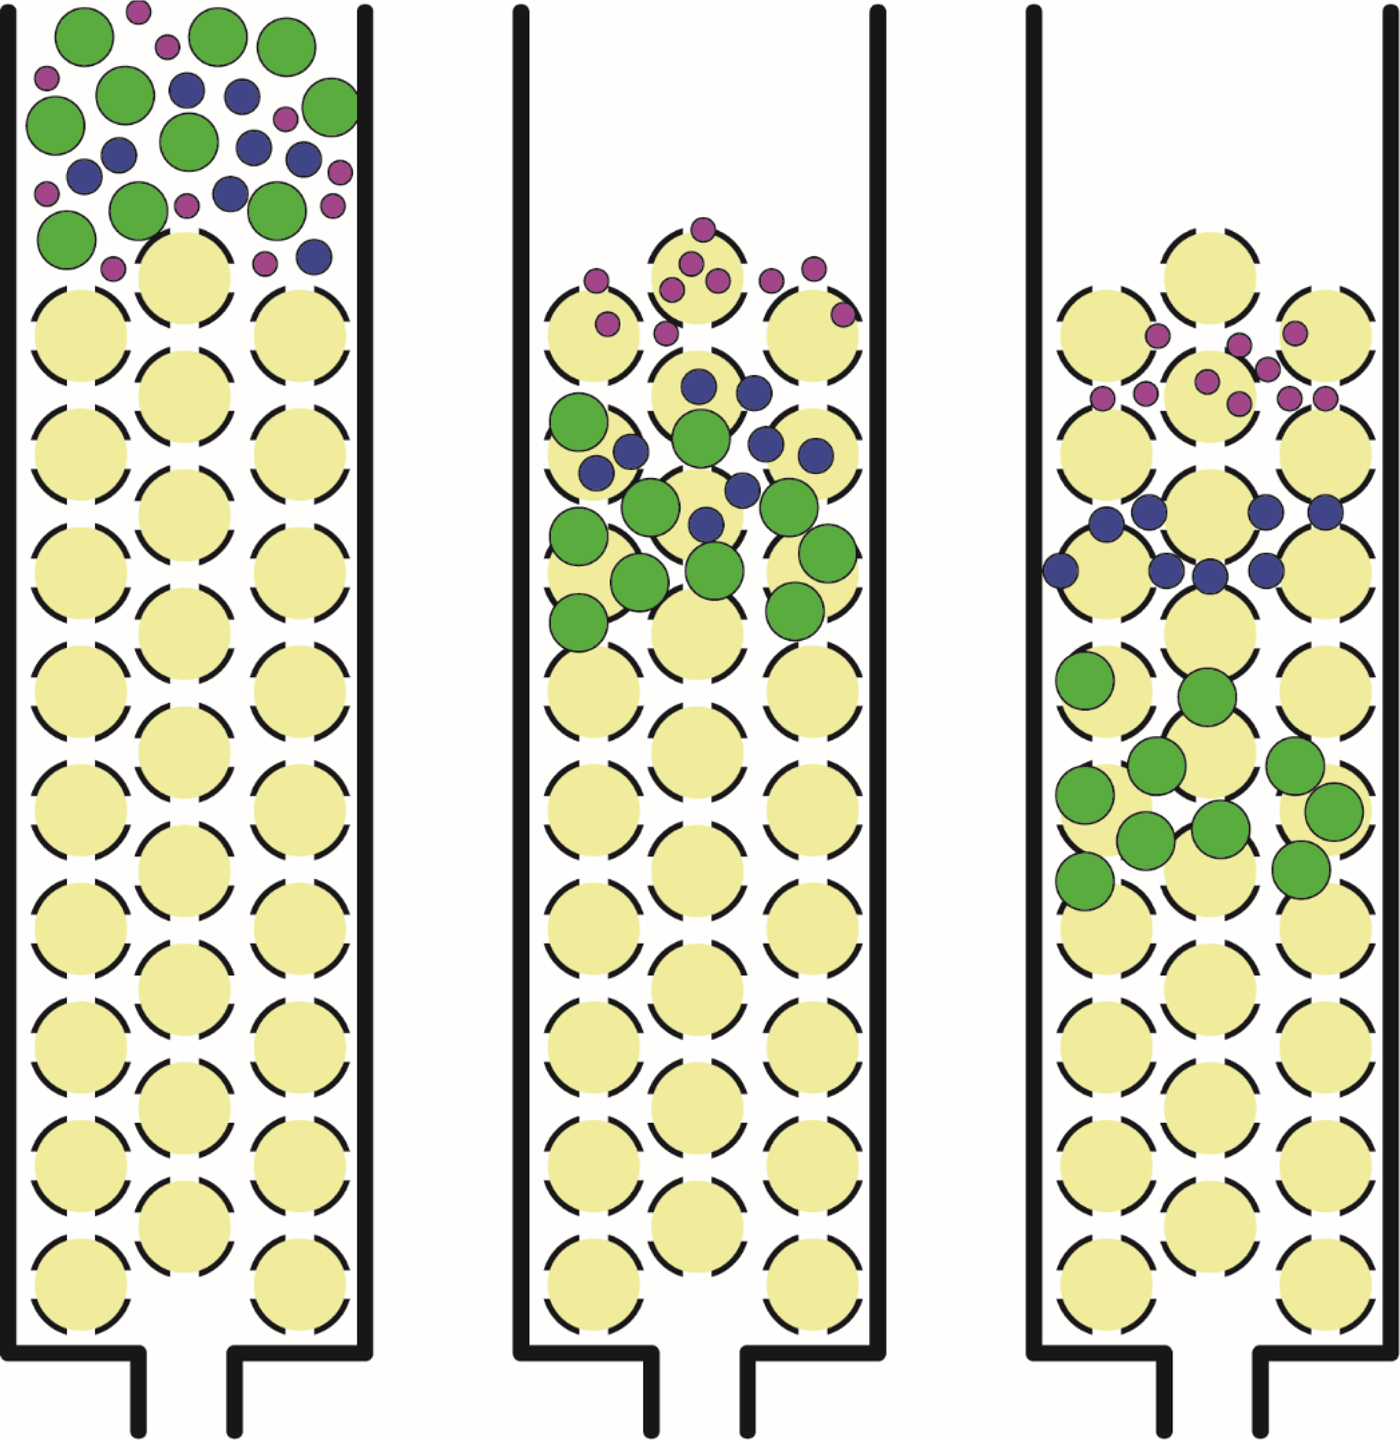
Fig. 6. Size exclusion chromatography. Large solutes which are unable to enter the beads have a shorter path through the column and elute early; small solutes which are able to enter the beads have a longer path through the column and elute late.
The experimental setup is extremely simple, and the results are both surprising and very informative. A 4-l side arm flask containing 0.1 M NaCl which has been de-gassed while stirring with a water aspirator and filtered through a 0.45 µm filter is set atop a cabinet about 7 ft tall and run by gravity at 1.2 ml min−1 through a 1 m × 1.6 cm diameter column of Sephadex® G-10 jacketed at 30 °C and then into a drop counting fraction collector sitting on the floor. Each experiment is begun by layering 0.6 ml of a 0.1 M salt solution onto the top of the Sephadex® G-10 bed, and eluent fractions are collected in glass tubes. At the end of the experiment, which takes between 2.5 and 12 h, the 0.6 ml fractions are assayed manually. For ease of detection we used radioactive ions whenever possible (Washabaugh and Collins, Reference Washabaugh and Collins1986a, Reference Washabaugh and Collins1986b).
When NaF, NaCl, NaBr and NaI (the anhydrous ionic radii of the halide anions increase as one goes down the periodic table – see Table 1) (Sharpe, Reference Sharpe1992) are chromatographed separately or together on Sephadex® G-10 the data obtained are shown in Fig. 7 (Washabaugh and Collins, Reference Washabaugh and Collins1986a, Reference Washabaugh and Collins1986b). The first thing that one notices is that the ions elute from the smallest (F−) first to the largest (I−) last, the opposite order of solute elution normally seen with gel sieving chromatography; therefore something other than the anhydrous ionic radius is controlling the behavior of the anions. The second thing that one notices is that Br− and I− elute after the gel sieving region (bracketed by THO [3HOH] and dextran) indicating that they are being pushed onto the neutral surface of the Sephadex® G-10 beads by the strength of water–water actions. This is confirmed by examining the concentration (from 0.025 to 0.6 M, see Fig. 8) and temperature (from 4 to 50 °C, see Fig. 9) chromatographic dependence of all four anions: F− and Cl− chromatographic behavior is temperature and concentration independent (consistent with gel sieving) whereas Br− and I− chromatographic behavior is temperature and concentration dependent (indicating interaction with the neutral surface of the Sephadex® G-10 beads). In these figures the elution position is represented as the K d [=(V e − V 0)/(V i − V 0)], which is a linear fraction that varies from 0 for the elution position of the macromolecular excluded volume (V 0) (the earliest position for size exclusion) to 1 for the elution position of the 18O-water included volume (V i) (the latest position for size exclusion); a K d > 1 indicates slow elution caused by interaction with the surface of the column. Since the surface of the Sephadex® G-10 beads is mostly polyethers and is thus not very polarizable, we do not think that there are significant attractive forces between the larger, more polarizable anions Br− and I− and the surface of the neutral beads (more on this below); rather the weakly hydrated Br− and the even more weakly hydrated I− are pushed onto the surface of the column by strong water–water interactions. This interpretation is supported by comparison with several other techniques as discussed below. As will also be explained below, carefully calibrating the column with polymers of glycine allows us to conclude that F− diffuses through the column with 5 water molecules attached whereas Cl− appears to be smaller than F− because Cl− diffuses through the column with no water molecules attached. The Cl− ion has remarkable properties: it is slightly weakly hydrated as shown, for example, by its negative Jones–Dole viscosity B coefficient (see below); yet it does not interact with the surface of the Sephadex® G-10 beads but it does orient the adjacent water molecules (as shown by NDIS, Fig. 10) (Powell et al., Reference Powell, Neilson and Enderby1993; Enderby, Reference Enderby1995) via a nearly linear hydrogen bond (rather than via a dipolar interaction), showing that the strong, long-range electrostatic forces cancel out, allowing chemistry to come to the fore. [X-ray absorption spectroscopy of aqueous Cl− detects two solvation shells of 7 water molecules each, the first at 3.15 Å and the second at 4.14 Å (Antalek et al., Reference Antalek, Pace, Hedman, Hodgson, Chillemi, Benfatto, Sarangi and Frank2016)].

Fig. 7. Chromatography of halide anions on Sephadex® G-10 (Washabaugh and Collins, Reference Washabaugh and Collins1986a, Reference Washabaugh and Collins1986b). 1.0 ml samples containing 0.10 M sodium halides (separately or together) in 0.10 mM NaCl containing THO [3HOH] and 0.5% dextran were chromatographed on a Sephadex® G-10 column (1.5 × 85.5 cm) at 30 °C and a flow rate of 0.5 ml min−1. The eluent was 0.10 ml NaCl. 0.65 ml fractions were collected and assayed manually. This research was originally published in the Journal of Biological Chemistry Washabaugh and Collins (Reference Washabaugh and Collins1986b). © 1986 the American Society for Biochemistry and Molecular Biology.

Fig. 8. Concentration dependent chromatography of neutral, cationic and anionic solutes on Sephadex® G-10 (Washabaugh and Collins, Reference Washabaugh and Collins1986a, Reference Washabaugh and Collins1986b). 1.0 ml samples containing 0.001–0.60 M solute in 0.10 M NaCl containing THO [3HOH] and 0.5% dextran were chromatographed on a Sephadex® G-10 column (1.5 × 85.5 cm) and 0.65 or 1.30 ml fractions were collected and assayed manually. The eluate peak positions are presented as the distribution coefficient, K d. EG, ethylene glycol; TCA−, trichloroacetate; GUAN+, guanidinium; TRIS+, protonated Tris. Sodium salts of indicated anions were used. This research was originally published in the Journal of Biological Chemistry Washabaugh and Collins (Reference Washabaugh and Collins1986b). © 1986 the American Society for Biochemistry and Molecular Biology.
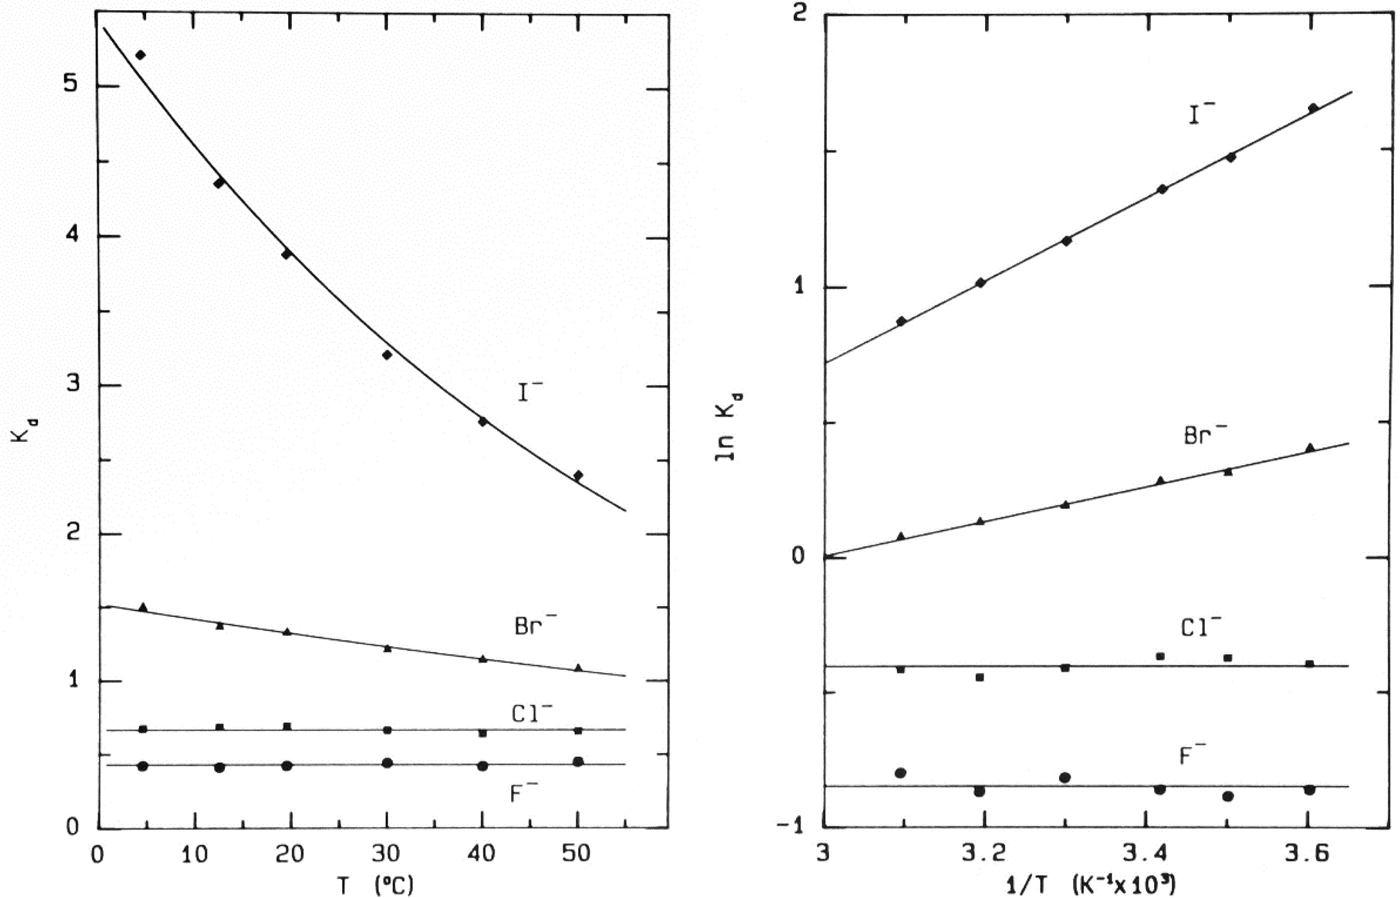
Fig. 9. Temperature-dependence of elution of the sodium halides from Sephadex® G-10 (Washabaugh and Collins, Reference Washabaugh and Collins1986a, Reference Washabaugh and Collins1986b). 1.0 ml samples simultaneously containing 0.10 M NaF, NaCl, NaBr, and NaI in 0.10 M NaCl plus THO [3HOH] and 0.5% dextran were chromatographed on a Sephadex® G-10 (1.5 × 85.5 cm) at temperatures between 4.5 and 50 °C at a flow rate of 0.35–0.69 ml min−1. The eluent was 0.10 M NaCl. The elution positions were determined as described earlier. The temperature dependence data on the right are plotted as ln K d versus 1/T. The slope of the line in this experiment yields adsorption enthalpies of −1.27 ± 0.06 kcal mol−1 for Br− and −3.02 ± 0.06 kcal mol−1 for I−. The coefficient of determination of the linear least squares fit is 0.992 for Br− and 0.999 for I−. This research was originally published in the Journal of Biological Chemistry Washabaugh and Collins (Reference Washabaugh and Collins1986b). © 1986 the American Society for Biochemistry and Molecular Biology.

Fig. 10. The instantaneous arrangement of a water molecule near to a chloride ion as determined by NDIS (Enderby, Reference Enderby1995). This research was originally published in the Chemical Society Reviews Enderby (Reference Enderby1995). © 1995 the Royal Society of Chemistry.
Table 1. Ionic radii (Å) for six-fold coordination (Sharpe, Reference Sharpe1992)

Another way to present the Sephadex® G-10 chromatographic behavior of F−, Cl−, Br− and I− as their Na+ salts is as the elution position of the salt on the vertical axis (measured as its K d) versus the log10 of its molecular weight on the horizontal axis (Fig. 11); while the neutral calibration standards are very well behaved and fall on a straight line, the experimental ions show non-ideality with a vengeance. They form a line essentially perpendicular to that of the calibration standards, demonstrating that something other than anhydrous molecular weight is controlling their behavior. In this plot, a point that falls below the calibration line indicates a functional molecular weight larger than the anhydrous molecular weight caused by bound water whereas a point that falls above the line indicates a functional molecular weight smaller than the anhydrous molecular weight, which is caused by adsorbing to the surface of the Sephadex® G-10 beads. [Guanidinium and thiocyanate, both of which adsorb to the surface of the Sephadex® G-10 beads in Figs 8 and 11, have been shown by NDIS to be very weakly hydrated (Mason et al., Reference Mason, Neilson, Dempsey, Barnes and Cruickshank2003).] We see that F−, HPO42− and SO42−, the ions which bind water tightly and thus look larger than their anhydrous molecular weight, are the anions which stabilize proteins. This suggests that the stabilizing anions are competing for interfacial water at the surface of the protein, making the solution a poorer solvent and encouraging the protein to minimize its solvent-exposed surface area by acquiring a more compact form. This, in fact, is correct and was Hofmeister's conclusion in 1888 although he had no way to prove it (Hofmeister, Reference Hofmeister1888; Hofmeister, Reference Hofmeister2004).
Fig. 11. Anomalous chromatographic behavior of solutes on Sephadex® G-10 (Washabaugh and Collins, Reference Washabaugh and Collins1986a, Reference Washabaugh and Collins1986b). K d values for eluate peak positions of samples containing 0.10 M solute from Fig. 8 are plotted as K d versus log10 molecular weight of the solute at pH 7 as the sodium or hydrochloride salt. The points labeled 1–6 represent glycine and its homopolymers through hexaglycine. The double line is our best estimate of the region of normal behavior for solutes on Sephadex® G-10. The line connecting the halide anions demonstrates that their elution position is largely determined by factors other than gel sieving on the basis of molecular weight. Symbols are defined in the legend to Fig. 8. This research was originally published in the Journal of Biological Chemistry Washabaugh and Collins (Reference Washabaugh and Collins1986b). © 1986 the American Society for Biochemistry and Molecular Biology.
Chromatographing the group IA cations as the chloride salts shown in Fig. 12 gives a pattern analogous to that of the anions, with the small Li+ and Na+ ions having positive dynamic hydration numbers (see below) and not interacting with the column (although the position of Na+ is slightly offset in Fig. 12 because the 40 000 MW macromolecular dextran used to calibrate the column in these experiments interacts weakly with the surface of Sephadex® G-10) whereas the larger K+, Rb+ and Cs+ are pushed onto the neutral surface of the Sephadex® G-10 beads by strong water–water interactions. The simplest way to think about this is shown in Fig. 13. For simplicity we shall consider an ion to be a sphere with a point charge at its center; as one goes down the periodic table, the water molecules at the surface of the ion become further from the point charge at the center such that the ion–water interactions become weaker than the bulk water–water interactions for K+ and larger cations and for Cl− and larger anions. [In this picture, water is modeled as an embedded spheres zwitterion with a negative portion of radius 1.78 Å and a positive portion of 1.06 Å (Collins, Reference Collins1997).] When these large monovalent ions adsorb to a surface, they release weakly bound water to become more strongly interacting bulk water. Our ion experiments on Sephadex® G-10 and the solution experiments of Neilson and Enderby utilizing NDIS clearly show the transition from strong hydration for Li+ and Na+ to weak hydration for K+ (Fig. 14) (Enderby, Reference Enderby1995); Neilson and Enderby were also able to show that D2O was bound to Li+ and Na+ preferentially through the oxygen atom whereas K+ did not orient the adjacent D2O (Enderby, Reference Enderby1995) (data not shown in this paper). Their NDIS data indicate that the effects of these ions in water is short range, not extending beyond the adjacent single water layer, and that the dynamic hydration numbers described below measure only tightly bound, oriented water molecules. These data can be explained only if water affinity is the controlling force on ions in water, and, they are consistent with many other physical techniques. For example, proton nuclear magnetic resonance (NMR) longitudinal T 1 relaxation rates show that this weakly bound water adjacent to large monovalent ions (K+ and larger) is actually tumbling faster than bulk water (see below) (Endom et al., Reference Endom, Hertz, Thul and Zeidler1967). This picture of short-range ion effects on water is supported by molecular dynamics simulations (Stirnemann et al., Reference Stirnemann, Wernersson, Jungwirth and Laage2013).

Fig. 12. Aqueous gel sieving chromatography on Sephadex® G-10 of group IA cations (Li+, Na+, K+, Rb+, Cs+) plus NH4+ as the Cl− salts in combination with previous results for the halide anions (F−, Cl−, Br−, I−) as the Na+ salts (Washabaugh and Collins, Reference Washabaugh and Collins1986a, Reference Washabaugh and Collins1986b; Collins, Reference Collins1995). The eluent was 0.1 M NaCl; the temperature was 30 °C. From Collins (Reference Collins1995). © 1995 National Academy of Sciences.

Fig. 13. How to think about ions in water Collins (Reference Collins1997). Division of group IA cations and the halide anions into small, strongly hydrated ions and large, weakly hydrated ions. The virtual water molecule on the right is drawn as a zwitterion of radius 1.78 Å for the anionic portion and 1.06 Å for the cationic portion.

Fig. 14. The radial distribution functions g 10(r) for Li+, Na+, water and K+ in liquid water (Skipper and Neilson, Reference Skipper and Neilson1989; Enderby, Reference Enderby1995). These curves measure the density of the solution as a function of the distance from the isotopically substituted ion, and effectively measure the distance from the monovalent cation to the nearest solvent oxygen. The curve labeled ‘H2O’ measures the oxygen–oxygen distance in liquid water. Both neutron and X-ray diffractions were used to generate these data. The radial distribution for Li+ is drawn assuming a coordination number of six; subsequent experiments suggest a number closer to four, with no major effect on the results presented here. This research was originally published by Skipper and Neilson (Reference Skipper and Neilson1989). © 1989 Institute of Physics Publishing Ltd.
Salting in and salting out effects
Sephadex® G-10 size exclusion chromatography also proves to be a powerful tool for examining salting in and salting out effects (Washabaugh and Collins, Reference Washabaugh and Collins1986a, Reference Washabaugh and Collins1986b). These experiments involve the use of 10−4 to 10−5 M of a radioactive ion [SO42− (strongly hydrated), Cl− (slightly weakly hydrated but almost neutral) or SCN− (very weakly hydrated)] in the presence of 50–600 mM cold ion of the same or different hydration type.
When sulfate is the test (radioactive) solute (Fig. 15), adding large amounts of cold disodium sulfate decreases the hydrodynamic radius of the radioactive sulfate, making it smaller and causing it to elute later; when large amounts of cold sodium chloride are added there is no effect on the hydrodynamic radius of radioactive sulfate; when large amounts of cold sodium thiocyanate are added, the hydrodynamic radius of the radioactive sulfate becomes larger, causing it to elute earlier. Typically, weakly hydrated solutes act both indirectly in a water-mediated manner, and directly, by adsorbing to nonpolar surfaces; if the thiocyanate were partially clogging the pores of the Sephadex® G-10, it would also cause the radioactive sulfate to elute earlier.

Fig. 15. Uniform experiment with sulfate as test solute on Sephadex® G-10 (Washabaugh and Collins, Reference Washabaugh and Collins1986a, Reference Washabaugh and Collins1986b). 0.5 ml samples containing 9 × 10⁻⁵ M Na2[35S]SO4 in 0–0.60 M uniform solute plus 0.10 M NaCl, THO [3HOH], and 0.5% dextran were chromatographed on a Sephadex® G-10 column (1.5 × 34.5 cm) at 30 °C and a flow rate of 1.5 ml min−1. The eluent was 0.060 M uniform solute as indicated on the horizontal axis plus 0.10 M NaCl. Thus the concentration of NaCl as the uniform solute varied from 0.1 to 0.7 M. 0.65 ml fractions were collected. The uniform solute was Na2SO4, NaCl or NaSCN. With NaSCN as the uniform solute, the K d of Na2[35S]SO4 was determined twice at each of the five NaSCN concentrations. The test solute elution profile was determined as described earlier. The tritiated water elution position (K d = 1) is off-scale at the top of the figure. This research was originally published in the Journal of Biological Chemistry Washabaugh and Collins (Reference Washabaugh and Collins1986b). © 1986 the American Society for Biochemistry and Molecular Biology.
When chloride is the test (radioactive) solute (Fig. 16), adding large amounts of cold disodium sulfate salts out the radioactive chloride onto the surface of the Sephadex® G-10 as shown by its elution position with a K d well above 1. Adding large amounts of cold sodium chloride has very little effect on the elution position of the radioactive chloride. Adding large amounts of cold sodium thiocyanate increases the hydrodynamic radius of radioactive chloride, causing it to elute earlier; again, if the thiocyanate were partially clogging the pores of the Sephadex® G-10, it would also cause the radioactive chloride to elute earlier.

Fig. 16. Uniform experiment with chloride as test solute on Sephadex® G-10 (Washabaugh and Collins, Reference Washabaugh and Collins1986a, Reference Washabaugh and Collins1986b). 0.5 ml samples containing 5 × 10⁻⁵ M Na[36Cl]Cl in 0–0.60 M uniform solute plus 0.10 M NaCl, THO [3HOH], and 0.5% dextran were chromatographed on a Sephadex® G-10 column (1.5 × 34.5 cm) at 30 °C and a flow rate of 1.5 ml min−1. The eluent was 0–0.60 M uniform solute as indicated on the horizontal axis plus 0.10 M NaCl. Thus the concentration of NaCl as the uniform solute varied from 0.1 to 0.7 M. 0.65 ml fractions were collected. The uniform solute was Na2SO4, NaCl or NaSCN. The test solute elution profile was determined as described earlier. The tritiated water elution position (K d = 1) is indicated by a broken line. This research was originally published in the Journal of Biological Chemistry Washabaugh and Collins (Reference Washabaugh and Collins1986b). © 1986 the American Society for Biochemistry and Molecular Biology.
When thiocyanate is the test (radioactive) solute (Fig. 17), adding large amounts of cold disodium sulfate salts out the radioactive thiocyanate onto the surface of Sephadex® G-10 even more strongly, increasing the K d from ≈7 to ≈14. Adding large amounts of cold sodium chloride has very little effect on the elution position of the radioactive thiocyanate. Adding large amounts of cold sodium thiocyanate increases the hydrodynamic radius of radioactive thiocyanate, causing it to elute earlier; it also competes for binding to the surface of Sephadex® G-10, displacing the adsorbed radioactive thiocyanate and causing it to elute earlier; it may also clog the pores of Sephadex® G-10, causing the radioactive thiocyanate to elute earlier. In all circumstances the radioactive thiocyanate shows absorption to the surface of Sephadex® G-10.
Fig. 17. Uniform experiment with thiocyanate as test solute on Sephadex® G-10 (Washabaugh and Collins, Reference Washabaugh and Collins1986a, Reference Washabaugh and Collins1986b). 0.5 ml samples containing 9 × 10⁻⁶ M K[14C]SCN in 0–0.60 M uniform solute plus 0.10 M NaCl, THO [3HOH], and 0.5% dextran were chromatographed on a Sephadex® G-10 column (1.5 × 34.5 cm) at 30 °C and a flow rate of 1.5 ml min−1. The eluent was 0–0.60 M uniform solute as indicated on the horizontal axis plus 0.10 M NaCl. Thus the concentration of NaCl as the uniform solute varied from 0.1 to 0.7 M. 0.65 ml fraction were collected. The uniform solute was Na2SO4, NaCl or NaSCN. The test solute elution profile was determined as described earlier. The tritiated water elution position (K d = 1) is indicated by a broken line. This research was originally published in the Journal of Biological Chemistry Washabaugh and Collins (Reference Washabaugh and Collins1986b). © 1986 the American Society for Biochemistry and Molecular Biology.
The ‘disappearance’ of the strong, long-range electrostatic forces
The physical basis for the ‘disappearance’ of the strong, long-range electrostatic forces described by Coulomb's Law F e = (1/4πε0)[(q 1 · q 2)/r 2] appears to be the formation of close +/− ion pairs separated by 0, 1 or 2 water molecules as determined by dielectric relaxation spectroscopy (Buchner and Hefter, Reference Buchner and Hefter2009) (Fig. 18). This cancels out the strong electrostatic forces and allows water affinity to come to the fore as the controlling force.
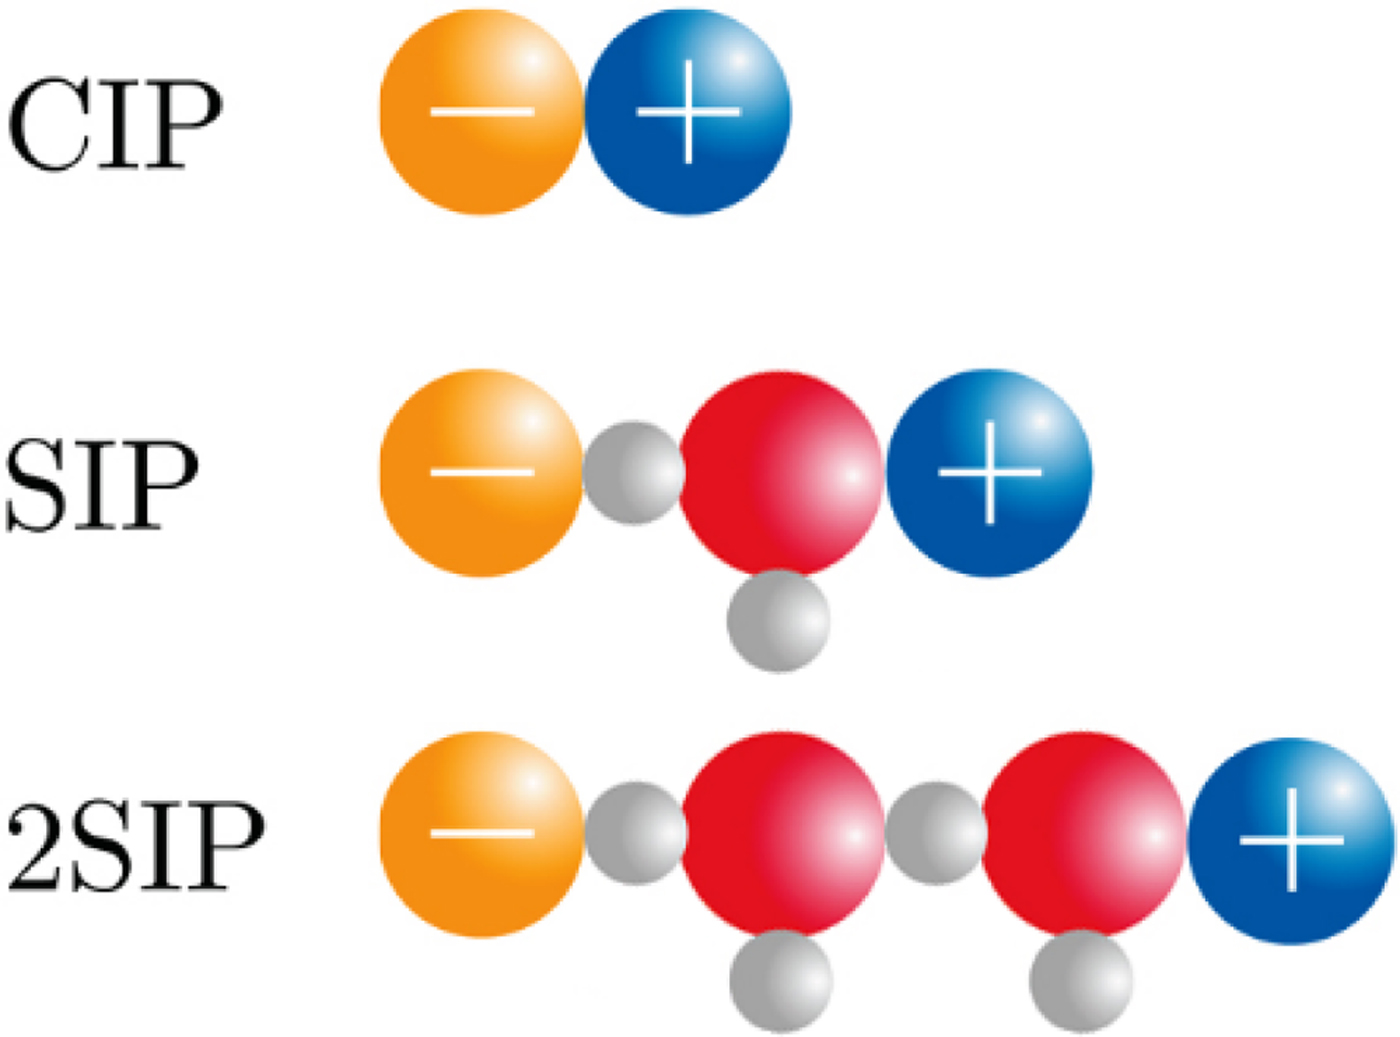
Fig. 18. Ion pair formation in water (Buchner and Hefter, Reference Buchner and Hefter2009). CIP = contact ion pair; SIP = one solvent-separated ion pair; 2SIP = two solvent-separated ion pair. Another way to draw these structures can be found here (Marcus and Hefter, Reference Marcus and Hefter2006).
A simple general model for the hydration of most ions (and other solutes) in water
We can produce a simple general model for the hydration of most ions (and other solutes) in water. First, we know that the magnitude of the surface tension increment at an air/0.1 M salt solution interface indicates a separation of the ions from the interface of two water molecules (Randles, Reference Randles1957). Second, gas phase studies of K+ solvation indicate that water is unique in that the second solvent layer makes a substantial contribution to the free energy of interaction of the solvent with test solutes (Sunner and Kebarle, Reference Sunner and Kebarle1984). In combination with several other kinds of data that we have summarized elsewhere (Collins and Washabaugh, Reference Collins and Washabaugh1985; Collins, Reference Collins2004), we conclude that almost all of the favorable energy of interaction of water with ions occurs in the first two one-water molecule-thick layers. We shall postulate a two one-water molecule-thick layer hydration model for test solutes (test solutes are protein molecules in the Hofmeister effect) (Fig. 19). The inner layer is designated the solvation layer; the test solute controls the behavior of the solvation layer, which is not the same as saying that the test solute binds the solvation layer tightly. The second water layer is designated the transition layer. Beyond that is the bulk surface. Although estimates vary, we shall assume that the solvation layer constitutes about two-thirds of the solvent energy of interaction with the solute and the transition layer about one-third. In this model, the small molecule Hofmeister effect on a protein test solute is mediated by two intervening water molecules. [We have concluded from the temperature dependence of relative viscosity that [solute·H2O·H2O·solute] is a preferred configuration in aqueous solution, especially as the temperature is lowered toward 0 °C (Collins and Washabaugh, Reference Collins and Washabaugh1985)]. The test solute transition layer is the solvation layer of the Hofmeister ions, and its availability to the test solute is increased by weakly hydrated Hofmeister ions (making the solution a better solvent) and decreased by strongly hydrated Hofmeister ions (making the solution a poorer solvent), the latter causing the protein to minimize its solvent exposed surface area, thus stabilizing the protein and lowering its solubility. Weakly hydrated ions also adsorb directly onto the nonpolar portions of proteins.
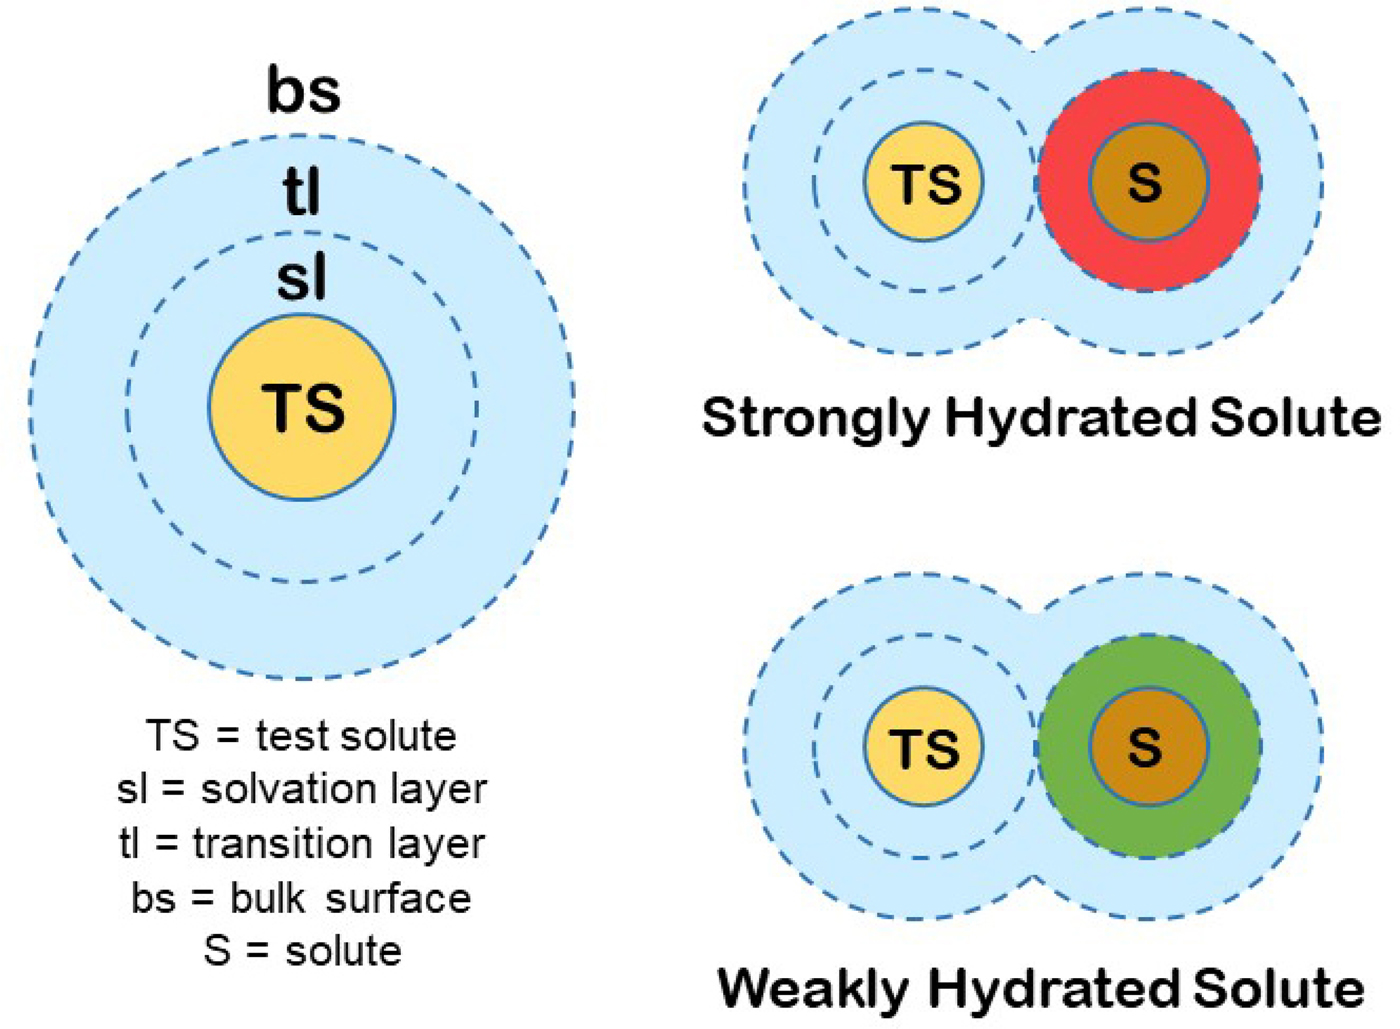
Fig. 19. Small molecule (Hofmeister) modulation of test solute (protein) hydration and thus of test solute (protein) stability and solubility. © 2019 by Kim D. Collins.
Jones–Dole viscosity B coefficient
There is another method to study ions in water that is so simple and informative and complements the Sephadex® G-10 experiments so well that we shall introduce it now. The Jones–Dole viscosity B-coefficient, introduced in 1929, is a single ion-specific parameter that is defined by the equation

which is valid at concentrations (c) up to about 0.1 M for binary strong electrolytes (Jones and Dole, Reference Jones and Dole1929). η is the viscosity of an aqueous salt solution; η 0 is the viscosity of water at the same temperature; A is an electrostatic term that can be neglected at moderate concentrations; and B is a measure of the strength of ion–water interactions normalized to the strength of water–water interactions as verified by Sephadex® G-10 chromatography and also by NDIS. Viscosity B coefficients for relevant ions are given in Table 2 (Robinson et al., Reference Robinson, Strottmann and Stellwagen1981; Krestov, Reference Krestov1991; Collins, Reference Collins1997). Ions with a positive viscosity B coefficient are strongly hydrated relative to the strength of water–water interactions; ions with a negative viscosity B coefficient are weakly hydrated relative to the strength of water–water interactions; and the sign change corresponds to the strength of water–water interactions. The ordering of ions by their water affinity as well as identifying the transition from strong to weak hydration (between Na+ and K+ for the cations; between F− and Cl− for the anions) is the same when determined by Sephadex® G-10 chromatography, when determined by NDIS, or when determined by Jones–Dole viscosity B-coefficients, showing that water affinity rather than attractive forces between the weakly hydrated ions and the surface of Sephadex® G-10 are determining their behavior. These techniques are compared in Table 3 (Endom et al., Reference Endom, Hertz, Thul and Zeidler1967; Collins, Reference Collins1997; Kiriukhin and Collins, Reference Kiriukhin and Collins2002).
Table 2. Jones–Dole viscosity B coefficients

Source: Phosphate, formate, and perchlorate from Krestov (Reference Krestov1991); all others from Robinson et al. (Reference Robinson, Strottmann and Stellwagen1981).
Table 3. Sign change in variables describing ion–water interactions

The strength of water–water interactions in bulk solution, that is, the ‘null point’ for water affinity effects as indicated by the arrows between Na+ and K+ for the cations and between F− and Cl− for the anions in Table 3, does not exist in continuum electrostatic models because it is outside of the world defined by these models [see diagram in Collins (Reference Collins2012)]. Neither do the weakly hydrated ions beneath the null point in Table 3 exist in continuum electrostatics models; the water adjacent to these weakly hydrated ions tumbles more rapidly than bulk water as shown by NMR, NDIS, and Jones–Dole viscosity B-coefficients, and these adjacent water molecules tumble faster as the charge density on the ion decreases (i.e. as the ion becomes larger). One cannot meaningfully represent these weakly hydrated ions which are actually controlled by water affinity forces to be strongly hydrated ions controlled by dispersion forces.
Apparent dynamic hydration number
This simple technique of aqueous Sephadex® G-10 size exclusion chromatography, which uses inexpensive equipment, effectively allowed us to measure the number of water molecules that move with the ion as long as the water–ion lifetime was at least a few picoseconds (Table 4) (Kiriukhin and Collins Reference Kiriukhin and Collins2002). We were even able to determine the apparent dynamic hydration number of the proton and of the hydroxide ion, and may have been the first (in 2002) to establish the ‘Zundel proton’ (the di-hydrate) as the correct form of the proton at 0.1 M (Kiriukhin and Collins, Reference Kiriukhin and Collins2002; Reed Reference Reed2013). The four calibration points available to us establish that the ‘apparent dynamic hydration number’ is also the true ‘dynamic hydration number’. The most informative points of comparison between gel sieving chromatography and other techniques are where natural discontinuities occur: the change from weak to strong hydration between K+ and Na+ as determined by neutron and X-ray diffraction with isotopic substitution (Enderby, Reference Enderby1995) and by Jones–Dole viscosity B-coefficients (Collins, Reference Collins1997); the change from weak to strong hydration between Cl− and F− as determined by Jones–Dole viscosity B-coefficients (Collins, Reference Collins1997); the change from weak to strong second-shell hydration between Mg2+ [as shown by solution X-ray diffraction (Skipper et al., Reference Skipper, Neilson and Cummings1989)] and Be2+ [as shown by ab initio molecular orbital calculations (Bock and Glusker, Reference Bock and Glusker1993)] and solution neutron diffraction studies (Mason et al., Reference Mason, Ansell, Neilson and Brady2008) or Cr3+ [as shown by solution neutron (Broadbent et al., Reference Broadbent, Neilson and Sandstrom1992) and X-ray diffraction (Munoz-Paez et al., Reference Munoz-Paez, Pappalardo and Marcos1995)] and the change from an inner sphere coordination number of six for Mg2+ (Skipper et al., Reference Skipper, Neilson and Cummings1989) to four for Be2+ (Bock and Glusker, Reference Bock and Glusker1993; Mason et al., Reference Mason, Ansell, Neilson and Brady2008). The apparent dynamic hydration numbers determined by gel sieving chromatography on Sephadex® G-10 are in excellent agreement with these calibration points from other techniques.
Table 4. Apparent dynamic hydration numbers (Kiriukhin and Collins, Reference Kiriukhin and Collins2002)

When the Sephadex® G-10 is properly calibrated with 18O-water and negatively charged polyglutamate of molecular weight 13 700 at pH 7 (as it was for the dynamic hydration number determinations), the behavior of ions on the column correlates well with the sign of their Jones–Dole viscosity B-coefficients; this implies that the polyglycine polymers used to calibrate the column are ideal solutes – i.e. that they bind water as strongly as water binds itself. This means that the hydration/dehydration of the peptide backbone associated with the unfolding/folding of the globular protein plays a neutral role, not favoring either conformational state.
The Law of Matching Water Affinity
Ions of opposite charge form contact ion pairs in solution when they have matching water affinities
The Law of Matching Water Affinity states that ions of opposite charge tend to form contact ion pairs in solution when they have matching water affinities (Fig. 20) (Morris, Reference Morris1969; Collins, Reference Collins1997, Reference Collins2004). Since water affinity is a strong function of ion size [small ions of high charge density bind water strongly whereas large monovalent ions of low charge density (K+ and larger for cations; Cl− and larger for anions) bind water weakly], small ions tend to form contact ion pairs with each other and large ions tend to form contact ion pairs with each other, but large-small contact ion pairs tend not to form (Collins Reference Collins2004). This same pattern is manifested in the solubility of the alkali halides (see below) (Collins, Reference Collins1997). The small ions of opposite charge form contact ion pairs because of electrostatic attraction; the large ions of opposite charge form contact ion pairs because this releases weakly hydrated water which becomes strongly interacting water in bulk solution.

Fig. 20. Volcano plots. (A) Relationship between the standard heat of solution of a crystalline alkali halide (at infinite dilution) in kcal mol−1 on the y-axis and the difference between the absolute heats of hydration of the corresponding gaseous anion and cation, also in kcal mol−1 on the x-axis (Morris, Reference Morris1969). © 1969 reprinted with kind permission from Springer Science & Business Media. (B) Identification of ions as weakly hydrated or strongly hydrated. The enthalpy of solution of weakly hydrated-weakly hydrated and strongly hydrated-strongly hydrated salts tends to be positive (takes up heat), whereas for the enthalpy of solution to be negative (gives off heat), the salt must have a strongly hydrated ion and a weakly hydrated ion.
In 1969, D.F.C. Morris generated ‘volcano plots’ for the alkali halides based on either the absolute free energy of hydration of the constituent ions or the absolute enthalpy of hydration of the constituent ions (Morris, Reference Morris1969). In 1997, when we first concluded that these plots indicated small-small and large-large contact ion pair formation, they were discussed in terms of the absolute free energies of hydration of the constituent ions (Collins, Reference Collins1997); in 2004, we concluded that the absolute enthalpies of hydration of the constituent ions gave a better fit to the data and that they therefore gave rise to the Law of Matching Water Affinity (Collins, Reference Collins2004).
The heat of solution of the alkali halides plotted as a function of the difference in the water affinity of the constituent ions (a volcano plot) supports the Law of Matching Water Affinities
We shall interpret Fig. 20 to indicate that oppositely charged ions with equal water affinity tend to stay together in solution as contact ion pairs whereas oppositely charged ions with differing water affinities tend to separate. We shall attribute the release of heat to the formation of strong bonds and the uptake of heat to the breaking of strong bonds, and shall assume that the strongest interactions in the system will tend to dominate the behavior of the system. In aqueous salt solutions of small ions of high charge density which are strongly hydrated and large ions of low charge density which are weakly hydrated, the interactions in order of decreasing strength are as follows: small–small > small-water > water–water > large-water > large–large (Collins, Reference Collins1997). Figure 20 shows the relationship between the standard heat of solution of a crystalline alkali halide at infinite dilution (on the vertical axis; this is an experimental quantity) and the difference between the absolute heats of hydration of the constituent gaseous anion and cation [on the horizontal axis; this is a calculated quantity (Fig. 21)]. (In this context, ‘absolute’ refers to the conceptual experiment of transferring an isolated ion from the gas phase to the solution.) Figure 20 illustrates that a necessary but not sufficient condition for the standard heat of solution of a crystalline alkali halide to be negative (exothermic) is that one of the ions be large and the other ion to be small, suggesting that small plus large neutral salts dissociate extensively upon dissolution, and that the small ion of this salt acquires stronger interactions with water in solution than it has with large ions in the crystal, thus tending to release heat (Fig. 22). In contrast, when crystalline small–small alkali halides dissolve in water, the strongly interacting small–small ion pairs will tend to stay together, and moderately strong water–water interactions are replaced by weaker water–ion pair interactions, thus tending to take up heat. When crystalline large–large alkali halides dissolve in water, relatively strong water–water interactions will keep the large ion pairs together, and moderately strong water–water interactions are replaced by weaker water–ion pair interactions, thus tending to take up heat. These patterns suggest that oppositely charged ions with equal water affinities will tend to form contact ion pairs in solution, whereas those with differing water affinities will tend to separate (Collins, Reference Collins1997). In simplest possible terms, (strongly hydrated) small ions pair with (strongly hydrated) small ions and (weakly hydrated) large ions pair with (weakly hydrated) large ions (Fig. 23). Since all of the salts in the volcano plot are monovalent, the long-range electric fields generated by each salt must be very similar, and the dramatic differences in their behavior must be due to the differences in the strength of their short range (electro-chemical) interactions with water. Forming a contact ion pair requires a partial dehydration of both the positive and negative ion, which occurs most readily when both ions have the same water affinity. A simple model can be used to show that the relative affinity of a monovalent ion for water closely correlates with its relative affinity for monovalent ions of opposite charge (Collins, Reference Collins1997). Therefore, when one ion is more strongly hydrated than its oppositely charged partner, dehydrating the more strongly hydrated ion costs more in energy than is gained by forming a contact ion pair with the more weakly hydrated ion, and thus these ions tend to stay apart. The issue of charge density-dependent microscopic hydration–dehydration is not included in the electrostatic calculation using the macroscopic dielectric constant, but energetically it actually dominates and controls the process of contact ion pair formation (Collins et al., Reference Collins, Neilson and Enderby2007). Evidence for contact ion pairing in water comes from protein X-ray crystallography (Dauter et al., Reference Dauter, Dauter, de La Fortelle, Bricogne and Sheldrick1999; Vaney et al., Reference Vaney, Broutin, Retailleau, Douangamath, Lafont, Hamiaux, Prange, Ducruix and Riès-Kautt2001; Pokhrel et al., Reference Pokhrel, McConnell and Brudvig2011; Benas et al., Reference Benas, Auzeil, Legrand, Brachet, Regazzetti and Riès-Kautt2014; Fox et al., Reference Fox, Kang, Sherman, Heroux, Sastry, Baghbanzadeh, Lockett and Whitesides2015) and dielectric spectroscopy (Buchner and Hefter, Reference Buchner and Hefter2009) in addition to those techniques discussed in the context of the Law of Matching Water Affinity above and below. The Law of Matching Water Affinity is supported by molecular dynamics simulations of the alkali halides (Fennell et al., Reference Fennell, Bizjak, Vlachy and Dill2009; Shi and Beck, Reference Shi and Beck2017) and by activity coefficients (Kunz, Reference Kunz2010) as well as by other techniques discussed below.
Fig. 21. Calculated absolute enthalpy (heat) of solution of single ion components of simple salts. © 2019 by Kim D. Collins.
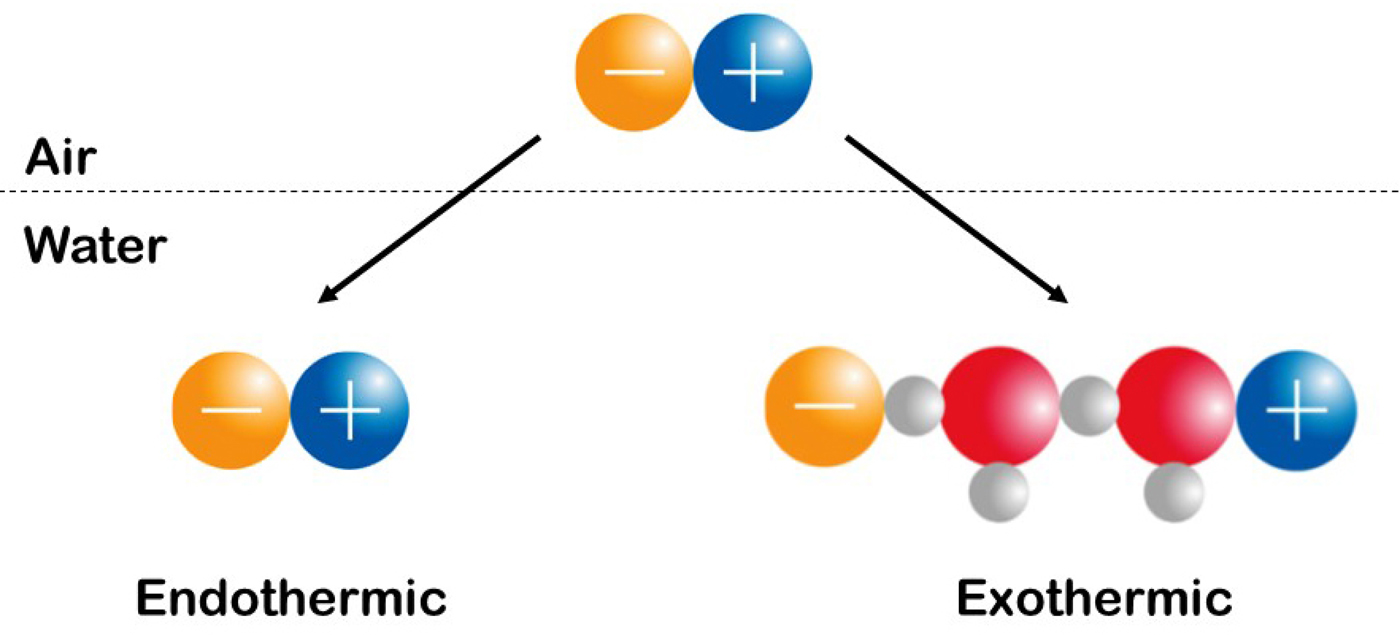
Fig. 22. Experimentally measure the enthalpy (heat) of solution of simple salts. See text for explanation. © 2019 by Kim D. Collins.
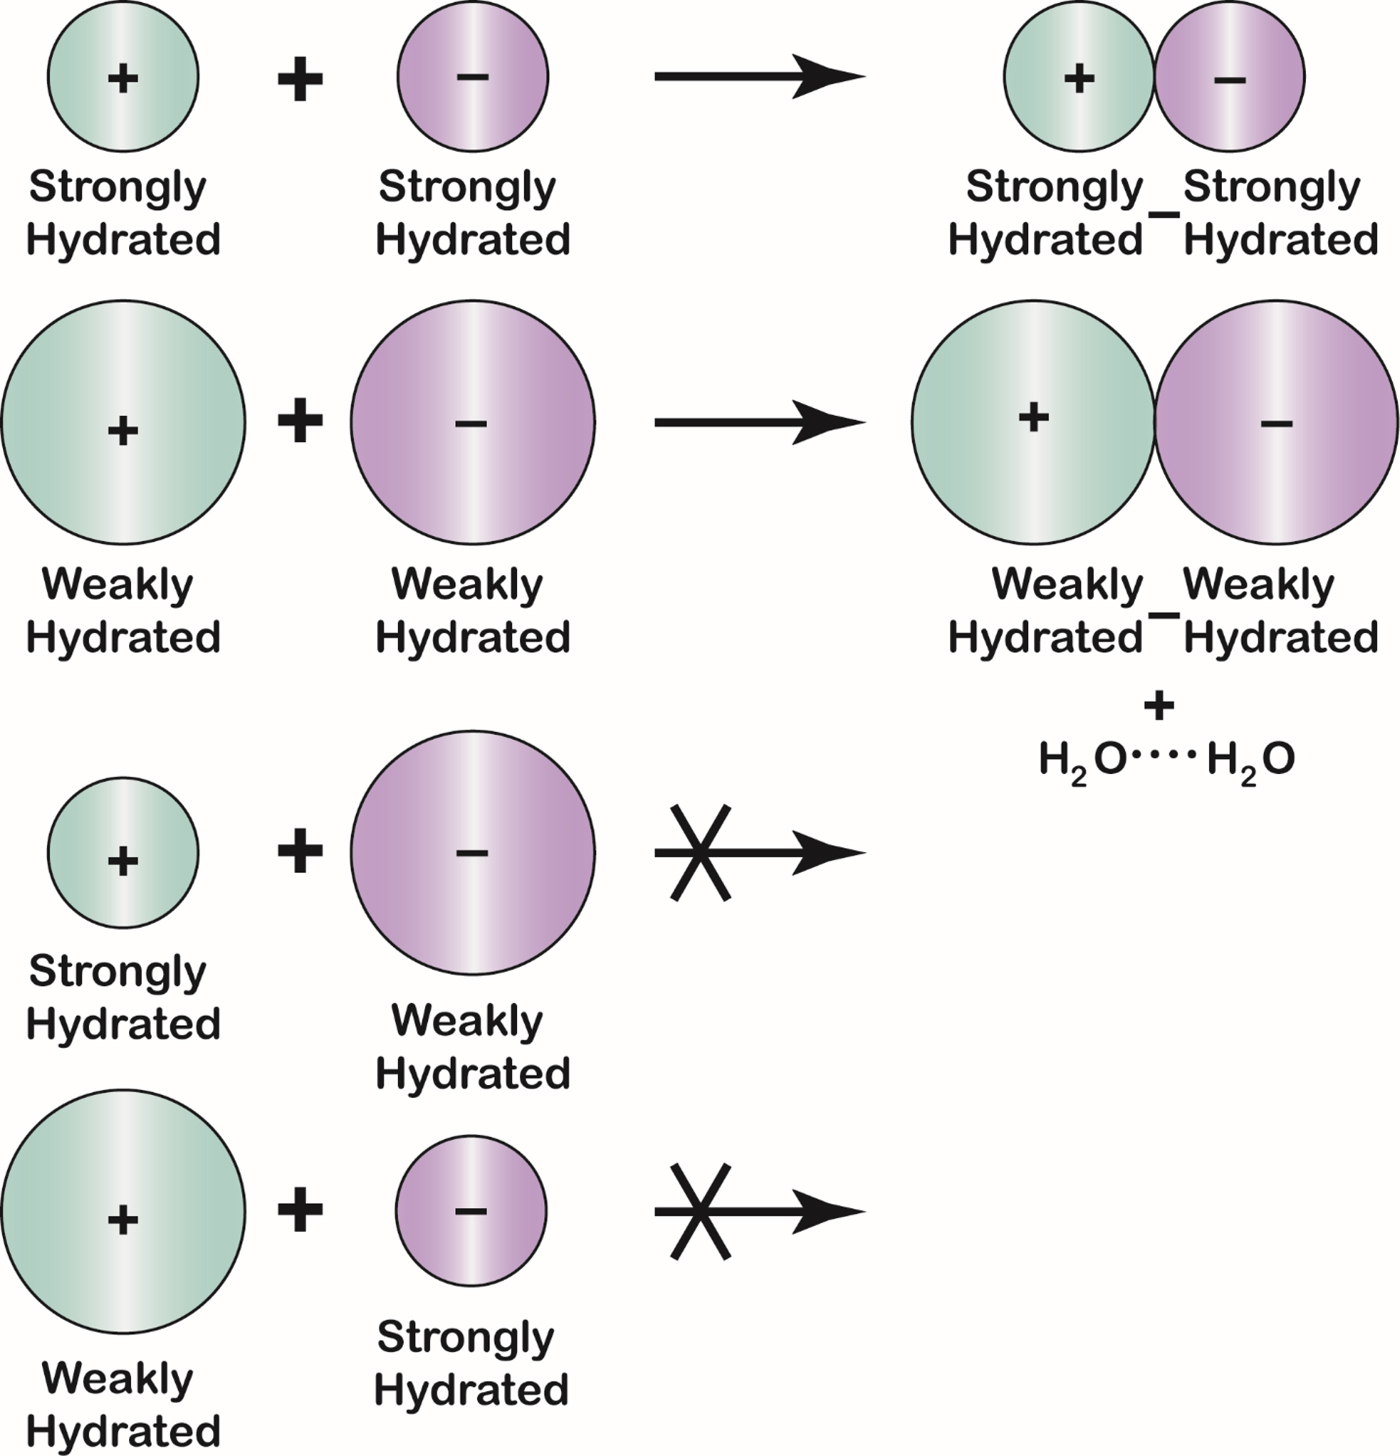
Fig. 23. The Law of Matching Water Affinity. Because the charge density of an ion controls its water affinity, ion size controls the tendency of oppositely charged ions to form inner sphere ion pairs. Small ions of opposite sign spontaneously form inner sphere ion pairs in aqueous solution; large ions of opposite sign spontaneously form inner sphere ion pairs in aqueous solution; and mismatched ions of opposite sign do not spontaneously form inner sphere ion pairs in aqueous solution. A large monovalent cation has a radius larger than 1.06 Å; a large monovalent anion has a radius larger than 1.78 Å.
The solubility of the alkali halide salts correlates with the charge density and thus the water affinity of their constituent ions
Although lattice enthalpies play a role (Perkyns and Pettitt, Reference Perkyns and Pettitt1994; Shriver et al., Reference Shriver, Atkins and Langford1994), the solubility of simple salts appears to be controlled largely by the tendency of the constituent ions to form contact ion pairs in solution as shown by the pattern of their solubility: salts composed of ions with similar water affinities have lower solubility. ‘For example, both Li+ and F− are strongly hydrated, and thus tend to form contact ion pairs (the first step in the process of coming out of solution), whereas Cs+ is weakly hydrated (Ramos et al., Reference Ramos, Neilson, Barnes and Buchanan2005), and will tend to stay away from F−. The solubility of LiF in water is only 0.1 M at 18 °C. In contrast, the solubility of CsF at 18 °C is 24.2 M or 48.4 M in ions, and since pure water is about 55.5 M, a saturated solution of CsF contains only about one water molecule per ion’ (Collins et al., Reference Collins, Neilson and Enderby2007). It is worth noting that The Law of Matching Water Affinity provides a reasonable explanation for the solubility of the alkali halides (Collins, Reference Collins1997) whereas continuum electrostatics (lattice enthalpy) models do not (Perkyns and Pettitt, Reference Perkyns and Pettitt1994).
The interaction of cations with proteins
In 1996, Wolff et al. (Reference Wolff, Sackett and Knipling1996) showed that alkali metal cations increase the rate of polymerization of pure tubulin driven by either taxol or dimethyl sulfoxide according to the sequence Na+ > K+ > Li+ > Cs+, with an optimum concentration for Na+ at ≈160 mM. Because both the α and β monomers of nearly all tubulins carry considerable excess anionic charge, particularly at the C termini, added cations allow polymerization by binding to protein carboxylates and eliminating repulsive anionic interactions in the monomer. Figure 24 shows that the most rapid tubulin polymerization correlates linearly with the smallest difference in water affinity between the added cation and the protein carboxylate as measured by their Jones–Dole viscosity B-coefficients; that is to say, these data support the prediction of The Law of Matching Water Affinity that Na+ is the best monovalent cation binder to the carboxylate (Collins Reference Collins2006). This result is confirmed by molecular dynamics simulations (Vrbka et al., Reference Vrbka, Vondrasek, Jagoda-Cwiklik, Vacha and Jungwirth2006). [Anions have also been shown to bind the active site Zn++ of human carbonic anhydrase II according to the Law of Matching Water Affinities (Fox et al., Reference Fox, Kang, Sherman, Heroux, Sastry, Baghbanzadeh, Lockett and Whitesides2015).]

Fig. 24. The maximal rate of tubulin polymerization versus the difference in Jones–Dole viscosity B coefficients between added monovalent cations and the tubulin carboxylates (Collins, Reference Collins2006). The Jones–Dole viscosity B coefficients for the carboxylate (0.052), Na+ (0.086), K+ (−0.007), Cs+ (−0.045) and Li+ (0.150) are measures of the water affinity of these ions. The Law of Matching Water Affinities states that those ions with matching water affinity are those which will most readily form inner sphere ion pairs. The difference in Jones–Dole viscosity B coefficients of two ions is a measure of their mismatch in water affinity. Therefore Na+ has the greatest tendency to bind to carboxylates, followed by K+, followed by Li+, followed by Cs+. © 2005 Elsevier B.V. All rights reserved.
It was shown in 1956 (Bello et al., Reference Bello, Riese and Vinograd1956), 1962 (Von Hippel and Wong, Reference von Hippel and Wong1962) and 1964 (von Hippel and Wong, Reference von Hippel and Wong1964) that MgCl2 affects the helix–coil transition of the fibrous protein collagen. However Hofmeister found that MgCl2, by his procedure, did not affect the solubility of globular egg white protein (Hofmeister, Reference Hofmeister1888; Hofmeister, Reference Hofmeister2004), and Hofmeister effects are typically studied on globular proteins. It was shown in 1984 (Arakawa and Timasheff, Reference Arakawa and Timasheff1984) that Mg2+ does bind to surface carboxylates of globular proteins. It was shown in 1965 (Robinson and Jencks, Reference Robinson and Jencks1965), 1966 (Bello et al., Reference Bello, Haas and Bello1966) and 1969 (von Hippel and Schleich, Reference von Hippel and Schleich1969) that Ca2+ seems to act on globular proteins mostly by complexing with the amide moiety.
In 2014 (Benas et al., Reference Benas, Auzeil, Legrand, Brachet, Regazzetti and Riès-Kautt2014), the adsorption of Rb+, Cs+, Mn2+, Co2+ and Yb3+ onto the positively charged hen egg white lysozyme was studied by X-ray crystallography and electrospray ionization mass spectrometry; Rb+ and Cs+ bound preferentially to carbonyl groups whereas the multivalent Mn2+, Co2+ and Yb3+ interacted with carboxylate groups. A summary of specific ion effects on proteins was published in 2017 (Okur et al., Reference Okur, Hladilkova, Rembert, Cho, Heyda, Dzubiella, Cremer and Jungwirth2017).
The roles of charge groups in protein structure and function
Supercharged green fluorescent protein
Green fluorescent protein (GFP) is an intensely studied protein which is 238 amino acids long. A ‘superfolder’ variant of GFP which had been highly optimized for folding robustness and resistance to denaturants had a net charge of −7. Its surface residues were mutagenized to produce either +36 or −30 ‘supercharged’ variants that were only slightly less stable than the starting version (Fig. 25) (Lawrence et al., Reference Lawrence, Phillips and Liu2007). When expressed in E. coli, these supercharged variants folded normally (bringing the charges closer together) showing that the like-charged side chains were not experiencing strong repulsive forces between each other. This indicates that there must have been an oppositely charged counterion near each of the surface charges thus neutralizing any electrostatic interactions.
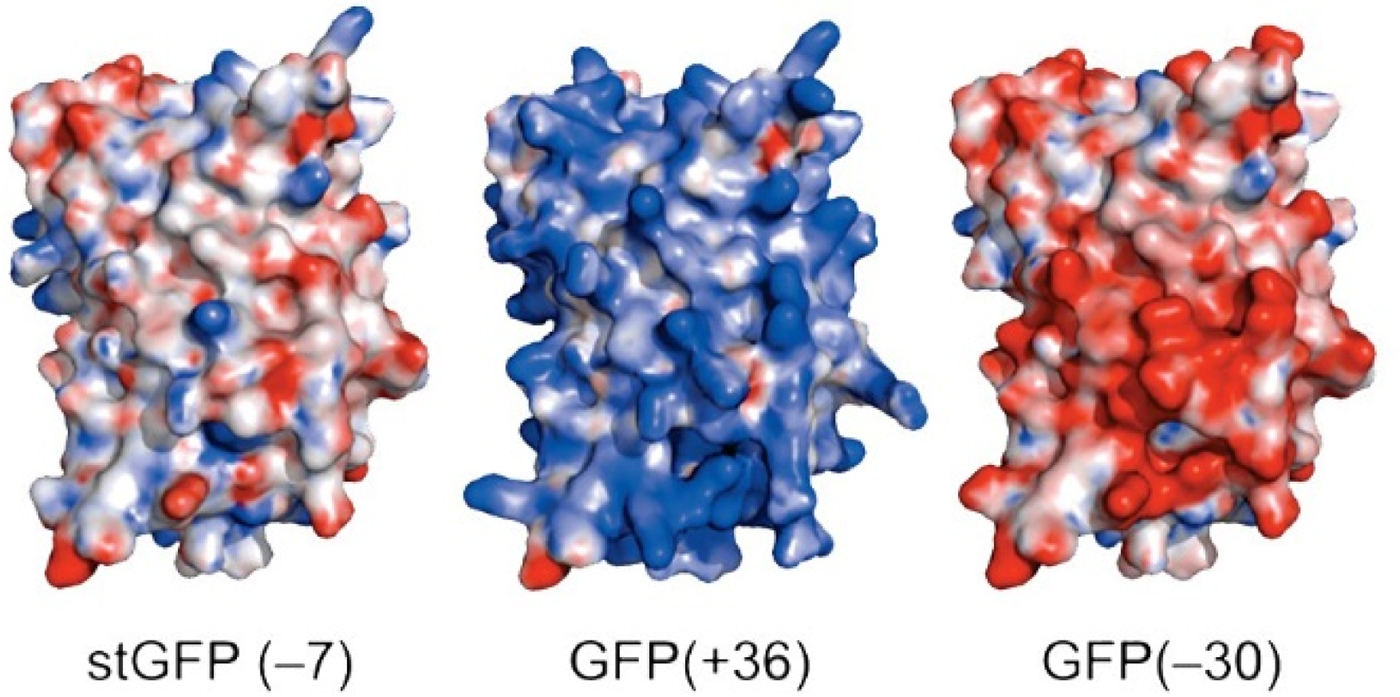
Fig. 25. Supercharged variants of GFP (Lawrence et al., Reference Lawrence, Phillips and Liu2007). Red indicates negatively charged carboxylate side chains. Blue indicates positively charged arginine and lysine side chains. From Lawrence et al. (Reference Lawrence, Phillips and Liu2007) (https://pubs.acs.org/doi/10.1021/ja071641y). Further permissions should be directed to the American Chemical Society.
Increased negative surface charge correlates with increased solubility on seven different proteins
Kramer et al. (Reference Kramer, Shende, Motl, Pace and Scholtz2012) in 2012 determined the solubility of seven different globular proteins as a function of the fraction of positive or negative charges on the protein accessible surface area; while the positive protein surface charges (which are weakly hydrated) had no effect on protein solubility, the negative surface charges (which are strongly hydrated) produced a large increase in protein solubility (Fig. 26).

Fig. 26. Globular protein solubility increases with the number of (strongly hydrated) negatively charged surface carboxylates, but not with the number of (weakly hydrated) positively charged surface amino acid side chains (Kramer et al., Reference Kramer, Shende, Motl, Pace and Scholtz2012). ASA = accessible surface area. Protein solubility was measured by (NH4)2SO4 precipitation (on the right) and polyethyleneglycol precipitation (on the left). From Kramer et al. (Reference Kramer, Shende, Motl, Pace and Scholtz2012). © 2012 Biophysical Society. Published by Elsevier Inc.
Normal fibrin polymerization (blood clotting) requires the binding of physiological Cl−
Fibrinopeptides must polymerize into a fine net to trap platelets to the site of injury and initiate processes that stop the bleeding and promote wound repair and healing. For this reason blood clotting requires the binding of (weakly hydrated) Cl− to protein (weakly hydrated) positive charges to increase the pK a of a basic group on the peptide and prevent the growth of thicker, stiffer and straighter fibers which make a poor net. (Strongly hydrated) F− is inert in this assay as predicted by the Law of Matching Water Affinity which predicts that it should not bind to peptide (weakly hydrated) positive charges; thus F− allows the unphysiological thicker, stiffer and straighter fibers to form (Fig. 27) (Di Stasio et al., Reference Di Stasio, Nagaswami, Weisel and Di Cera1998). Figure 28 shows that strongly hydrated acetate, like F−, also does not bind to the weakly hydrated positive charges on proteins and thus produces a thick fiber abnormal clot, whereas the weakly hydrated Cl−, Br− and I− do bind to the weakly hydrated positive charges on proteins and thus produce the thin, normal fibrin net which leads to blood clotting. The K d for Cl− binding to protein positive charges is from 133 (Overman and Lohman, Reference Overman and Lohman1994) to 150 mM (Makhatadze et al., Reference Makhatadze, Lopez, Richardson and Thomas1998); the physiological concentration of NaCl is 145 mM (Vindigni and Di Cera, Reference Vindigni and Di Cera1996), indicating that about half of the positive charges on blood proteins are binding Cl−.

Fig. 27. Scanning electron micrographs of fibrin clots grown in the presence of NaCl or NaF (Di Stasio et al., Reference Di Stasio, Nagaswami, Weisel and Di Cera1998). (A) Abnormal thicker, stiffer, straighter fibrin clots grown in 150 mM NaF plus 50 mM NaCl (F− is inert in this system; some Cl− is required to keep the fibrin clots in solution). (B) Normal fibrin clots grown in 200 mM NaCl. From Di Stasio et al. (Reference Di Stasio, Nagaswami, Weisel and Di Cera1998). © 1998 The Biophysical Society. Published by Elsevier Inc.

Fig. 28. Turbidity of fibrin clots developed in the presence of different salts, at I = 200 mM kept constant with NaF (Di Stasio et al., Reference Di Stasio, Nagaswami, Weisel and Di Cera1998). Turbidity is measured as A 350. The strongly hydrated acetate is inert in this system, whereas the weakly hydrated Cl−, Br−, and I− are active and bind to the weakly hydrated positive charges on the protein, inhibiting aggregation and leading to the physiologically active thinner fibers. From Di Stasio et al. (Reference Di Stasio, Nagaswami, Weisel and Di Cera1998). © 1998 The Biophysical Society. Published by Elsevier Inc.
Protein crystallization consists of two parts: (1) binding the necessary ions to produce a neutral complex and (2) dehydrating the protein surface, including the carboxylates, to allow protein–protein contacts
The H1 collagenase has a pI of 4.1 and is a model for acidic proteins. At pH 7.2 (and 18 °C) it has about 26 negative charges (carboxylates) and 13 positive charges (lysines and arginines). Figure 29 (Riès-Kautt and Ducruix, Reference Riès-Kautt and Ducruix1997) shows that H1 collagenase is crystallized most effectively by the strongly hydrated di- and tri-valent anions phosphate, sulfate and citrate (as the ammonium salts), which at high concentrations are able to dehydrate the surface carboxylates. That is, dehydrating the surface carboxylates is the energetically difficult step for crystallization of acidic proteins at neutral pH.

Fig. 29. Solubility of acidic H1 collagenase at pH 7.2, 18 °C, and in the presence of various ammonium salts (Riès-Kautt and Ducruix, Reference Riès-Kautt and Ducruix1997). From Riès-Kautt and Ducruix (Reference Riès-Kautt and Ducruix1997) © 1997 by Elsevier Inc.
Hen egg white lysozyme has a pI of 11.1 and is a model for basic proteins. At a pH of 7 it has about 18 positive charges (lysines and arginines) and nine negative charges (carboxylates). At pH 4.5 (and 18 °C), most of the carboxylates are protonated, so there are few carboxylates that need to be dehydrated for crystallization. The energetically difficult step in crystallizing basic proteins is to produce a net neutral complex by binding (weakly hydrated) anions to the proteins' (weakly hydrated) cationic groups. Thus the very weakly hydrated thiocyanate is the most effective crystallizing anion (Fig. 30) (Riès-Kautt and Ducruix, Reference Riès-Kautt and Ducruix1997). [In 1998, thiocyanate was also shown to interact with the amide backbone of Arg42 in bovine pancreatic trypsin inhibitor by using NMR (Jolivalt et al., Reference Jolivalt, Bockmann, Riès-Kautt, Ducruix and Guittet1998).] The strongly hydrated anions acetate, phosphate and citrate bind only very weakly to the (weakly hydrated) positive charges on the protein and thus are poor crystallizing salts.

Fig. 30. Solubility of basic lysozyme as a function of ionic strength in the presence of various salts, at pH 4.5 and 18 °C (Riès-Kautt and Ducruix, Reference Riès-Kautt and Ducruix1997). From Riès-Kautt and Ducruix (Reference Riès-Kautt and Ducruix1997). © 1997 by Elsevier Inc.
A note on osmolytes
(Net neutral) osmolytes have very similar hydration properties to those of ions. Stabilizing osmolytes with a strongly hydrated portions such as trimethylamine N-oxide and betaine act primarily by competing for the water solvating the transiently exposed peptide backbone, driving the latter back into the interior of the protein (Bolen and Baskakov, Reference Bolen and Baskakov2001; Auton et al., Reference Auton, Rosgen, Sinev, Holthauzen and Bolen2011); presumably sodium malonate, the most effective salt for crystallizing proteins, does much the same (McPherson, Reference McPherson2001). (Weakly hydrated) urea, in contrast, denatures proteins by increasing the availability of water to solvate the peptide backbone and also by adsorbing to the surfaces of buried nonpolar amino acid side chains, pulling them into solution (Moeser and Horinek, Reference Moeser and Horinek2014).
Ions in enzyme active sites
The forces stabilizing proteins have recently been summarized (Pace et al., Reference Pace, Scholtz and Grimsley2014). Enzymes typically have loops which close over the active site, producing a nearly anhydrous protein box (Zhai et al., Reference Zhai, Go, O'Donoghue, Amyes, Pegan, Wang, Loria, Mesecar and Richard2014) in which electrostatic interactions can be strong. Charged substrate binding groups such as phosphate mono-esters can grip the protein strongly and pull it into its rigid, tightly packed transition state binding conformation (Richard, Reference Richard2019) where catalysis is facilitated by strong local electric fields (Fried and Boxer, Reference Fried and Boxer2017) such as in low barrier hydrogen bonds (Graham et al., Reference Graham, Buytendyk, Wang, Bowen and Collins2014).
Future prospects
Until recently, work on the basic physics of aqueous solutions and on the physical biochemistry of biological macromolecules has been undertaken largely to facilitate our ability to study pre-existing structures such as enzymes which are the targets of small molecule drugs. We are now entering a new era in which we are creating new structures or structures with new activities (Howes, Reference Howes2019). For example, one of the fastest growing classes of pharmaceuticals is monoclonal antibodies targeted to human regulatory proteins which control fundamental processes such as cell replication or immune function (Chiu and Gilliland, Reference Chiu and Gilliland2016; Lonberg and Korman, Reference Lonberg and Korman2017). These drugs are given by injection and require very concentrated solutions so that a monthly injection can achieve clinical activity. A large financial incentive therefore exists for developing the ability to produce highly soluble antibodies, which can be done with the principles described here.


 Open access