
Abstract
Typical in vitro barrier and co-culture models rely upon thick semi-permeable polymeric membranes that physically separate two compartments. Polymeric track-etched membranes, while permeable to small molecules, are far from physiological with respect to physical interactions with co-cultured cells and are not compatible with high-resolution imaging due to light scattering and autofluorescence. Here we report on an optically transparent ultrathin membrane with porosity exceeding 20%. We optimize deposition and annealing conditions to create a tensile and robust porous silicon dioxide membrane that is comparable in thickness to the vascular basement membrane (100–300 nm). We demonstrate that human umbilical vein endothelial cells (HUVECs) spread and proliferate on these membranes similarly to control substrates. Additionally, HUVECs are able to transfer cytoplasmic cargo to adipose-derived stem cells when they are co-cultured on opposite sides of the membrane, demonstrating its thickness supports physiologically relevant cellular interactions. Lastly, we confirm that these porous glass membranes are compatible with lift-off processes yielding membrane sheets with an active area of many square centimeters. We believe that these membranes will enable new in vitro barrier and co-culture models while offering dramatically improved visualization compared to conventional alternatives.
Export citation and abstract BibTeX RIS

Original content from this work may be used under the terms of the Creative Commons Attribution 3.0 licence. Any further distribution of this work must maintain attribution to the author(s) and the title of the work, journal citation and DOI.
Introduction
Membranes are used in cell culture for a variety of applications including cell migration assays [1, 2], tissue barrier models [3–5] and cellular co-culture systems [6–12]. One application of co-culture models is the induction of stem cells. Stem cell differentiation has been effectively implemented through use of co-culture models where a second cell type modulates the microenvironment and induces the stem cells through direct contact and paracrine signaling [9, 11, 13, 14]. Co-culture systems are also utilized to create better tissue barrier models than are possible with single monocultures. For example, recapitulation of the blood brain barrier (BBB) is more successful when endothelial cells are co-cultured with astrocytes or glial cells. The barrier function as measured by transendothelial electrical resistance (TEER) and expression of endothelial junctional proteins is dramatically improved in co-cultures compared to isolated monolayers [3, 15].
In vitro barrier and co-culture models require a porous membrane or scaffold to recreate the physiological microenvironment. The porous support facilitates paracrine signaling between co-cultured cells that are physically separated. In many cases, direct contact and formation of gap junctions is not only more physiological but also critical for function [3, 9, 16]. Due to the exploratory nature of these studies, simple high-resolution imaging is also critical to visualize barrier maturity and differentiation. Existing membranes are not sufficient to meet these needs for several reasons. Polymeric track-etched membranes are available with a variety of pore sizes including sub-micron pores that prevent transmigration, but they are typically 10 μm in thickness and hinder physical contact between co-cultured cells on opposite faces of the membrane [17]. Additionally, track-etched membranes suffer from significant scattering in light microscopy [18], limiting live-imaging and requiring users to cut out and mount membranes post-fixation [19]. Research membranes have been fabricated using novel techniques, but most are still thicker than physiological barriers such as the basement membrane [10, 18], which is just several hundred nanometers in thickness [20].
MEMS and microfabrication techniques can be utilized to create thin films of precise thickness with controlled features or pores using materials of high optical quality. Previous attempts to fabricate silicon-based membranes were promising but had several limitations for use in cell culture. Ultrathin porous nanocrystalline silicon (pnc-Si) membranes are robust, but only when dimensions remain below one square millimeter [21–23]. Silicon nitride membranes offer more stability [24], but previous cell culture experiments relied upon membranes 1 μm in thickness and used expensive and time-consuming electron beam lithography to fabricate sub-micron pores [3]. To scale-up ultrathin membranes to more conventional and useful sizes, we previously demonstrated lift-off and scaffolding processes, which resulted in sheets of 50 nm thick porous silicon nitride membranes [25]. Alternatively, thin sheets of cast polydimethylsiloxane (PDMS) have been used for barrier models, including lung epithelium [7, 26]. The flexibility and strain of PDMS under cyclic loading has added another realistic element to the recapitulation of the lung where physiological stretch is significant. However, PDMS has not been widely adopted for several reasons including its fragility below approximately 10 μm in thickness, large pore sizes that cannot prevent transmigration and concern over absorption of hydrophobic drugs and dye molecules [27].
We hypothesize that an ultrathin porous glass membrane would meet the needs of barrier and co-culture models, while providing unparalleled imaging quality. Thin films of SiO2, however, are typically compressive and likely too fragile for routine cell culture and lift-off. Additionally, the compressive nature of a thin film will result in a wrinkled substrate, where seeded cells may settle and concentrate in the valleys at different focal planes. Our general aim in this study is to fabricate a robust and tensile ultrathin (100–300 nm) porous SiO2 membrane. It has been shown that the film stress of SiO2 layers from tetraethoxysilane (TEOS, Si(OC2H5)4)-based plasma-enhanced chemical vapor deposition (PE-CVD) can be controlled through the use of a dual frequency deposition method [28, 29]. Alternating layers are deposited with high-frequency (HF, 13.56 MHz) and low-frequency (LF, 50–400 kHz) plasmas using two separate RF power supplies. The former results in a porous, tensile-stressed film, while the latter results in a dense, compressive one. Van de Ven et al first demonstrated this technique to control the overall film stress of TEOS-derived SiO2 to between 100 MPa (tensile) and −100 MPa (compressive) [28]. More recently, Guan and coworkers expanded on this by demonstrating the ability to stabilize the film stress through annealing [29]. In a series of studies detailing silane-based PE-CVD of SiO2 over a range of deposition conditions and annealing treatments, Haque and coworkers correlate stress behavior with Fourier transform infrared spectroscopy [30–32]. They studied the interactions of water with the SiO2 film and related the film stress to the impurity content and bonding nature of the SiO2 film resulting in a proposed framework for understanding stress evolution in terms of multiple driving forces [30, 31]. Additionally, they showed the stress could be stabilized through annealing treatments or by capping the oxide film with a water-impermeable silicon nitride film [32].
Here, we report on the fabrication methods and characterization of a stable and robust ultrathin porous glass membrane for cell culture. We use PE-CVD of TEOS and control the initial stress of the film by adjusting the high-frequency (HF) power during the deposition. Further, we stabilize the film stress in a slightly tensile state through a 600 °C anneal in nitrogen. This tensile film is substantially more robust than the native film, enabling its use in routine cell culture even when just 300 nm in thickness. We confirm this material is compatible with our previously demonstrated lift-off process, yielding membrane sheets with active area of many square centimeters, which is important for larger scale cell culture devices such as multi-well plates. We found cells responded favorably to the SiO2 membranes with pores of 0.5 and 3.0 μm diameters and porosities up to 22.7%. Cells spread and proliferate on these substrates similarly to tissue culture plastic (TCP). Confocal and phase contrast microscopy as well as autofluorescence measurements confirm that the SiO2 membranes are effectively transparent and provide an ideal imaging platform. Lastly, the ultrathin nature of the membrane facilitates transfer of cytoplasmic cargo via gap junctions or extracellular vesicles between endothelial and adipose-derived stem cells (ADSCs) through the membrane pores.
Experimental section
Membrane fabrication
All SiO2 membranes used in the cell culture studies are chip-supported. These were prepared using standard 150 mm diameter, double-side-polished silicon wafers with 〈100〉 orientation and 300 μm thickness. The processing steps are illustrated in scheme 1. First, 100 nm thick thermal oxide was grown on the wafers in a Bruce tube furnace at 1100 °C. Next, the chip layout and window patterns were created in the rear face oxide layer using standard photolithography and a brief etch in a 10:1 buffered oxide etch with surfactant solution (BOE, Baker), which simultaneously removes the front-side thermal oxide layer. Following standard RCA cleaning, a SiO2 film was deposited on the front-side using PE-CVD of TEOS in an Applied Materials P5000 tool. The deposition was performed using the following conditions at a deposition rate of approximately 8 nm s−1: 390 °C, 1.2 kPa, RF power = 100–150 W, O2 and TEOS flow rates of 285 and 400 sccm, respectively. These conditions result in a tensile film stress of approximately 150 MPa. Film thicknesses were targeted at either 100 or 300 nm and were verified to be within 2% of their targets using a Tencor SpectraMap SM300. Some of the wafers were also annealed for one hour at 600 °C in a nitrogen environment in a Bruce tube furnace.
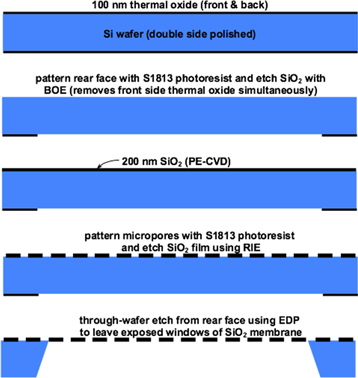
Scheme 1. Schematic illustration of the process flow for fabricating silicon dioxide membranes with micron-scale pores.
Download figure:
Standard image High-resolution imageThe 3.0 μm micropores were patterned using photolithography including a positive photo-resist (Microposit® S1813, Shipley) and G-line exposure with a 5-x stepper (6000-Series DSW Wafer Stepper). The 0.5 μm pores required an I-line exposure (ASML PAS 5000 Stepper) and use of OiR 620 resist (Fuji). Both resists were developed with MF-CD-26 (Shipley). The pore pattern was transferred to the SiO2 layer for both pore sizes with a Reactive Ion Etch (RIE, Drytek 482 Quad Etcher). The RIE conditions were: 13 Pa, RF power = 175 W, SF6 and Ar flow rates of 50 and 100 sccm, respectively, resulting in an etch rate of approximately 1 nm s−1. After the etch, the photoresist was stripped in a 10 min piranha bath soak followed by a five minute deionized water rinse. Finally, the chips and membrane windows were formed in a through-wafer ethylenediamine pyrocatechol (EDP) etch, followed by deionized water rinse.
Film stress and pressure tolerance measurements
The film stress (σf) of SiO2 layers was determined using the Stoney equation [28] which assumes that the thickness of the film is very small compared to that of the substrate and ignores the Young's modulus and Poison's ratio for the film. The surface profiles of the substrates were measured using a Tencor P2 profilometer before and after SiO2 deposition to determine the wafer curvature used in the film stress analysis according to Stoney's equation shown below.

where Es is the Young's modulus of the substrate, νs is the Poisson's ratio of the substrate, hs is the substrate thickness, hf is the film thickness, Rf is the radius of curvature for the substrate with the film, and R0 is the substrate's radius of curvature prior to film deposition. Positive values of film stress are considered tensile and negative ones compressive.
Membrane strength was evaluated using non-porous, 100 nm thick membranes supported as 1 mm square windows in 3.2 mm round silicon chips. The test was performed in an aluminum fixture in which the membrane chip was compressed against Viton O-rings. Nitrogen gas was applied to the membrane and maximum pressure tolerance recorded.
Fabrication of cell culture devices
SiO2 membranes were bonded to custom cut silicone gaskets using ozone bonding as previously described [11]. These devices were then bonded to the bottom of individual wells within TCP 24-well plates and sterilized under a UV lamp. For analysis of spreading and proliferation on control TCP substrates, single silicone gaskets were bonded to the bottom of wells. All surfaces used for cell spreading and proliferation were pre-treated with 1% (final concentration 0.15 mg ml−1) Geltrex™ (Life Technologies, Carlsbad, CA) in phosphate buffered saline (PBS). The solution was aspirated after 30 min at room temperature just prior to seeding cells. The adsorptive Geltrex™ coating did not block or occlude pores as confirmed by high hydraulic permeability and scanning electron microscopy.
Substrate autofluorescence
A 3.0 μm low porosity SiO2 membrane was used in a cell culture device fabricated as previously described [11]. A 3.0 μm low porosity track-etched (TE) ThinCertTM (Greiner Bio-One, Monroe, NC) hanging membrane insert was placed into a 24-well plate. An empty TCP 24-well was used as the control. All substrates were completely submerged in PBS. Substrates were illuminated with metal halide lamp source through the subsequent filter sets: DAPI (350 nm Ex/460 nm Em), FITC (488 nm Ex/525 nm Em), TRITC (561 nm Ex/630 nm Em) on a Leica DMI6000 microscope (Leica Microsystems, Buffalo Grove, IL) using the 10× objective. Images were collected using MetaMorph software with a Rolera em-c2 camera (QImaging, Surrey, BC Canada) for the following exposure times: 100 ms for DAPI, 300 ms for FITC, and 500 ms for TRITC. The Measuring Tool in NIH ImageJ was used to quantify the average intensity values of each substrate, data was normalized to the average intensity value of TCP.
Cell culture
Pooled human umbilical vein endothelial cells (HUVEC) were purchased from Life Technologies (Carlsbad, CA) and used between passages 3–5. All culture media and staining reagents were purchased from Life Technologies unless specified otherwise. HUVEC were cultured in M200 with GIBCO low serum growth supplement (LSGS) containing 2% fetal bovine serum, 1 μg ml−1 hydrocortisone, 10 ng ml−1 human epidermal growth factor, 3 ng ml−1 basic fibroblast growth factor and 10 μg ml−1 heparin (referred to as complete EC media). The media additionally had 100 μg ml−1 penicillin, and 100 μg ml−1 streptomycin. The culture medium was replenished once every 2–3 days and the cells were passaged at 80% confluence. Cells were detached and sub-cultured per manufacturer's instructions using TrypLE.
Cell spreading
For cell spreading experiments, HUVEC were seeded at a density of 500 cells/membrane, which was found to minimize the degree of cell-cell contact after 24 h. After 1, 4, or 24 h, cells were fixed, permabilized, and stained for nuclei (DAPI 1:300) and F-actin cytoskeleton (AlexaFluor488 Phalloidin 1:200). Four 10× tiled images covering each 2 × 2 mm membrane were analyzed, overlapping regions were excluded. The borders of the cells were identified by thresholding the F-actin cytoskeleton images and then converting to a binary image. The spread-area of each cell was found using the measure tool on each binary object. The DAPI channel was used to confirm that each binary object had a single nucleus and that the cell was not undergoing mitosis. More than 50 cells were analyzed for each substrate type. Some analyzed objects were likely dead cells that did not significantly spread. For this reason, the bottom 25% of the data was excluded for each substrate to give a better representative measure of typical spread-area. Box and Whisker plots were created in Microsoft Excel (Seattle, WA) using a custom script. The box represents Q1–Q3 with the median identified as a line. The Whiskers represents Q3 + 1.5 IQR and Q1–1.5 IQR. Outliers are identified by red asterisks. Statistical significance was assessed by two-way analysis of variance (ANOVA) followed by a Student-Newman-Keuls test for post hoc comparisons. Comparisons with p-values <0.01 were considered statistically significant.
Cell proliferation
For proliferation studies, HUVEC were grown on three substrates: 0.5 μm low porosity SiO2 membranes, non-porous SiO2 membranes, and TCP. Cells were seeded at a density of 700 cells/membrane, which resulted in approximately 20% initial coverage. Cells were grown in Basal EC Media (M200 with 2% FBS, 100 μg ml−1 penicillin, and 100 μg ml−1 streptomycin, without growth factors), Complete EC Media, or Complete EC Media supplemented with 50 ng ml−1 VEGF. Each substrate had a sample size of n = 5 for each media condition for a total of 45 unique experiments. Tiled 10x phase contrast images were collected at 1, 2 and 3 days. None of the conditions exceeded ∼85% confluence at day 3. Each day, cells were manually counted over the entire porous region of the membranes at each day and normalized to the cell count at day 1.
Cell monolayer and co-culture imaging
For monolayer formation studies, HUVEC were grown on 0.5 μm low porosity SiO2 membranes and TCP. Cells were seeded at a density of 700 cells/membrane in Complete EC Media. Cells reached confluence after three days at which time they were fixed, permeabilized, and stained for nuclei (DAPI, 1:400), F-actin cytoskeleton (AlexaFluor488 Phalloidin, 1:200), and VE-cadherin (anti-CD144, 1:200). Images were collected immediately after staining with DAPI, FITC, and TRITC fluorescence channels.
For co-culture studies, ADSCs and HUVECs were grown on opposite sides of 0.5 μm low porosity SiO2 membranes and 0.4 μm low porosity ThincertTM hanging membranes. ADSCs were seeded at 5000 cells cm−2 on the apical side of each membrane. HUVEC were seeded at 5000 cells cm−2 on the basal side of each membrane. Cells were grown to confluence then fixed, permeabilized, and stained for nuclei (DAPI, 1:400), F-actin cytoskeleton (AlexaFluor488 Phalloidin, 1:200), and VE-cadherin (anti-CD144, 1:200). The SiO2 membranes were removed from the cell culture devices and placed between two glass coverslips. The ThinCertTM membranes were cut from the hanging insert and placed between a glass slide and coverslip. The samples were imaged using a Leica SP5 confocal microscope microscope with a 40x water immersion objective and Leica HyD hybrid detector. Z-stack image sets with a step size of 1 μm were collected for both membrane types. Images were processed using Leica LAS software. Cross-section images were created using maximum projections from slices of z-stacks with an approximate widths of 5 μm.
Cytoplasmic cargo transfer studies were performed by observing the transfer of CFDA, a fluorescent cytoplasmic dye. HUVEC were seeded on the bottom side of the membrane and grown to confluence. The cells were loaded with CFDA (7.5 μM) for 15 min and then washed twice. ADSCs were seeded on the top surface. After 2 days, the ADSCs were labeled for NG2 (anti-NG2, 1:200; eBioscience, San Diego, CA), a pericyte marker. Cells were then imaged. Dual-labeled ADSCs indicated CFDA transfer from a labeled HUVEC.
Results and discussion
Membrane fabrication and physical properties
The SiO2 membranes used in the cell culture studies are silicon chip-supported windows fabricated according the steps shown in scheme 1. The format of these chips is a 5.4 mm square with an exposed window of membrane in the center of the chip that is 2 × 2 mm (figure 1(E)). The membranes are 300 nm thick in both nonporous and porous formats. The porous membranes were made with high and low density hexagonal, close-packed patterns of pores with 0.5 or 3.0 μm diameters (figure 1). High-density pore spacing has a pitch of 1:2 and low-density pore spacing has a pitch of 1:3. To function effectively as a cell culture substrate, SiO2 membranes must remain flat. This is important for enabling a single field of focus when examining cultures with light microscopy. The deposition of SiO2 by PE-CVD of TEOS and oxygen according to equation (2) is a convenient means of creating films in the range of tens of nanometers to many micrometers. Oxygen is added to increase the deposition rate and promote full reaction of the carbon components in the TEOS decomposition. The rate of deposition is largely a function of the TEOS partial pressure and substrate temperature

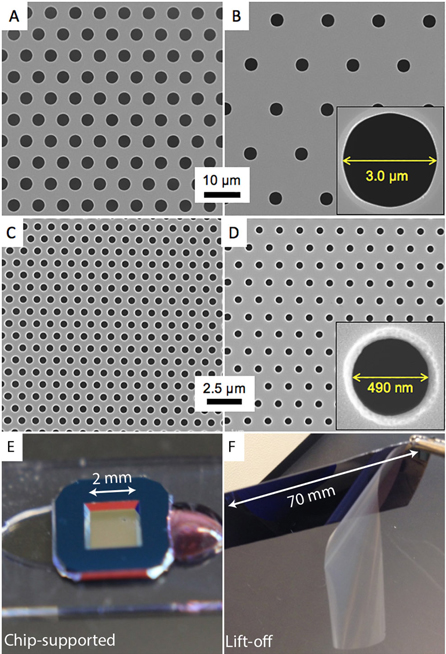
Figure 1. Scanning electron micrographs of chip-supported (A) and (B) SiO2 membranes with 3 μm pores at low density, respectively, and (C) and (D) the same with 0.5 μm pores. The insets in (B) and (D) show high-resolution images of the pores. (E) Chip-supported membranes were fabricated with 2 × 2 mm windows. (F) Lift-off membranes were fabricated as large as 70 × 20 mm.
Download figure:
Standard image High-resolution imageWe found that the film stress of the SiO2 layer could be controlled by adjusting the HF power. Below about 300 W, the stress is tensile and plateaus at a maximum tensile stress of approximately 150 MPa for power levels less than 150 W. It has been discussed in the literature that the film stress of PE-CVD SiO2 films tends to decrease (become more compressive) over the time span of days when exposed to ambient conditions due to the absorption of water [28, 29]. This behavior was observed in the SiO2 membranes studied here and eventually leads to wrinkling of the membrane windows as seen in figure 2.

Figure 2. Results of film stress measurements of annealed (600 °C, 1 h, in nitrogen) and unannealed SiO2 films on silicon wafers. Inset table shows results of burst pressure tests performed on chip-supported non-porous SiO2 membranes. Inset pictures show annealed (Ann., left) and unannealed (Unann., right) membrane chips. Results are averages and standard deviations for seven samples of each type.
Download figure:
Standard image High-resolution imageAs discussed in the Introduction, there are several methods of stabilizing the SiO2 film stress in a tensile state including annealing, deposition of alternating compressive/tensile SiO2 layers, and deposition of a 'capping' layer of either dense SiO2 or silicon nitride. These are all aimed at either reducing the reactivity of strained Si–O groups or preventing the diffusion of water to the reactive sites [29, 30]. For our present aims, the use of alternating or capping layers is less desirable, since the membranes are in some cases patterned with pores. Moreover, the use of a nitride layer would likely diminish the optical quality of the membrane. For these reasons, we focused here on stabilizing the tensile state of the oxide membrane by annealing in nitrogen.
Six wafers were coated with a 300 nm thick layer of SiO2, and three were annealed for one hour at 600 °C in nitrogen. The film stress was monitored by comparing the wafer profiles as measured by surface profilometry against baseline profiles taken before the wafers were coated. Results of the film stress evolution over time are summarized in figure 2. The annealed films show a decrease in film stress from ∼75 to ∼50 MPa over the course of 200 h and then remain stable. In contrast, the film stress of the unannealed samples drops to a compressed state approaching −50 MPa. Stabilizing the membranes in a tensile stress state ensures that they remain flat when exposed as windows in the silicon chips. Unannealed membranes have significant wrinkling (figure 2 inset) and suffer sagging under pressure. This can result in as much as 50 μm of deflection in a 2 × 2 mm membrane window (figure S2). Annealed membrane windows show no appreciable deflection under cell culture conditions with all features in the same focal plane. We also measured the relative strengths of the annealed and unannealed membranes by testing the pressure tolerance of chips containing 1 mm2, 100 nm thick windows of each membrane type in non-porous form. Results are summarized in the inset table of figure 2 and show a clear enhancement in strength (36%) for the annealed compared with the unannealed membranes.
We previously reported on a lift-off process to create large sheets of silicon nitride membranes for a variety of applications [25]. The process uses a polymeric scaffold with matched film stress and etching of a sacrificial film underneath the porous membrane (scheme S1). This facilitates membrane lift-off from the silicon wafer substrate. The tensile SiO2 membrane has similar film properties to silicon nitride, and we successfully created sheets of microporous SiO2 membranes with approximately 80% active area and several square centimeters of active area (figures 1(F) and S1).
Cell spreading
The relationship between pore size and porosity with cell adhesion and spreading was studied. The various substrates are SiO2 membranes with the following pore sizes and porosities: 0.5 μm low porosity, 0.5 μm high porosity, 3.0 μm low porosity, 3.0 μm high porosity, non-porous, and TCP (n = 7 for each substrate). Cells were seeded on each substrate and analyzed after 24 h. All cells within the porous region of each 2 × 2 mm membrane were analyzed and comparable region sizes were selected on TCP. More than 50 cells were analyzed for each substrate type.
Cells on TCP have the greatest spread area, but are not significantly different from 0.5 μm low porosity, 0.5 μm high porosity, and 3.0 μm low porosity (figure 3). Spread area on TCP is however significantly different than 3.0 μm high porosity and non-porous SiO2 membranes.
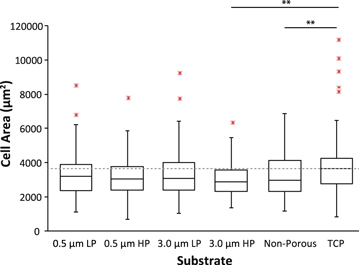
Figure 3. Cell-spread area on low-porosity (LP), high-porosity (HP), non-porous SiO2 membranes and tissue culture treated plastic (TCP) after 24 h. The box plots represent median and IQR of spread area. Whiskers are +/− 1.5 IQR. Dotted line is the median spread-area on TCP. ** p < 0.01.
Download figure:
Standard image High-resolution imageOne explanation for the lower degree of cell spreading on the 3.0 μm high porosity membranes is the propensity of the cells to protrude through the membrane pores (figure S3). It is noted that the cells began this process as early as 4 h after seeding. Protruding is also noticed on the 3.0 μm low porosity membranes but at a lower incidence that does not affect the mean spread area. The protrusions disappear by the time the cells reached confluence. The lower spread area on the non-porous membranes is likely related to reduced traction or adhesion. These observations suggest that the effective roughness of a porous membrane is beneficial to cell spreading up to the point in which cells attempt to transmigrate through the pores.
The data show that with the exception of 3.0 μm high porosity and non-porous membranes explained above, the SiO2 membranes produce comparable cell spread area to that of TCP. This is significant in that it verifies the SiO2 membranes do not adversely affect cell spreading and can be used as a controlled culture substrate that do not change growth properties. This is critical during co-culture experiments when studying the influence of a second cell type.
Cell proliferation
Cell proliferation rates were additionally quantified to understand cellular behavior on the substrates. Cells were cultured in three different media on the 0.5 μm low porosity and non-porous SiO2 membranes, along with TCP, over three days. The 0.5 μm low porosity membrane was selected to represent proliferation of all of the porous membranes. Non-porous SiO2 was additionally used as a control to determine if cell proliferation was affected by substrate composition or porosity.
Cells were seeded at the same density with initial surface coverage of approximately 20%. Cells were manually counted across the entire membrane and normalized to cell counts on day 1 (n = 5 for each substrate).
Cells grown in the complete EC media show no substrate preference as the doubling times are nearly identical. Doubling time is 1.0 days which is comparable to previous reports in the literature (figure 4(A)) [33]. Basal media, which had reduced serum without additional growth factors, was used to study cell proliferation as it is hypothesized that cells on a porous surface will proliferate at a greater rate in a reduced nutrient environment because nutrients will be available on the apical and basolateral surfaces and will be preferential to impermeable substrates. Doubling times slowed to 2.0–2.5 d for all surfaces, and there is no significant difference between the substrates (figure 4(B)). This lack of preference for the permeable substrate may be attributed to the cells adaptation to growing on TCP during expansion. Lastly, proliferation was measured for cells grown in complete EC media supplemented with 50 ng ml−1 VEGF. Doubling time is again comparable to complete EC media and there was no significant difference between the three substrates (figure 4(C)).
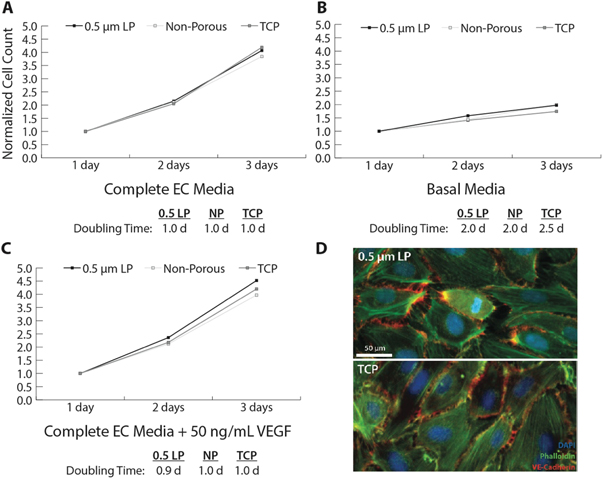
Figure 4. (A)–(C) cell proliferation on low porosity (LP), non-porous SiO2 membranes and tissue culture treated plastic (TCP). Data points are averages; n = 5 for each substrate and media condition. Error bars not shown due to significant overlap; standard error of the mean between 0.02–0.23 for all conditions and time points. (D) Fluorescent images of confluent monolayers after 3 days. Cells were fixed, permeabilized and stained for nuclei (blue), actin cytoskeleton (green), and VE-cadherin (red).
Download figure:
Standard image High-resolution imageThis data further supports that the SiO2 membranes do not affect cell growth characteristics. The cells grown on SiO2 appear to grow similarly to cells cultured on TCP and do not have accelerated proliferation rates even though they are exposed to nutrients on both the apical and basolateral sides. The SiO2 membranes are therefore as robust as commonly used TCP in their support of cells.
Growth to confluence was also investigated on 0.5 μm low porosity and TCP substrates. HUVEC were stained for nuclei, F-actin cytoskeleton, and VE-cadherin. VE-cadherin is a cell–cell adhesion protein necessary to form junctions between endothelial cells and for mature vascular barrier formation. Both substrates have similar morphologies and comparable VE-cadherin between cells (figure 4(D)), suggesting the porous substrates do not affect the development of cell–cell junctions.
Cellular imaging and substrate autofluorescence
An important characteristic of cell culture substrates is the ability to easily image cells both during and after experimentation. Polymeric TE membranes are the current commercial standard for cell culture barrier models. Unfortunately, TE membrane have poor optical properties [18]. We imaged HUVEC cultured on top of SiO2 and TE membranes in phase contrast using a standard inverted cell culture microscope (figure 5). While the cells on the SiO2 membrane were easily imaged in phase contrast, cells could not be discerned on the TE membranes despite being low porosity and rated as 'transparent' by the manufacturer.

Figure 5. (A) and (B) representative phase contrast images of confluent HUVEC monolayers cultured on SiO2 membranes and track-etched (TE) Thincert™ hanging insert membranes. (C) Fluorescent confocal maximal projection image of ADSCs stained for f-actin (green) and cultured on the top surface of an SiO2 membrane with HUVECs cultured on the bottom surface and stained for nuclei (blue) and VE-cadherin (red). (D) Side-view confocal X–Z cross-section showing close proximity of the two cell layers on opposite sides of the 0.3 μm thick SiO2 membrane.
Download figure:
Standard image High-resolution imageIn addition to imaging cells in phase contrast, researchers often use fluorescent stains and immunofluorescence to visualize sub-cellular structures and cell surface markers. Fluorescent confocal imaging shows HUVECs and ADSCs cultured on opposite sides of the SiO2 membrane in close proximity due to the 0.3 μm thickness (figures 5(C) and (D)). Polymeric materials often have significant autofluorescence that can increase the background signal and reduces signal-to-noise and image quality. We investigated autofluorescence values in three standard filter sets, DAPI, FITC, and TRITC for SiO2 and TE membranes (figure 6). The membranes were suspended in a 24-well plate in PBS, similar to a typical co-culture experiment. Mean intensity values were normalized to the TCP base of the plate. SiO2 values are not different from TCP, suggesting the SiO2 does not contribute to the background signal, while the TE membranes are more than 2–5× higher.

Figure 6. Autofluorescence of SiO2 membranes and Thincert® hanging insert membranes in comparison to TCP. Substrates submerged in PBS were imaged using DAPI, FITC, and TRITC fluorescence channels. Error bars represent standard deviation.
Download figure:
Standard image High-resolution imageCellular co-culture
Permeable substrates can allow for co-culture studies that require apical and basolateral interactions without the porous membrane acting as an additional variable. HUVEC and ADSC were grown on opposing sides of 0.5 μm low porosity SiO2 membranes and 0.4 μm low porosity ThinCertTM hanging membranes (figure 7). When grown on 0.5 μm low porosity SiO2 membranes, the cell monolayers are separated by a distance of less than 1 μm, according to the acquired cross-section and in agreement with the SiO2 membrane thickness of 300 nm. When grown on 0.4 μm low porosity ThinCertTM hanging membranes, the cell monolayers are separated by a distance of approximately 10 μm, according to the acquired cross-section, which agrees with manufacturer specifications. All images were collected using identical laser intensities and scanning rates. As expected, fluorescence imaging quality suffers on the apical surface of the track-etched membranes. Median fluorescent values in the track-etched apical image are 36% of the apical SiO2 image, likely due to scattering and attenuation.
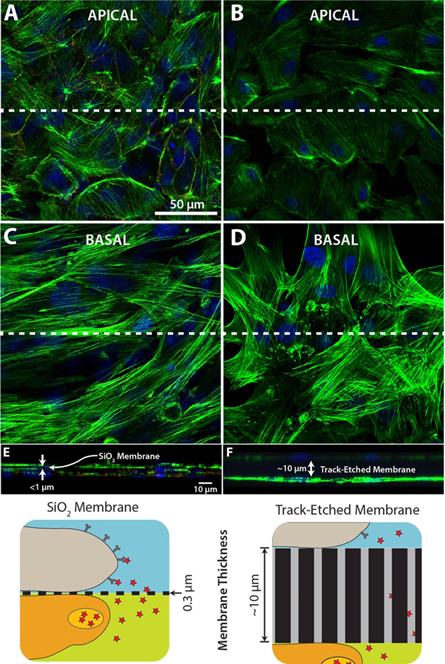
Figure 7. Fluorescence images of HUVEC/ADSC indirect co-cultures. Cells were cultured under static conditions over 3 days. Cells were fixed, permeabilized, and stained for nuclei (blue), actin cytoskeleton (green), and VE-cadherin (red). (A) ADSC grown on the apical side and (C) HUVEC grown on the basal side of a 0.5 μm high porosity SiO2 membrane. (B) ADSC grown on the apical side and (D) HUVEC grown on the basal side of a 0.4 μm high porosity ThincertTM hanging membrane insert. (E) and (F) X–Z cross-sections taken at the dashed white line.
Download figure:
Standard image High-resolution imageIt has been shown that endothelial cells in nascent vessels are stabilized by pericytes and mesenchymal stem cells including ADSCs [16, 34–36]. In addition to formation of gap junctions, recent studies have confirmed extracellular vesicle communication between these cell types during angiogenesis as well as inflammation [37–39]. In order to investigate whether cells co-cultured across the membrane are able to communicate via gap junctions, extracellular vesicles or both, a cytoplasmic fluorescent dye transfer assay was performed (figure 8) [40, 41]. HUVEC were seeded on the bottom surface of the membrane and grown to near confluence. They were then loaded with CFDA, a fluorescent cytoplasmic dye. After washing away free dye, ADSCs were seeded above the membrane. After 2 days, the ADSCs were stained for NG2, a pericyte surface marker [16, 42]. Dual-labeled ADSCs indicate that they received CFDA stained cytoplasm from the HUVECs. HUVECs had either formed gap junctions across the SiO2 membrane with the ADSCs or secreted extracellular vesicles containing the cytoplasmic dye. In either case, CFDA was transferred to the ADSCs, giving a green fluorescent signal to the NG2-labeled cells. The ultrathin nature of the SiO2 membrane brings the two cells types within physiological distances. In fact, the thickness of SiO2 membranes is similar to the basement membrane between endothelial cells and pericytes in blood vessels [20]. This facilitates physical contact between the cell types without unrealistic cell protrusions that would otherwise be necessary with much thicker TE membranes. Attempts to achieve dye transfer between HUVEC and ADSC across commercial track-etched inserts were unsuccessful.

Figure 8. Investigation of cell–cell communication and cytoplasmic dye transfer from CFDA (green) stained HUVEC on the basal surface (A) of a 0.5 μm high porosity SiO2 membrane to ADSC stained with NG2 (red) on the apical surface (B) of the membrane. (C) shows a dual-labeled ADSC. (D) Phase contrast image.
Download figure:
Standard image High-resolution image
Conclusions
Here we have presented an optically transparent ultrathin porous membrane that can be used for in vitro cellular co-culture and barrier models. A straightforward fabrication and annealing procedure results in a robust and tensile porous glass membrane. In the current format, membrane chips can be integrated easily into a variety of lab-on-a-chip and microfluidic devices through gasketing and plasma bonding. In addition, the fabrication process is amenable to lift-off procedures that enable scale up to large sheets with many square centimeters of active area. The membrane thickness (100–300 nm) is comparable to physiological separation distances in tissue layers and enables transfer of cytoplasmic cargo between co-cultured cells. Cells spread and proliferated at rates comparable to control substrates without noticeable differences in phenotype or behavior, which is important when investigating the influence of a co-cultured cell population. Optical transparency of the membrane enabled live and post-fixation fluorescence and phase imaging of cells above and below the membrane at high-resolution. These membranes are likely to facilitate new and improved barrier and co-culture models with unhindered imaging throughout experimentation.
Acknowledgments
A corporate start-up, SiMPore Inc., is commercializing ultrathin silicon-based membranes and participated in this study. TG and JR are founders of SiMPore. JD and JR were employed by SiMPore during this project. Research reported in this publication was supported in part by NIGMS of the National Institutes of Health under award number R35GM119623 to TG and from the Gleason Family Foundation. We thank Joshua Winans for assistance in SEM imaging of the membranes and Zachary Oppito for assistance in measuring deflection of the membranes. The content of this publication is solely the responsibility of the authors and does not necessarily represent the official views of the National Institutes of Health.