


Abstract
Light emitted from Venus's surface can be viewed through spectral "windows" in its atmosphere, in the near-infrared (NIR) around 1000 nanometer (nm) wavelengths. The NIR emissivity of Venus's surface can constrain rock types and their weathering state; emissivities can be measured directly or calculated from reflectances. We measured the reflectances of igneous and sedimentary rocks at Venus's surface temperature, 400 °C–500 °C at 850 and 950 nm; samples were heated in a box furnace in air, illuminated by light-emitting diodes (LEDs), and imaged with a modified charge-coupled device (CCD) camera. Reflectances were also measured at 25 °C from 350 to 1400 nm. Rock reflectances at 850 and 950 nm and 400 °C–500 °C are nearly identical to those at 25 °C, except for the effects of nanophase hematite forming on some surfaces. Fresh basalts have reflectances (high and low temperatures) near 7.5%; a leucogranite similarly has reflectances near 50%. Pigmentary hematite has nearly identical reflectances at high- and low-temperature at these wavelengths. Pigmentary hematite appears dark brown 400 °C–500 °C because its absorption edge has shifted to beyond the limit of human vision. These rock reflectances imply that basalts should have emissivities near 0.9, and granite (and similar felsic rocks) should have lower emissivities ∼0.5. Thus, basalt and felsic rock should be easily distinguished in NIR emissivity measurements of Venus's surface, such as are baselined in recent Venus mission proposals. Other sedimentary rocks should have even lower emissivities: quartz sand at around ∼0.3, and anhydrite as low as 0.1.
Export citation and abstract BibTeX RIS

Original content from this work may be used under the terms of the Creative Commons Attribution 4.0 licence. Any further distribution of this work must maintain attribution to the author(s) and the title of the work, journal citation and DOI.
1. Introduction
Nearly all we know about the surface of Venus comes from radar data, both from Earth and from orbit (Ivanov & Head 2011; Taylor et al. 2018); this is because Venus's thick clouds are opaque to nearly all wavelengths of light, ultraviolet through infrared. However, Venus's atmosphere is relatively transparent in a few narrow spectral "windows" in the near-infrared (NIR), centered at approximately 850, 900, 950, 980, 1020, and 1100 nm wavelengths (Carlson et al. 1991; Crisp et al. 1993; Lecacheux et al. 1993; Meadows & Crisp 1996; Baines et al. 2000; Moroz 2002; Hashimoto & Sugita 2003, Hashimoto et al. 2008; Wilson et al. 2009; Helbert et al. 2017b), and the views through these "windows" can provide additional information on the nature of Venus's surface, specifically the amount and oxidation state of iron on the surface (e.g., Dyar et al. 2020, 2021). These "windows" are of no value for viewing Venus's surface on the dayside, because light from Venus's dayside is dominated by reflected sunlight. In viewing Venus's nightside, its hot surface creates enough emitted NIR radiation to be detected and analyzed quantitatively (Drossart et al. 2007; Hashimoto et al. 2008). The amount of emitted NIR radiation depends on the temperature of the surface, the properties of the surface (i.e., its emissivity in the wavelengths of the atmospheric windows), and the atmosphere's absorption and scattering effects. Atmospheric effects can be subtracted (Hashimoto et al. 2008), and the effect of temperature can be removed, using the known variation of temperature with elevation on Venus (Seiff et al. 1980). The remaining variations in emitted NIR radiation can be interpreted as variations in surface emissivity, and have been shown to correlate with radar-derived surface geology (e.g., Mueller et al. 2008; Smrekar et al. 2010 and Mueller et al. 2020).
Variations in the NIR emissivity of Venus's surface have been interpreted as differences in rock composition and as differences in weathering or alteration. While Venus's lowland plains and central volcanoes are almost certainly of basaltic rock (Ivanov & Head 2011), the composition of rock in the highlands, the tesserae (complex ridged terrain) and Ishtar Terra, is less clear. The tesserae may be underlain by silicic or felsic rock (Basilevsky et al. 1992; Hashimoto et al. 2008; Basilevsky et al. 2012; Gilmore et al. 2015, 2017b; Helbert et al. 2018; Brossier et al. 2020). If so, they could represent early-formed crust (Bonin 2012). Felsic magmas on Earth typically form from a water-bearing source region (e.g., Garvin & Bryan 1987; Whitney 1988; Bonin 2012; Filiberto 2014), so these regions could possibly represent a wetter time in Venus's history (Bonin 2012).
On the other hand, rocks at Venus's surface are exposed to its hot caustic atmosphere (CO2–SO2–CO at ∼470 °C) and are altered by it (Zolotov 2018). Of primary interest is oxidation, the conversion of Fe2+ in silicate minerals to Fe3+-oxide coatings, first recognized from Venera visible-light images of the surface (Pieters et al. 1986). The extent of this oxidation is a function of exposure duration to the atmosphere, and thus has been proposed as a way of determining ages of lava flows (Smrekar et al. 2010; D'Incecco et al. 2017; Cutler et al. 2020; Filiberto et al. 2020). Fresh basalt is rich in Fe2+, both in its minerals and glass, which strongly absorbs light near 1000 nm wavelength. This low reflectance implies high emissivity near 1000 nm, which can be detected from orbit. Basalt oxidized in Venus's near-surface atmosphere, on the other hand, develops optically thick coating of the ferric oxide hematite, Fe2O3 (Pieters et al. 1986), which increases its reflectance and reduces its emissivity near 1000 nm. This effect has been used to constrain the ages of the lava flows at Idunn Mons, which have high emissivities that suggest relatively unweathered basalts (Smrekar et al. 2010). These lava flows may be no more than a few years old based on current estimates of weathering reaction rates on the surface of Venus (Cutler et al. 2020; Filiberto et al. 2020).
Other aspects of surface-atmosphere interaction on Venus may also be detectable (and characterizable) by their NIR emissivities. Mountains around the edges of Ishtar Terra have radar emissivities and reflectances far outside the norm for Venus, and these have been interpreted as surface deposits of iron oxides (Pettengill et al. 1988; Semprich et al. 2020), iron sulfides (Klose et al. 1992; Wood 1997), or frosts of metals or chalcogenides (Brackett et al. 1995; Pettengill et al. 1996; Schaefer & Fegley 2004). Most of these potential weathering products should have characteristic NIR emissivities (e.g., metallic frost could have very low NIR emissivity). Another suggested form of weathering, production of chlorapatite Ca5(PO4)3Cl (Treiman et al. 2014), seems unlikely to be detectable in NIR emissivity because of the low abundance and bland NIR signature of apatite.
To understand and quantify the observed variations in Venus's NIR emissivity, emissivities of rocks and other geological materials can be measured directly at Venus's surface temperatures (Dyar et al. 2017, 2020, 2021; Helbert et al. 2017a) . Emissivities of basaltic rock in the wavelength range of the atmospheric "windows," 850–1200 nm, at ∼470 °C are reported to be ∼0.95 (Dyar et al. 2017, 2019b, 2019a, 2020a, 2020b; Helbert et al. 2017a; Dyar 2019). Emissivities are related to reflectances, which are much more easily measured, by Kirchoff's Law,

which is a restatement of energy conservation for opaque bodies.
The reflectances of basalts in the NIR at ∼25 °C are 5%–15% (Hovis & Callahan 1966; Baird 1984). Emissivities of basaltic rock in the wavelength range of the atmospheric "windows," 0.85–1.2 μm, have recently been reported to be >0.95 at Venus's surface temperatures (Dyar et al. 2017, 2019b, 2019a, 2020, 2021; Helbert et al. 2017a; Dyar 2019) which are (to first order) consistent with the room-temperature NIR reflectance values. The high-temperature emissivities of silicic igneous rocks (dacite, granite, rhyolite) have also recently been reported to be 0.8–0.9 (Dyar et al. 2017, 2021; Helbert et al. 2017a), which is problematic in that reflectances of silicic igneous rocks at 25 °C are typically between 20% and 50% (Hovis & Callahan 1966; Baird 1984). Reflectances so large would imply (by Kirchoff's law) emissivities between 0.5 and 0.8, which are significantly lower than the reported values. However, these emissivity measurements (0.8–0.9) have been updated in Dyar (2019) to values closer to 0.55; this emissivity would imply reflectances near 0.45 which is reasonable for typical for silicic igneous rocks.
Laboratory experiments are our only path (outside of pure theory) for understanding and interpreting NIR emissivity of Venus. However, measuring NIR reflectance is far easier than measuring NIR emissivity because little NIR light is emitted (even from a blackbody) at the temperatures of Venus's surface, and because bright NIR illumination is relatively easy and inexpensive to produce. Measuring NIR emissivity is difficult, as demonstrated by the significant differences between some preliminary measurements (Dyar et al. 2017, 2019b, 2019a; Helbert et al. 2017a) and later recalibrated values (Dyar 2019; Helbert et al. 2019). Therefore, it is vital that reflectance measurements of Venus analog materials at both room temperature and Venus surface temperature be replicated to confirm if Kirchoff's law holds or if reflectances significantly change with an increase in temperature. Here, we focus on this difference between predicted and measured emissivities with two questions. Do rock reflectances change significantly between 25 °C and ∼470 °C, the temperature of Venus's surface? Is Kirchoff's law applicable to the materials and temperatures found at Venus's surface?
2. Samples and Methods
2.1. Samples
We studied unweathered, broken, uncut surface exposures of a sedimentary rock and a range of igneous rocks types that span the full range of compositions possible on Venus. The dunite mantle xenolith and adhering glassy alkali basalt measured in this study are from the Pleistocene-age Sverefjell volcano, Spitsbergen, Norway (Skjelkvåle et al. 1989). The basalt is similar (same site, different hand sample) to that studied by Cutler et al. (2020) and Teffeteller et al. (2020). The crystalline tholeiite basalt (technically, a microgabbro) is from the Mesozoic trap basalts, near Sverrefjell, Spitsbergen, Norway (Senger et al. 2014). The modern alkaline basalt is from recent flows from Pu'u O'o, HI (Gansecki et al. 2019). The anorthosite sample is from the Shawmere complex, near Kapuskasing, Ontario, Canada (Watkinson et al. 1972; Battler & Spray 2009). The garnet-muscovite-biotite granite is from the Mt. Lowe Batholith, San Gabriel Mountains, CA (Barth & Ehlig 1988). The hematite-coated basalt cinder from Mt. Vesuvius, Italy, and the crystalline dacite from Mt. Hood, CA, are from Filiberto's personal collection. The red sandstone is from the Entrada Formation, UT (Costello et al. 2020), and the sample of pure hematite is from the Soudan Mine, Soudan, MN (Vallowe et al. 2010). High-temperature standards were the Zircar® insulation of the furnace floor, and rods of polycrystalline MgO and graphite.
2.2. Methods
Reflectances at room temperature (∼25 °C) of all rock samples were measured, from 350 to 2500 nm with a Spectral Evolution OreXpress Spectrometer. Measurements were made in "contact mode," i.e., with the spectrometer's light source at the rock surface, with phase angles φ and incidence angles near zero, and a roughly 1 inch diameter spot size. Multiple spectra were taken of each sample, but single representative spectra are used here and not averaged spectra. The reflectance standard was a standard white reflectance panel, supplied by Spectral Evolution. Reflectances at room temperature were taken before and after the high-temperature experiments (see https://doi.org/10.6084/m9.figshare.13424768).
Reflectances at high temperature, 400 °C–500 °C, were measured in a box furnace in air (Figure 1). First, standards and 2–3 rock samples (depending on the size of the sample) at a time were heated to 500 °C in a closed furnace. Samples remained at temperature for as little time as possible (up to ∼15 minutes total) to ensure that oxide coatings did not form (e.g., Berger et al. 2019; Cutler et al. 2020; Filiberto et al. 2020). Immediately thereafter, all room lights were extinguished, the furnace was opened quickly, and the furnace interior illuminated by LED flashlights of nominal 850 and 940 nm wavelength centers (see Appendix Figures A1(a),(b)). While imaging, the measured furnace temperatures never went below 400 °C. Images were taken with a modified pocket camera, through 850 nm bandpass filter (50 nm passband) and 900 nm long-pass filters respectively (see Appendix Figures A1(c),(d)). The camera had been modified commercially to restore the sensitivity of its charge-coupled device (CCD) image plane to NIR light. Measurement geometry was not controlled tightly (Figure 1); imaging geometry had phase angles φ of ∼60°, and incidence angles (from the surface normal) of ∼45°. Reflectances were calculated from the digital number (DN) of the images of the rocks. The same area of the rock targeted by the room-temperature measurement was measured at temperature for consistency. For samples with multiple lithologies, each lithology was treated separately in the image processing. The Appendix gives our detailed procedure for conversion from DN to reflectance and standardization of the reflectance values. True-color (RGB) images were taken with the back camera of an Apple iPhone XR.
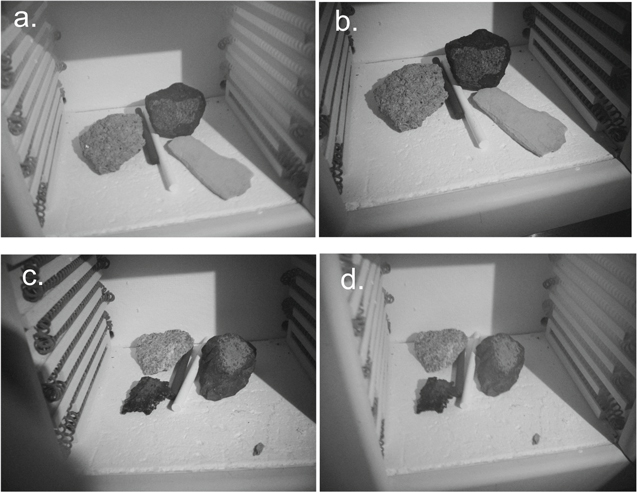
Figure 1. Experimental setup: rock samples and standards in box furnace, at 400 °C–500 °C. Standards are Zircar® insulation on furnace floor, and rods of MgO and graphite. (a) 850 nm image of Mt. Hood dacite (left), Spitsbergen dunite and basalt (right back), and Entrada sandstone (right front). (b) 950 nm image of scene in (a). Note that the dunite appears darker here than in frame (a). (c) 850 nm image of Hawai'i basalt (left front), Shawmere anorthosite (left rear), and Soudan hematite (right). Top surface of hematite is abraded, pigmentary hematite; other surfaces are specular hematite. (d) 950 nm image of scene in (c); image is poorly focused.
Download figure:
Standard image High-resolution imageStandardization was a significant problem, because typical NIR reflectance standards are not usable at high temperature, and there is limited literature on NIR reflectances or emissivities of materials in the temperatures and wavelengths used here. The fibrous insulating material in the furnaces, zirconia or ZrO2, has an emissivity of ∼0.15 at 1000 nm at ∼470 °C, Venus surface temperature (Eldridge et al. 2002; Petrov et al. 2002; Whitson 1975) implying a reflectance 85%; because the zirconia in the furnace was not brand new, we estimate a lower reflectance of 75% due to modifications from continued use. Pure fresh MgO has a measured emissivity of ∼0.1 at Venus surface temperature (Whitson 1975; Manara et al. 2011) implying (by Kirchoff's Law) a reflectance of 90%. In hindsight, however, the available MgO rods were not clean and had reflectances at Venus surface temperature (using the furnace zirconia as a standard) of 55%–75%. In the end, we relied on the furnace zirconia as the high-reflectance standard. Graphite was used as a low-reflectance standard; it was taken to have a reflectance of 7.5% (see the Appendix), consistent with the measured room-temperature NIR emissivity of 0.93 (Maturilli et al. 2016) and a Venus surface temperature NIR emissivity near 0.9 (Neuer 1992).
3. Results
Results of our experiments are shown in Figure 2 and Table 1—reflectances at 400 °C–500 °C, and at 25 °C after high-temperature measurements (see the Appendix and https://figshare.com/articles/dataset/_/13424768 for full data). For most materials, reflectances at 400 °C–500 °C, Venus surface temperature, are similar to those at room temperature; dark materials like basalt remain dark; bright materials like granite and dacite remain bright. This result can be seen qualitatively in Figure 1, where the relative brightnesses of samples and standards are similar to those expected at room temperature. Most of the materials here experienced some oxidation during the experiments (see Appendix for pre-heating spectra), which appears as increased reflectances in the 25 °C spectra at all wavelengths, and especially longer wavelengths (i.e., "reddening" of the spectra), consistent with other recent experimental results (Berger et al. 2019; Cutler et al. 2020; Filiberto et al. 2020). Results from several of the materials deserve additional commentary.

Figure 2. Rock reflectances at 25 °C (lines) and 400 °C–500 °C (symbols); see text for sample descriptions. (a) the basalt is a tholeiite cinder from the Pu'u O'o eruptions (see text). (b) All basalt samples analyzed. Cinder is the oxidized cinder from Mt. Vesuvius; Tholeiite is from Spitsbergen; Hawaii is the cinder from Pu'u O'o eruptions; Alkaline is the glassy basalt rind on a dunite xenolith from Spitsbergen.
Download figure:
Standard image High-resolution imageTable 1. Rock Reflectances at 850 and 940 nm, 25 °C and Venus Surface Temperature
| Wavelength | 850 nm | 940 nm | ||
|---|---|---|---|---|
| Samples/Reflectance % | 25 °C | 400 °C–500 °C | 25 °C | 400 °C–500 °C |
| Dunite, Spitsbergen | 9 | 13 | 8 | 6 |
| Alkali Basalt, Hawaii | 6 | 5 | 6 | 6 |
| Alkali Basalt, Spitsbergen | 6 | 5 | 6 | 5 |
| Tholeiite Basalt, Spitsbergen | 13 | 10 | 12 | 14 |
| Tholeiite Basalt, Veusvius | 22 | 18 | 12 | 25 |
| Dacite, Mt. Hood, CA | 26 | 22 | 23 | 16 |
| Granite, San Gabriel Mts., CA | 41 | 43 | 42 | 52 |
| Anorthosite, Kaupskasing | 32 | 27 | 33 | 23 |
| Sandstone, Utah | 40 | 41 | 43 | 37 |
| Hematite, Minnesota | 24 | 15 | 26 | 21 |
Notes. Samples and methods as described in text. Further explanations and complete data sets are given in the Appendix and https://figshare.com/articles/dataset/_/13424768.
Download table as: ASCIITypeset image
The bulk hematite sample is massive specular (black) hematite, but our room-temperature spectra and high-temperature reflectances are for an abraded surface of the sample (Figure 3(a)). The sample was abraded so we could obtain spectra of fine-grained, pigmentary hematite, which is the inferred and anticipated product of rock weathering on Venus (Pieters et al. 1986; Berger et al. 2019; Cutler et al. 2020; Filiberto et al. 2020). The abraded surface of the hematite is red at room temperatures, meaning that our measured spectra are mostly of pigmentary hematite. Pure pigmentary hematite likely has a greater reflectance than measured here, because some specular hematite was still exposed in the analyzed area. Reflectances measured at high temperature are similar though somewhat lower than those at 25 °C, as can be extrapolated from literature data (Pieters et al. 1986; Yamanoi et al. 2009).

Figure 3. True-color RGB images of hematite (Soudan Mine, MN) at 25 °C (left) and 400 °C–500 °C (right). The sample is pure specular hematite, and the top face has been abraded to a fine-grained powder. The sample has not been moved or touched between the low- and high-temperature images. After cooling, the top face regained its bright red color.
Download figure:
Standard image High-resolution imageThe dunite analyzed here shows significantly lower 400 °C–500 °C reflectance at 950 nm than at 850 nm (Figure 2(a)). At 25 °C, olivine has a strong absorption band centered near 1050 nm (Figure 2(a)), and that band persists to high temperature and shifts to longer wavelengths (Izenberg et al. 2014). Our data appear to show the same trend, that the 850 nm reflectance of olivine at 400 °C–500 °C is greater than that at 25 °C. Although olivine does oxidize in air at high temperature (Berger et al. 2019; Knafelc et al. 2019; Filiberto et al. 2020), our experimental durations were shorter than those of Filiberto et al. (2020), ∼25 hr at 600°C, in which olivine was oxidized and became so coated with hematite that the olivine reflectance spectra were obscured.
The high-temperature reflectances of the anorthosite are lower than the 25 °C spectra, even though the spectral shapes are similar. The cause here is not known, although it may relate to phase angle of the observations. The surface of the anorthosite sample is composed of reflective cleavage faces of its feldspar grains, so that reflectance measurements at 25 °C (at phase angle of ∼0°) included some of that specular reflectance. Reflectances at high temperature were at much lower phase angles, and much of the incident NIR light was likely reflected off these cleavage faces away from the camera.
The basalt samples, Figure 2(b), show a broad range of reflectances: from 1% to 25% at 950 nm. This range represents both the wide variation in composition, crystallinity, and thickness of hematite coatings. The alkaline basalt from Spitsbergen remained visually black after our experiments, and the cinder from Mt. Vesuvius was already reddish, with a thin alteration rind.
4. Implications
Our results (Figure 2) are informative, if preliminary. In considering our results, one must recognize that temperatures were approximate, the IR detector was not ideal, standardization was indirect and approximate, geometry was variable, and light sources were not ideal. Even with these caveats, our results have significant implications for the use of NIR emissivities in Venus science.
4.1. Venus's NIR Reflectances
With the caveats described above, reflectance values for most rocks at 400 °C–500 °C are close to those at 25 °C (Figure 2) with the differences between measured reflectances values being ascribed to: viewing geometry (φ = 0° at 25 °C; ∼60° at high temperatures); differences in mineral proportions analyzed in coarse-grained rocks; chemical reactions during analysis; and uncertainties in the high-temperature values. The measured reflectance for dunite, olivine-dominated, is comparable to that of pure Fe-bearing olivine at high temperature (Izenberg et al. 2014), providing confidence in the accuracy of our results.
Our results show that reflectance values for rocks at 25 °C are reasonable predictors of reflectance values for 470 °C (Figure 2). Broadly speaking, rocks with high reflectance at room temperature will have high reflectance at Venus surface temperatures, and vice versa. In detail, of course, there will be differences because the positions and depths of NIR absorption bands shift somewhat with temperature (Sung et al. 1977; Parkin & Burns 1980; Ullrich et al. 2002; Rüscher et al. 2011; Izenberg et al. 2014). This shift is apparent in our data for the Spitzbergen dunite, for which the reflectance edge and minimum are at longer wavelengths at high temperature (Figure 2(a)).
4.2. Hematite on Venus's Surface
The spectral reflectance of hematite, Fe2O3, is significantly different at 400 °C–500 °C than at 25 °C, because hematite's strong red absorption edge weakens and shifts to longer wavelength with temperature (Pieters et al. 1986; Yamanoi et al. 2009). The weakening is apparent in our high-temperature data, in that hematite's reflectance at 400 °C–500 °C is lower than at 25 °C (Figure 2(a)). The shift in the wavelength of the edge is not apparent in our NIR reflectance data (Figure 2(a)), implying that the edge at 400 °C–500 °C is at shorter wavelength than 850 nm. The shift of the absorption edge is clear and evident in visible-light images (Figure 3). At room temperature, the powdered hematite is bright red (i.e., rouge-red), in agreement with spectral measurements that show its absorption edge at ∼600 nm (Morris et al. 1985; Yamanoi et al. 2009). At high temperature, the powdered hematite appears dark brownish-gray (Figure 3(b)), implying that the absorption edge has shifted outside visible wavelengths, i.e., to longer than ∼700 nm (Yamanoi et al. 2009).
A puzzling aspect of the reflectance of hematite is the difference between the powdered Soudan sample and the cinder from Mt. Vesuvius. For both samples at both temperatures, reflectances at 950 are significantly greater than at 850 (Figures 2(a), (b)), However at longer wavelengths, such as would be accessed in a study of Venus's NIR emissivity, reflectances at 25 °C of the Vesuvius sample increase continuously, while reflectances of Soudan sample remain constant (Figures 2(a), (b)). This difference could relate to grainsize (Morris et al. 1985; Pailhé et al. 2008)—with the Vesuvius cinder and (other samples) being coated with nanophase hematite.
4.3. Oxidation Rates
Recent work has shown that oxidation at these temperatures should happen rather fast and have two effects on the mineralogy and spectroscopy of the samples: pyroxenes develop Fe3+ within the crystal structure, while olivine and glass for hematite coatings (Berger et al. 2019; Cutler et al. 2020; Filiberto et al. 2020). In fact, during our experiments some basalts became reddish in color (presumably from the formation of hematite coatings) during heating, which accounts for some increases in reflectance. Different basalts weather at different rates because of differences in crystallinity and mineralogy. Berger et al. (2019) and Cutler et al. (2020) showed that hematite forms preferentially on olivine and glass within basalts. Olivine oxidizes and forms hematite within days to months, depending on temperature (Filiberto et al. 2020). Basaltic glass oxidizes in a similar time frame (Berger et al. 2019; Cutler et al. 2020; Teffeteller et al. 2020). On the other hand, Mg-rich pyroxenes are barely affected by oxidation (at least on day to month timescales), with Fe-rich pyroxenes more affected than Mg-rich (Cutler et al. 2020). Therefore, rates of oxidation and formation of hematite will be affected by both timescale, as well as crystallinity and olivine content. If a basalt is dominated by pyroxene and plagioclase with little to no glass (diabase or gabbro) or contains no olivine (tholeiite) then its rate of oxidation would be an order of magnitude slower than for a basalt containing either (Berger et al. 2019; Cutler et al. 2020).
4.4. Kirchoff's Law and Emissivities of Venus's Surface
It would be advantageous if NIR emissivity values could be calculated from NIR reflectance measurements via Kirchoff's Law (Equation (1)); our data permit a modest test of Kirchoff's law for NIR light at Venus surface temperatures. Figure 4 shows emissivities calculated from our data with Kirchoff's law compared with the most recent measurements of rock emissivities at temperature (Dyar 2019). Although none of the rocks we analyzed were also analyzed in that study, it is clear that all basalt samples have emissivities near 0.9, and that silicic igneous rocks (granite, dacite, anorthosite, andesite) have emissivities in the range 0.5–0.8. Thus, we validate (to first order) Kirchoff's law for emissivities and reflectances of rocks at 400 °C–500 °C.

Figure 4. Emissivities of materials at Venus surface temperatures. Symbols are calculated here from measured reflectances (see Figure 2). Lines and fields are emissivities and emissivity ranges measured at 400 °C–500 °C, redrafted from Dyar (2019). Calculated and measured emissivities generally correspond (e.g., granites have much lower emissivities than basalts), but there are wide variations among similar rock types.
Download figure:
Standard image High-resolution imageFurther, the difference in emissivity between basaltic and most silicic igneous rocks (Figure 4) is great enough that it should be relatively easy to distinguish them from orbit, depending on the detector system (Mueller et al. 2008; Smrekar et al. 2010; Helbert et al. 2018). This is vital for spectroscopic measurements of Venus to constrain if they represent an early granitic crust or a heavily metamorphosed basalt (Hashimoto et al. 2008; Gilmore et al. 2015, 2017a; Byrne et al. 2021). As noted in the Introduction, the presence of abundance silicic rocks on Venus would have enormous planetological and astrobiological significance. However, some silicic rocks do have low reflectances and thus high emissivities, and may be indistinguishable from basaltic rocks by their NIR emissivities. One such example is obsidian, volcanic glass of granitic composition. Nearly all obsidians are black because they consist of colorless glass with many small dispersed crystals of magnetite. Another example is the building stone "larvikite," commonly called black granite, which is also dark because of small dispersed crystals of iron oxides.
Silicic igneous rocks are not the only substances on Venus that might have low emissivity values. The mountains around Ishtar Terra, with high radar reflectance (low emissivity) might have distinctive NIR emissivity (e.g., if pyrite were present). Quartz sand at 25 °C has a reflectance (near 1000 nm) of ∼0.65 (Hovis 1966; Hovis & Callahan 1966), which would then extrapolate to a NIR emissivity at 400 °C–500 °C of ∼0.35, which is comparable to a measured value, see Figure 4 (Dyar 2019). Similarly, anhydrite (CaSO4) is a predicted (and experimentally validated) product of rock weathering on Venus, and could have an emissivity as low as 0.1 (Bishop et al. 2014). Similar low emissivities are possible for other unlikely materials, like Fe-free carbonate minerals, alumina, etc. (Zolotov 2018). Interestingly, most natural low-emissivity materials require extensive chemical fractionation to produce low iron-materials, e.g., to form anorthosite or granite (Campbell & Taylor 1983; Bonin 2012; Filiberto 2014). Thus, a search for low-emissivity materials on Venus could have important consequences for understanding its planetary history and astrobiologic potential.
This work was supported by NASA Solar Systems Working grant 80NSSC17K0766 to Treiman and Filiberto. We are grateful to the ARES group at Johnson Space Center, which maintains the experimental petrology laboratory in which the high-temperature images were taken. We are grateful to the AMASE astrobiology expeditions to Spitsbergen, on which Treiman collected samples of tholeiite, alkali basalt, and dunite from the Sverrefjell volcano and surrounding area in Bockfjord. We are grateful to the LPI and W. Kiefer for organizing the Differentiation Workshop, which allowed collection of the granite sample. The Lunar and Planetary Institute is operated by USRA under a cooperative agreement with the Science Mission Directorate of the National Aeronautics and Space Administration. This is LPI contribution No. 2591.
Data Archive
All images and reflectance data used here are archived at https://figshare.com/articles/dataset/_/13424768.
Appendix A: Image Acquisition and Reflectance Calibration
High-temperature NIR reflectances of rocks and standards were calculated from the DNs on images taken with a modified pocket digital camera. This procedure is not standard in planetary sciences, and so is described in detail. In short, DN on images were calibrated at room temperature using reflectance standards, printed and solid materials.
A.1. Image Acquisition
Images of samples and standards were acquired with a Sony Cybershot DSC-S700 pocket digital camera, from which the manufacturer's filter to block infrared light had been removed. Figure A1(a) shows the typical spectral sensitivity of such a camera's charge-coupled device (CCD) image plane. Images at 850 nm wavelength were taken with illumination from a commercial IR flashlight from Vastfire (Figure A1(b); intended originally for night-time hunting) and a filter with a 50 nm bandpass centered at 850 nm (Edmund Scientific 84790; Figure A1(c)). Images at 950 nm wavelength were taken with illumination from a commercial IR flashlight from Vastfire (Figure A1(b); intended originally for night-time hunting) and a filter, that passes light with wavelengths longer than 900 nm (Zomei Co., Figure A1(d)). The combination of illumination spectrum, long-pass filter properties, and the CCD's natural sensitivity cutoff at ∼1000 nm (Figure A1(a)) yield an effective bandpass of ∼50 nm bandpass centered at ∼950 nm.

Figure A1. Spectral responses of components. (a) Relative spectral sensitivity of the CCD array used in the Sony DSC-S700 camera (ICS814AQQ). Redrafted from Sony's online product specification document. (b) Emission spectra of typical light-emitting diodes, 850 nm and 940 nm, as used here. (c) Spectral transmission of 850 nm bandpass filter used, redrafted from Edmunds Scientific data sheet product #84802. (d) Spectral transmission of ∼950 nm Zomei long-pass filter, redrafted from Whitson (1975).
Download figure:
Standard image High-resolution imageA.2. Camera Calibration
Retrieval of reflectances from image brightnesses can be difficult, because of image corrections made by camera on-board firmware (Garcia et al. 2013). Images in "raw" format may contain DN values for each pixel that correspond to reflectances, because the raw response of a CCD is proportional to the intensity of light it receives. However, most digital cameras (including the S700) provide images that are adjusted in several ways. First, digital cameras (especially simple inexpensive ones as used here) automatically adjust f-stop and time to produce images that are neither overexposed nor underexposed. This correction is undone by including standards of known reflectance along with the unknowns. Second, CCDs are typically partitioned by a Bayer filter mask into pixels that respond to red, green, and blue light. The full image in a given color is interpolated between and among pixels that actually recorded that color. This correction cannot be undone. Third, the brightnesses in three image colors are adjusted to bring their intensities from those of the CCD image plane (Figure 1(a)) to near those of the human eye. This correction is avoided here by only using the "red" image channel for calculations. Fourth, the DN values of an image are scaled from the linear response of the CCD to the near-logarithmic response of the human eye (Stevens & Galanter 1957). This correction can be undone by imaging standards of multiple reflectances.
To undo the fourth correction built into the DSC-700 camera, we acquired images of a Tiffen/Kodak Q13 grayscale card at 25 °C, illuminated by the 850 nm and then the 950 nm flashlight. The Q13 card maintains its grayscale under near-infrared illumination (Tetley & Young 2007). As above, we used only the red channel of the RGB images, employing the freeware program ImageJ (Schneider et al. 2012) to separate the channels. In each image, and in each density block on the Q13 card, we selected a rectangular area and used the ImageJ histogram function to generate an average DN for that density. Some selectivity was required, as illumination from the flashlights was not entirely uniform. Figures 2(a) & (b) show those average DN values versus the reflectance for the area calculated from its density.
To retrieve reflectances from the digital camera DN values, we need to recover and undo the gamma correction applied in the camera. Commercial digital cameras generally apply a complicated correction to convert raw camera data to images that appear proper to the human eye. From the measured DN from the Q13 gray card, we found (by trial and error) that image DN values >30 at 850 and 950 nm could be modeled by this formula (Figures A2(a), (b))

where "3" is the gamma value, and "60" is a zero-reflectance offset. For image DN values < 30 reflectances at 850 and 950 nm could be modeled by this formula (Figures A2(c), (d))

where "1.4" is the gamma value, and "−5" is a zero-reflectance offset. These conversions do not hold for the Q13 card blocks of highest reflectance (lowest density); it seems likely that these spots were saturated, and so are expected to fall below the linearization. The exact slope of the lines on Figure 2 are unimportant, as we include reflectance standards for all unknowns—the critical fact is that we have established predictive relationships between image DN and spectral reflectance.
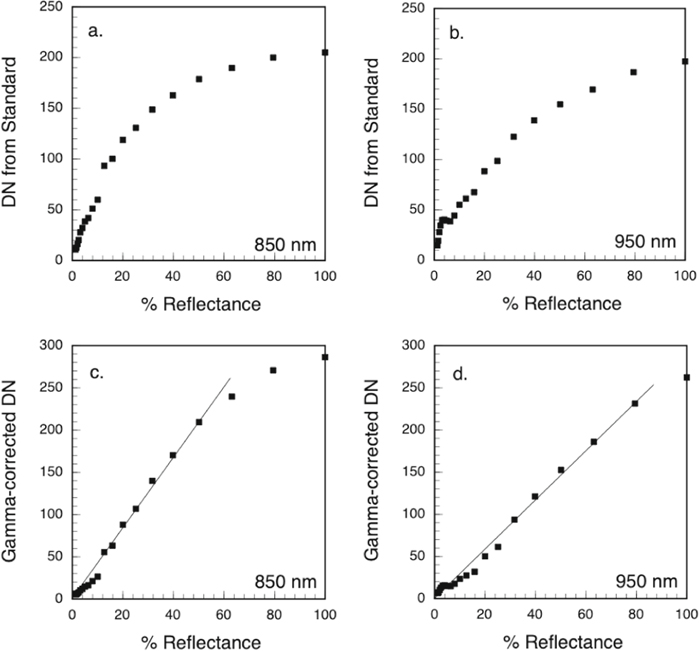
Figure A2. Standard, gray card reflectances and image digital numbers (DN). Parts a and b show the red-channel image DN for the blocks on the Q13 grayscale standard vs. the percentage reflectance calculated from the density values of the standard. Parts c and d show that most of the range of reflectance is linearized by the gamma-offset correction of Equation 1. In calculating true reflectances, the slopes are normalized by use of Zircar® and graphite standards.
Download figure:
Standard image High-resolution imageFinally, to undo the automatic image exposure, we included standard rods of MgO and graphite, and used the Zircar© insulation (cubic zirconia) on the furnace bottom as a standard. None of these was entirely adequate. Pure fresh Zircar emissivity of ∼0.15 at 1000 nm in the temperature range 400 °C–500 °C (Eldridge et al. 2002; Petrov et al. 2002; Whitson 1975), for a reflectance 85%; as the zirconia in the furnace was not clean, we estimate a lower reflectance of 75%. The MgO standard rod was not clean, and apparently was differentially dirty depending on which side was imaged; with the Zircar as a standard, the MgO rods in different images had r values from 75% to 55%. The image brightness of the graphite rod also varied from image to image, with radiance value ratios (Equations A1 and A2 and ) graphite/Zircar ranging from 0.10 to 0.34. This is obviously impossible, and we infer that the graphite values are unreliable, and that the darkest graphite of the standard sets (that with the lowest graphite/Zircar radiance ratio is closest to reality). Thus, we scaled the graphite radiance in each image with the lowest graphite/Zircar radiance ratio, assuming in effect that the real reflectance of the graphite was 10%.
Appendix B: Before and After Spectra
Reflectance spectra of rock investigated here changed somewhat in the experiments, because their original minerals that contained ferrous iron (Fe2+) oxidized in the furnace air to yield ferric oxides (i.e., hematite, Fe2O3) and possibly ferric iron in other minerals. The "before and after" spectra are shown in Figure A3. In general, formation of hematite on a rock surface produces a reflectance spectrum intermediate between that of the rock and of pure hematite; the hematite, if more than a few microns thick, effectively prevents incident photons from penetrating to the underlying rock; for a more extensive discussion, see Filiberto et al. (2020) and Cutler et al. (2020). The before and after spectra were not necessarily of exactly the same spot on each sample, so some of the variation may only represent spatial heterogeneity of the samples.

Figure A3. Rock spectra at 25 °C, before and after heating to 400 °C–500 °C and measurement of reflectances at that temperature. Samples and color coding are as in Figure 2(a) of the main text. Solid line spectra were taken before heating, and dashed line spectra afterward.
Download figure:
Standard image High-resolution image