


Abstract
The interest in understanding the interaction between graphene and atoms that are adsorbed on its surface (adatoms) spans a wide range of research fields and applications, for example, to controllably change the properties of graphene in electronic devices or to detect those changes in graphene-based sensors. We present a density functional theory study of the interaction between graphene and Hg adatoms. Binding energy, electronic structure and electric field gradient (EFG) were calculated for various high-symmetry atomic configurations, from isolated adatoms to a continuous Hg monolayer. Hg as isolated adatom was found to be the most stable configuration, with a binding energy of 188 meV. Whereas isolated adatoms have a minor effect on the electronic structure of graphene (small acceptor effect), Hg monolayer configurations induce a metallic state, with the Fermi level moving well above the Dirac point (donor behavior). Based on the EFG calculated for the various configurations, we discuss how hyperfine techniques (perturbed angular correlation spectroscopy, in particular) can be used to experimentally study Hg adsorption on graphene.
Export citation and abstract BibTeX RIS

Original content from this work may be used under the terms of the Creative Commons Attribution 4.0 license. Any further distribution of this work must maintain attribution to the author(s) and the title of the work, journal citation and DOI.
1. Introduction
Since it was isolated as a two-dimensional material [1], graphene has become a remarkable subject of research across various fields [1–11]. In particular, thanks to the ability to controllably change its physical and chemical properties, for example, in field-effect transistors [1, 12], transparent electrodes [13, 14], energy-storage materials [15, 16], and chemical and biosensors [17, 18], graphene shows tremendous potential to revolutionize various technologies. A key area of research, which is common across many of these fields and applications, is the interaction between graphene and atoms that are adsorbed on its surface (adatoms), either as a means to actively change its properties (e.g. adatom doping to tune the Fermi level in a transistor-type device) or simply to detect those changes when an adatom is adsorbed (e.g. in sensing applications). In this context, substantial research has been carried out to understand how adatoms of different elements bind to graphene, which stable atomic configurations they form, how they migrate and agglomerate, and how they affect the electronic properties of graphene in the various possible configurations (e.g. different sites and local concentrations, isolated versus clustered, etc). The majority of these studies have relied on density functional theory (DFT) calculations for various adatom elements, dealing with the adsorption stability and effect on the properties of graphene (structural, electric, magnetic, etc). Among the earlier DFT work, S. Casolo et al[ 19] studied hydrogen adsorption on graphene, as isolated atoms or as hydrogen cluster, revealing a relationship between the stability of the adatom and the induced electronic properties. Mao et al[ 20] predicted the emergence of high magnetic moments when transition metal (TM) atoms (Fe, Co, and Mn) are adsorbed on graphene. Sevinçli et al[ 21] studied the binding energies and the electronic and magnetic properties of graphene adsorbed with TM atoms (Co, Cr, Fe, Mn, and Ti), revealing a wide range of binding energies, from 0.10 to 1.95 eV, depending on the species and coverage density. In the same work, Sevinçli et al also predicted the occurrence of ferromagnetic and antiferromagnetic ordering when 3d TM are adsorbed on graphene. Adsorption of heavy metals (HMs) and its influence on the properties of graphene have also been investigated, not only in terms of the basic physics of adsorption, stability, electric and magnetic properties, but also considering its potential application, for example, in spintronics (e.g. Os, Ir [22], and Pb [23] inducing a topological insulator state thanks to the high-spin orbit (SO) coupling in heavy elements), catalysis (e.g. Au [24] and Pd [25]), detection of toxic HMs (e.g. Cf, Hg and Pb [26]), and their removal from water (e.g. Pb [27]). Since adatoms tend to have low migration energies on the surface of graphene, they typically diffuse well below room temperature [28]. Adatom elements for which a cluster configuration is energetically favorable will therefore agglomerate (e.g. Au [24]). Since the properties of the graphene+adatoms system are strongly dependent on the adsorption configuration (e.g. isolated adatoms versus clusters), it is important to not only understand these effects (configuration-dependent properties and migration) from a theoretical point of view, but also to be able to probe them experimentally.
Here we present a DFT study of Hg adatoms on graphene, which is a model system for one of the potential applications of graphene-based materials: the removal of HMs from water. We investigate the stability of various adsorption configurations as well as their effect on the electronic structure of graphene. Moreover, based on the calculation of the hyperfine parameters associated with the different configurations, we discuss how hyperfine techniques can be used to experimentally study Hg adsorption on graphene, in particular, to distinguish isolated from cluster configurations. Considering this approach, Hg is a particularly valid choice since it possesses several isotopes compatible with hyperfine techniques, namely with perturbed angular correlations (PAC) spectroscopy. These calculations not only provide new insights on graphene-adatom interactions, they also form the basis for a new experimental approach which is currently being developed at the ISOLDE facility at CERN using ASPIC (Apparatus for Surface Physics and Interfaces at CERN) [29].
2. Computational method
The DFT calculations were performed using WIEN2k code [30–32], which implements the linearized augmented plane waves (LAPW) method. This method divides the space into non-overlapping spheres, and a LAPW basis function consists of spherical harmonics inside the spheres and plane waves in the interstitial region between the spheres. It is an all-electron code (i.e. it employs the full charge distribution of all electrons) and is for this reason more suitable to calculate hyperfine parameters. The muffin-tin radii were set to 1.29 and 1.70 atomic units, for the carbon atoms and for mercury adatoms, respectively. The number of basis functions is set by the parameter  , where RMT = 1.29 au (the radius of the smallest sphere). Different concentrations of adatoms were studied by constructing differently sized supercells, each including one Hg adatom and multiple graphene C-hexagons. Figure 1 shows projections along thec-axis of the 1 × 1, 2 × 2, 3 × 3 and 4 × 4 (C-hexagon) configurations (with the corresponding number of k-points considered being 18 × 18 × 1, 10 × 10 × 1, 8 × 8 × 1, and 6 × 6 × 1, respectively). These configurations correspond to nominal Hg concentrations (θ) of 1/2, 1/8, 1/18, and 1/32, with respect to the number of carbon atoms. For each concentration, three sets of calculations were performed, for Hg atoms on each of the three high-symmetry positions: hollow (H), top (T) and bridge (B) (figure 1). An additional configuration was also considered in the calculations: an hexagonal Hg monolayer with the Hg atoms in a sequence of H-T-T sites (therefore designated here as HTT configuration), with a concentration of θ = 3/8 with respect to C atoms, which is equivalent to a (111) plane of a cubic Hg lattice. A vacuum spacing of at least
  (
( ) is placed between adjacent graphene layers to minimize layer–layer interactions. The calculations did not consider spin polarization. Three different exchange correlation functionals were used: local density approximation (LDA) [33], generalized gradient approximation (GGA-PBE) [34] and GGA-PBE with van der Waals correction (DFT-D3) [35]. The vdW corrections of DFT-D3 method are restricted to shorter correlation length scales. We have used the experimental lattice parameter
  , which is close to our optimized parameters with LDA (
 ) and GGA (
 ) for undoped graphene. The results presented in the following correspond to calculations performed without including SO coupling. Calculations for representative cases, namely for the lowest-energy configurations with θ of 1/18 and 1/8 (isolated adatoms), and 3/8 and 1/2 (monolayers), including SO coupling, revealed no significant differences (
 2% in both the EFG and adsorption energies).

Figure 1. Top: 1 × 1, 2 × 2, 3 × 3 and 4 × 4 configurations for a Hg atom in the hollow site (H) on graphene lattice, corresponding to nominal Hg concentrations (θ) of 1/2, 1/8, 1/18, and 1/32, with respect to the number of carbon atoms. The calculations were performed for all three high-symmetry positions for adatoms on graphene (depicted in the bottom right figure), as a function of graphene-Hg distance d: the hollow (H) site above the center of the hexagon, the top (T) site directly above the C atoms, and the bridge (B) site above the middle of the C–C bond. Bottom left: configuration consisting of a Hg monolayer here referred to as HTT configuration since Hg atoms are placed in a sequence of one H and two T sites (θ = 3/8).
Download figure:
Standard image High-resolution imageFor each configuration and nominal concentration, we studied the stability of the adatoms with respect to displacements in-plane (between the high-symmetry sites) and out-of-plane (varying distance d to the graphene layer) directions, as well as the associated electronic structure. In-plane displacements provide insight into adatom migration and diffusion mechanisms, whereas out-of-plane displacement is related to the adsorption stability. Additionally, the electric field gradient (EFG) tensor calculated for every configuration can be compared to experimentally determined values, as a sensitive local probe for the structural configuration of Hg adatoms on graphene.
3. Results
3.1. Choice of functionals
Figure 2 shows the adsorption energy of graphene-Hg system as a function of graphene-adatom distance, d, for the configuration 2 × 2 (θ = 1/8) when Hg is at the H site (as an example; B and T sites show equivalent behavior), obtained using each of the three used functionals (LDA, PBE and PBE+DFT-D3). Since adatoms on surfaces are subject to dispersion forces, commonly referred to as van der Waals interactions, which are not accounted for with PBE nor LDA, we included the DFT-D3 correction to the PBE functional. As it can be seen in the figure 2, the DFT-D3 correction results in a strengthening of the binding: lower energy minimum and corresponding distance d. LDA calculations also show a much stronger binding of the Hg atom to the graphene layer compared to PBE (and smaller equilibrium distance). This is however expected, since LDA does not provide an adequate description for weakly bound adatoms, and is known to overestimate binding energies. In this case, the LDA-overbinding coincidentally mimics the dispersion contribution to the binding that was missing from PBE [36].
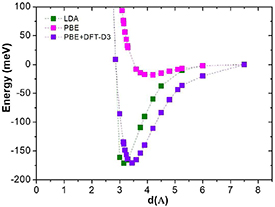
Figure 2. Energy landscape of graphene-Hg system as a function of graphene-adatom distance, d, using LDA, PBE and PBE+DFT-D3 functionals. Supercell 2 × 2 (θ = 1/8) and Hg at the H site.
Download figure:
Standard image High-resolution imageIt is important to note that while the choice of functionals determines the energy balance of the system, it leaves the EFG generally unaffected. The EFG is a traceless symmetric rank 2 tensor so that the axis system can be defined in a way that the EFG tensor representation has only three non-vanishing diagonal components defined as  ≥
≥  ≥
≥  . It is common to characterize the EFG tensor by its main component Vzz
and the axial asymmetry parameter, η, defined as
. It is common to characterize the EFG tensor by its main component Vzz
and the axial asymmetry parameter, η, defined as  , taking into account that the three remaining degrees off freedom are characterized by the Euler angles that relate the principal axis system (where the EFG is diagonal) to the laboratory axis system. The EFG tensor is extremely sensitive to the charge distribution (and its symmetry, in particular) in the region of the nucleus, which does not appear to vary significantly when using the different functionals considered here. This is illustrated in figure 3, where the EFG parameters, Vzz
and η, for Hg in the H site, are plotted as a function of the distance d: LDA and PBE calculations yield virtually identical EFG values at a given distance d( figure 3), whereas the binding energy at that distance can vary considerably (figure 2). For a distance
, taking into account that the three remaining degrees off freedom are characterized by the Euler angles that relate the principal axis system (where the EFG is diagonal) to the laboratory axis system. The EFG tensor is extremely sensitive to the charge distribution (and its symmetry, in particular) in the region of the nucleus, which does not appear to vary significantly when using the different functionals considered here. This is illustrated in figure 3, where the EFG parameters, Vzz
and η, for Hg in the H site, are plotted as a function of the distance d: LDA and PBE calculations yield virtually identical EFG values at a given distance d( figure 3), whereas the binding energy at that distance can vary considerably (figure 2). For a distance  , i.e. at the equilibrium position determined by the minimum of the energy with PBE+DFT-D3 functional, the EFG values at the Hg site are
  and η = 0 (the axial asymmetry parameter η is always zero for Hg at H site).

Figure 3. EFG components (Vzz and the axial asymmetry parameter, η) of Hg as a function of graphene-Hg distance, d, using LDA and PBE functionals. Supercell 2 × 2 (θ = 1/8) and Hg at the hollow symmetric site. DFT-D3 is not shown since it is only a correction to the energies and forces, i.e. does not affect the EFG.
Download figure:
Standard image High-resolution image3.2. Stability versus adatom position and concentration
In the following we focus on the results obtained using the PBE+DFT-D3 functional. To understand the stability of Hg adatoms on graphene, for different nominal concentrations, the adsorption energy was studied as a function of the distance d, for each one of the three high symmetry sites. Figure 4 shows the calculated adsorption energy as a function of d, for different θ, when Hg is at the H site (except for θ = 3/8, for which the Hg atoms are in mix of H and T sites). The adsorption energy is calculated as:  , where
  is the energy of the system graphene + adatom, and EG
and
is the energy of the system graphene + adatom, and EG
and  are the energy of graphene and the energy of the free adatom, respectively. The term
  was calculated using a supercell containing both the graphene layer and the adatom separated by a distance of at least 7.5 Å (
 ) to minimize layer-adatom interaction, as it is possible to see from figures 2 and 4. Although with a qualitatively similar shape, the adsorption energy curves for the different Hg concentrations (θ) have different minima (i.e. different binding energies) at different distance values. For θ = 1/18 and θ = 1/32, however, the curves virtually coincide, indicating that a supercell 3 × 3 (θ = 1/18) is already large enough to adequately describe non-interfering, isolated Hg adatoms (i.e. further increasing the dilution would have a negligible effect).

Figure 4. Adsorption energy of graphene-Hg system as a function of graphene-Hg distance, d, for different nominal concentrations (θ). Except for the HTT case (θ = 3/8), which is a mix of H and T sites, data are shown for Hg located at the H site. Adsorption energies are normalized to a cell that contains 1 Hg atom per supercell.
Download figure:
Standard image High-resolution imageFigure 5 compiles the binding energy (defined as the absolute value of the minimum of the adsorption energy) and the corresponding equilibrium distance (deq ) obtained for Hg at H, T and B sites, for each of the θ values considered here. For each nominal concentration, both binding energy and corresponding distance depend on the position (H, T or B) occupied by the Hg adatom. The main conclusion to be extracted from these calculations is that the most stable configuration for Hg on graphene is as isolated adatoms (e.g. 188 meV for θ = 1/32) which is, in particular, more stable than the HTT monolayer (123 meV and θ = 3/8).
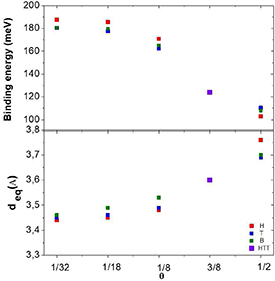
Figure 5. a) (top) Binding energy of Hg defined as the absolute value of the minimum of the adsorption energy and (b) (bottom) corresponding distance, deq , for different nominal concentration (θ), for each site H, T and B, as well as for the HTT configuration.
Download figure:
Standard image High-resolution image3.3. Diffusion and agglomeration
Above, we considered the relative stability of the Hg adatoms in various high-symmetry configurations. In this section we examine the energy barriers governing the migration of Hg adatoms in the dilute regime (i.e. the migration paths between H, B and T sites). In a practical scenario, adatoms are randomly deposited on a graphene surface, evolving from dilute to more concentrated configurations. Therefore, these migration barriers can also be regarded as governing the agglomeration of dilute Hg adatoms into other configurations (e.g. HTT configuration). Figure 6 shows how the adsorption energy varies along straight H T and H
 B paths (with d optimized at each intermediate position). From these calculations, we derive H
 T and H
 B migration barriers of ∼8.0 and ∼5.6 meV, respectively, i.e. the overall migration barrier for isolated Hg adatoms on graphene is therefore ∼5.6 meV. These can be considered low migration barriers, when compared to other metal adatoms such as Au (7 meV), Ag (10 meV), Cr (22 meV), Pd (80 meV) and Al (166 meV) [28, 37]. From these migration barriers, one can estimate a characteristic temperature above which the adatoms become mobile (i.e. start to diffuse and eventually agglomerate). Within an Arrhenius model, the rate Λ of thermally activated jumps between H sites is given by
  , where ν0 is the attempt frequency (which we take as
  , of the order of the lattice vibrations), and kB
and T the Boltzmann constant and the temperature. The average period between jumps is therefore given by Λ−1, from which we can estimate the threshold temperatures for surface diffusion of Hg adatoms, for a given length and time scales. For example, the temperature corresponding to one jump between adjacent H sites is given by
, of the order of the lattice vibrations), and kB
and T the Boltzmann constant and the temperature. The average period between jumps is therefore given by Λ−1, from which we can estimate the threshold temperatures for surface diffusion of Hg adatoms, for a given length and time scales. For example, the temperature corresponding to one jump between adjacent H sites is given by  , where t is the time interval in question. For 1 min (t = 60 s) and Ea
= 5.6 meV (corresponding to H
, where t is the time interval in question. For 1 min (t = 60 s) and Ea
= 5.6 meV (corresponding to H B
B H), we obtain T = 2.2 K. In other words, isolated (dilute) Hg adatoms on an ideal (defect-free) graphene surface can only be observed if the deposition and subsequent characterization are performed at very low temperature, of the order of few K. Increasing temperature will activate surface diffusion, and Hg adatoms may become trapped in defective regions (e.g. graphene edges, Stone Wales defects, vacancies, grain boundaries), form clusters, etc [28, 38, 39].

Figure 6. Adsorption energy along H  T and H
  B paths, in the dilute regime (θ = 1/18, 3 × 3 configuration), i.e. governing the migration of isolated Hg adatmos on the surface of graphene. The adsorption energy is plotted for each path divided in segments of equal lengths.
Download figure:
Standard image High-resolution image3.4. Electronic properties
Figure 7 shows the band structure and density of states (DOS) for graphene and for graphene+Hg for the cases of the HTT configuration and for θ = 1/8 and θ = 1/32. The system remains gapless even when we consider SO-coupling in the calculations. Aside from the emergence of Hg-related bands, the main observation is the shift of the Fermi level with respect to the Dirac point of graphene, which depends on Hg concentration (summarized in figure 8). In the more dilute regime (θ = 1/32 and θ = 1/18), there is a small shift of the Fermi level to below the Dirac point, indicating a slight acceptor behavior of the isolated Hg adatoms. For an adatom concentration of θ = 1/18, this shift becomes even more pronounced. However, when the concentration further increases to θ = 3/8, in the HTT configuration, the effect reverses, with a shift of the Fermi level to above the Dirac point, i.e. suggesting a donor behavior. This reversal can be understood as due to the change from isolated adatoms to the formation of a Hg monolayer. This duality of regimes is clearly shown in figure 10, where it is possible to see that the charge densities are qualitatively the same within the same Hg coordination regime (adatom or monolayer), regardless of the Hg concentration. The observed donor behavior of the Hg monolayer is consistent with the simple analytical model proposed in reference [40] for the heavy elements Ag, Au, and Pt, characterizing the graphene-metal interface solely in terms of the work function: the work function of Hg (∼4.5 eV [41]) is below the ∼5.4 eV threshold where n-type behaviour is observed [40]. The formation of the Hg monolayer also renders the entire system (graphene plus Hg monolayer) metallic: the Hg monolayer introduces energy bands that cross the Fermi level (i.e. the Hg monolayer is metallic), which in addition is shifted upwards in energy, i.e. to a region of higher DOS in the Dirac cone of graphene (i.e. the graphene layer itself becomes more metallic).

Figure 7. (a) (top) Band structure and (b) (bottom) density of states for pristine graphene and for graphene + Hg for θ = 1/32, θ = 1/8 (at H high symmetric site) and θ = 3/8 (HTT configuration).
Download figure:
Standard image High-resolution image
Figure 8. Shift of the Fermi level relative to the Dirac point (ΔE), as a function of the nominal concentration (θ). Positive ΔE corresponds to a Fermi level above the Dirac point. Except for the HTT configuration (θ = 3/8) data are shown for Hg at the H site.
Download figure:
Standard image High-resolution image3.5. EFG as a structural local probe
In this section, we discuss how the calculated EFG parameters, which strongly depends on the local charge distribution, can be used in an experimental setting to identify the spatial configurations of Hg adatoms on graphene. This involves comparing the EFG values calculated for multiple possible configurations to those measured experimentally using hyperfine techniques. Figure 9 shows the EFG parameters, Vzz and η, calculated at the Hg nucleus, for the different nominal concentrations and different high-symmetry sites, at the equilibrium distance, deq , between Hg and graphene. Table 1 compiles all the relevant parameters obtained in these calculations: binding energy and the corresponding distance deq , and the EFG parameters, Vzz and η. The calculated EFG values show some variation when comparing different high-symmetry sites, and are in particular strongly dependent on concentration θ, i.e. the Vzz strongly increases in the monolayer-type configurations (θ = 3/8 and θ = 1/2) due to the Hg coordination, making EFG a clear indicator of the concentration and position of Hg on graphene. We evaluated the role of the different orbitals in the obtained EFG values. Significant contributions are observed for p-p, d-d and s-d orbitals. Although total Vzz changes significantly from the highest nominal concentration (θ = 1/2) to the dilute regime (θ = 1/32), contributions from the p-p orbitals always dominate (73% and 87% for the two extremes, respectively). Figure 10 shows the charge distribution and the charge isolines when Hg adatoms are at equilibrium distance deq for the metallic configuration HTT and isolated adatoms with θ = 1/18. There are noticeable differences between the charge distribution of these two regimes (isolated versus monolayer) which help understand the drastically different Vzz . On one hand, the small Vzz for θ = 1/18 agrees with the nearly perfectly circular isolines of the charge distribution representing the outer electronic shells of the Hg adatoms. This means that for diluted Hg coverages (here θ = 1/8, θ = 1/18 and θ = 1/32) the Vzz will have low values due to the mostly spherical charge distribution of the Hg closed 6s2 shell.

Figure 9. Vzz and η EFG parameters at Hg site at the equilibrium energy, for all nominal concentration (θ), for each site H, T and B.
Download figure:
Standard image High-resolution image
Figure 10. Charge distribution ( ) of graphene-Hg system for HTT metallic configuration (left) and for the nominal concentration of θ = 1/18 for Hg at H position distribution (right).
Download figure:
Standard image High-resolution image
On the other hand, the high Vzz for the HTT monolayer is a consequence of the non-spherical charge distribution around Hg, mostly due to the interaction with the Hg nearest neighbors.
PAC spectroscopy is a particularly suited technique to measure the EFG parameters which can be compared to the calculated values presented here. For PAC experiments on Hg, the  Hg/199Hg isomeric decay, with an intermediate 5/2− state with 2.45 ns half-life, is well established [42, 43]. PAC is a time differential statistical measurement where the observable is the decay histogram of two consecutive γ-rays in coincidence. Taking into account the short half-life of the probing state
  Hg of 2.45 ns, no more than 20 ns (approximately 8 half-lives) can be resolved with enough statistics. Therefore, we estimate a limit such that half a period of the characteristic PAC perturbation function can still be interpreted, i.e. 20/2 ns, leading to a minimum value of Vzz
to be experimentally determined of
Hg of 2.45 ns, no more than 20 ns (approximately 8 half-lives) can be resolved with enough statistics. Therefore, we estimate a limit such that half a period of the characteristic PAC perturbation function can still be interpreted, i.e. 20/2 ns, leading to a minimum value of Vzz
to be experimentally determined of  . The experimental time resolution is below 0.8 ns being the precision of the Vzz
mainly dependent of the error of the quadrupole moment of about 9% [42]. This implies that based on PAC measurements of Vzz
, it would be possible to distinguish the two regimes of Hg adatom concentration discussed above, i.e. between isolated Hg adatoms and the onset of aggregation into a metallic Hg monolayer. Such experiments can be performed, for example, using the ASPIC setup at the ISOLDE facility at CERN [29], where adatoms can be deposited at low temperature, down to liquid He, and PAC measurements can be performed in-situ as a function of temperature. Based on the calculations presented here, one can expect that, upon deposition at low temperature, one would first observe the low Vzz
associated with isolated Hg adatoms on H sites. Increasing temperature would eventually activate diffusion and consequently part of the Hg will also be in segregated states such as the θ = 1/2 and θ = 3/8 cases. This different populations of Hg arrangements would result in the observation of both the low and large Vzz
values associated with the isolated and metallic Hg layers, respectively. This type of experiments has been previously performed at ASPIC to investigate structural and magnetic properties of metal surfaces (e.g. Ni and Pd) [29]. The calculations presented here show the potential of hyperfine techniques in the context of adatoms on two-dimensional materials. One of the advantages of this approach is that it allows to locally probe the adatom without affecting it, i.e. avoiding the influence of external probes, such as the tip of a scanning probe microscope or the intense electron beam of a transmission electron microscope. Additionally, a PAC spectrum can be measured with as little as 1010 probe atoms, corresponding to a coverage of 0.01% for a typical 5 × 5 mm2 sample, i.e. the approach can be applied down to extreme levels of adatom dilution. Moreover, measurements are compatible with applied electric or magnetic fields [29].
. The experimental time resolution is below 0.8 ns being the precision of the Vzz
mainly dependent of the error of the quadrupole moment of about 9% [42]. This implies that based on PAC measurements of Vzz
, it would be possible to distinguish the two regimes of Hg adatom concentration discussed above, i.e. between isolated Hg adatoms and the onset of aggregation into a metallic Hg monolayer. Such experiments can be performed, for example, using the ASPIC setup at the ISOLDE facility at CERN [29], where adatoms can be deposited at low temperature, down to liquid He, and PAC measurements can be performed in-situ as a function of temperature. Based on the calculations presented here, one can expect that, upon deposition at low temperature, one would first observe the low Vzz
associated with isolated Hg adatoms on H sites. Increasing temperature would eventually activate diffusion and consequently part of the Hg will also be in segregated states such as the θ = 1/2 and θ = 3/8 cases. This different populations of Hg arrangements would result in the observation of both the low and large Vzz
values associated with the isolated and metallic Hg layers, respectively. This type of experiments has been previously performed at ASPIC to investigate structural and magnetic properties of metal surfaces (e.g. Ni and Pd) [29]. The calculations presented here show the potential of hyperfine techniques in the context of adatoms on two-dimensional materials. One of the advantages of this approach is that it allows to locally probe the adatom without affecting it, i.e. avoiding the influence of external probes, such as the tip of a scanning probe microscope or the intense electron beam of a transmission electron microscope. Additionally, a PAC spectrum can be measured with as little as 1010 probe atoms, corresponding to a coverage of 0.01% for a typical 5 × 5 mm2 sample, i.e. the approach can be applied down to extreme levels of adatom dilution. Moreover, measurements are compatible with applied electric or magnetic fields [29].
Table 1. Binding energy and the corresponding distance (deq ) and EFG parameters (Vzz and η), for all different nominal concentration (θ), for each high symmetric positions H, T and B and for HTT configuration.
| Nominal concentration θ | Site | Binding energy meV | deq Å | Vzz V Å−2 | η |
|---|---|---|---|---|---|
| H | 103 | 3.76 | 837.3 | 0.00 | |
| 1/2 | T | 110 | 3.69 | 808.6 | 0.00 |
| B | 108 | 3.70 | 824.6 | 0.02 | |
| 3/8 | HTT | 123 | 3.60 | 489.7 | 0.00 |
| H | 171 | 3.48 | −3.0 | 0.00 | |
| 1/8 | T | 162 | 3.49 | −9.6 | 0.00 |
| B | 165 | 3.53 | −14.3 | 0.23 | |
| H | 186 | 3.45 | −6.6 | 0.00 | |
| 1/18 | T | 178 | 3.46 | −13.8 | 0.00 |
| B | 180 | 3.49 | −19.0 | 0.27 | |
| H | 188 | 3.44 | −8.4 | 0.00 | |
| 1/32 | T | 180 | 3.45 | −13.8 | 0.00 |
| B | 181 | 3.46 | −19.5 | 0.30 |
4. Conclusions
We carried out a DFT study of Hg adatoms on graphene. Hg as isolated adatom (with concentration θ = 1/32) at H-symmetric site was found to be the most stable configuration, with a binding energy of 188 meV. For isolated adatoms, the binding energy increases with decreasing adatom concentration and depends on adsorption site (H, T, or B). A migration barrier of ∼5.6 meV along H B
B H paths was estimated, corresponding to a threshold temperature for adatom surface mobility of a few Kelvin.
The effect of Hg adsorption on the electronic structure of graphene is strongly dependent on adatom coverage. Whereas isolated adatoms have only a small acceptor-like effect, leaving the electronic structure of graphene virtually unaffected, Hg monolayer configurations induce a metallic state, with the Fermi level moving well above the Dirac point (donor-like behavior).
Based on the EFG calculated for the various configurations, we propose that hyperfine techniques can be used to experimentally study Hg adsorption on graphene, in particular by measuring the EFG using PAC spectroscopy ( Hg/199Hg isomeric decay, with an intermediate 5/2− state with 2.45 ns half-life). For example, upon deposition of dilute, isolated Hg adatoms below the mobility threshold temperature (few Kelvin), it would be possible to detect the onset of migration and agglomeration (with increasing temperature) into the HTT monolayer configuration. Although the calculations presented here suggest that the dilute configuration is more stable than monolayer configurations, it is plausible that under different conditions, segregation may occur. For example, shifts of the Fermi level due to defects or specific substrates may affect the electrostatic interaction between the Hg adatoms and thereby stabilize cluster or monolayer configurations. Such hyperfine studies could be correlated with transport measurements, which, based on our calculations, would show a change from p-type to n-type conduction. Such PAC experiments would allow to locally probe adatoms in the low-coverage extreme (down to ∼0.01%), while being compatible with applied electric and magnetic fields, and avoiding the influence of external probes and particle beams.
Acknowledgments
This work was funded by the Portuguese Foundation for Science and Technology (FCT) (CERN-FIS-NUC-0004-2015, CERN-FIS-PAR-0005-2017, POCI-01-0145-FEDER-032527, SFRH/BPD/82059/2011, SFRH/BD/93336/2013 and SFRH/BD/84743/2012), by CICECO-Aveiro Institute of Materials (POCI-01-0145-FEDER-007679)—FCT reference (UID/CTM /50011/2013), by the Fund for Scientific Research Flanders (FWO) and the KU Leuven BOF (CREA/14/013, STRT/14/002).