

Abstract
A need for multi-functional assessment tools evaluating trade-offs and co-benefits for various types of Nature-Based Solutions (NBS) has been increasingly identified in recent years. Methodologically, concepts for a tool are presented which include quantifying the demand and potential for NBS to enhance ecosystem service (ES) provision, and linking ESs to readily quantifiable and legislatively-relevant environmental quality indicators (EQIs). The objective of tool application is to identify optimal NBS placement across a diverse set of socio-environmental indicators, whilst also incorporating issues of relative location of areas of implementation and benefit accrual. Embedded within the tool is the importance of evaluating outcomes in terms of economic benefits and of sustainable development goals. The concepts are illustrated with simplified examples, relating to the case of implementing urban forestry as an exemplar NBS. By summarising the knowledge base it is demonstrated that benefits of NBS are substantially scale-dependent in two main respects; those of extent and proximity to receptors. Evaluation tools should be capable of quantifying scale-dependence. The substantive importance of these considerations and how their dynamics vary between indicators and services is illustrated graphically through schematic functions. When developed, the tool should be used as a focus for consultation and co-design to pinpoint the size of NBS necessary to achieve a sufficient level of benefit for a particular receptor. This could be measured against target levels of benefit for each indicator, distinguishing between primary intended outcomes and those co-benefits or trade-offs that are secondary or unintended.
Export citation and abstract BibTeX RIS

Original content from this work may be used under the terms of the Creative Commons Attribution 4.0 license. Any further distribution of this work must maintain attribution to the author(s) and the title of the work, journal citation and DOI.
1. Introduction
Future climate conditions, alongside rapid urban expansion, will likely undermine global ambitions to improve human health and well-being in cities. Threats from air pollution, flooding, freshwater eutrophication, heat island effects, ecological degradation and contaminated land (Wang et al 2008a) have created an urgent need for urbanisation to be accommodated more sustainably. There is scope to achieve sustainable growth through Nature-Based Solutions (NBS) designed to maintain and enhance ecosystem services (ES). NBS involve innovative utilisation of beneficial processes though engineering and managing of natural environments near or as part of urban infrastructure. NBS protect, sustainably manage, and restore natural and modified ecosystem function and processes (Wei et al 2018, Hobbie and Grimm 2020) that address societal challenges effectively and adaptively (Aronson et al 2017), simultaneously providing human well-being and biodiversity benefits. The role of NBS in the urban environment, and the ESs that the underpinning breadth of natural processes inherent in these features provide has been increasingly recognised across practitioner sectors (research, government and business) and general public (Kremer et al 2016, Perrotti and Stremke 2018, Miller and Montalto 2019, Ferreira et al 2020). These are now an important component of urban design standards across the world. Whilst much progress has been made, ultimate success is dependent on a full assessment of economic and environmental benefits, concerted action in governance and public education and access to wider range of funding resources (Li et al 2017). Decisions on highly-valued urban land use involve many and varied stakeholders, necessitating a multi-perspective understanding of benefits and costs of NBS. Many recent reviews of NBS are available, examples of which are given for background information. Some reviews have multiple perspectives (Wang and Banzhaf 2018), others have specific disciplinary focus, for example air pollution (Abhijith et al 2017), water management (Nika et al 2020), water treatment (Boano et al 2020), contaminated land (Song et al 2019), urban cooling (Koc et al 2018) and public health (van den Bosch and Sang 2017). Other reviews address specific issues, including climate change (Parker et al 2020) and social factors (Venkataramanan et al 2020).
A wealth of evidence and experience from practice can be drawn upon to inform evaluation of NBS. For example, design guidelines from the perspective of stormwater mitigation are long established for specific NBS (e.g. green roofs: Stovin 2010) and more generic nation-specific guidance (e.g. Griffiths et al 2020). However, designing solutions beyond hydrological issues lacks the necessary concerted integration across environmental sectors to enable evaluation of trade-offs and synergies between different ESs (Baptiste et al 2015, Kabisch et al 2016). Also missing are considerations across both local and regional scales (Cherrier et al 2016) and incorporation of values that urban dwellers place on green space (Ives et al 2017). NBS can provide multiple benefits. For example, trees provide hydrological and water quality benefits (Livesley et al 2016), act as a sponge for atmospheric pollution, improving air quality (Nowak et al 2018, Jones et al 2019). Water bodies and evapotranspiration from vegetation absorb heat and cools surrounding areas (Wang et al 2008b). Soils and soil biota act to retain and detoxify many pollutants (Ashraf et al 2017). Parklands provide the majority of green infrastructure in many urban areas and therefore underpin numerous ESs (e.g. water purification, surface runoff retention, air filtration, dust removal and blocking, contribution to physical and mental wellbeing of city dwellers through recreational activity, relaxation and aesthetic benefits). The ecological components of parks also govern the function, structure, health and diversity of plant and animal communities.
2. Aims and objectives: rationale for multi-domain relationships under NBS
Understanding interrelationships between ESs are fundamental to future sustainability of urban areas based on minimising natural and human stress. Whilst benefit assessment tools covering a range of urban ESs are becoming available (e.g. Kuller et al 2019) it is necessary to widen the context beyond local-scale issue-specific solutions and to evaluate impacts at various spatial and temporal scales. Moreover, analyses pinpointing trade-offs and co-benefits arising from proposed NBS should also seek to distinguish between intended and unintended consequences (Hobbie and Grimm 2020). In these respects, the bringing together of contrasting methods across disciplines so as to be coherent in terms of their driving data and the spatio-temporal resolution and extent of benefit assessment presents a difficult challenge and one that is yet to be achieved satisfactorily.
Co-design with stakeholders is necessary to overcome the considerable and multi-faceted institutional barriers encountered when implementing NBS (Dhakal and Chevalier 2017). This supports the multi-disciplinary nature of assessment and could successfully inform optimal design of future urban areas integrating societal, environmental and economic benefit.
In response, we propose a prototype framework of value to authorities, planners, businesses and wider communities alike. To quantify co-benefits and trade-offs, we use the concept of environmental quality indicators (EQIs) which are representative of state variables that are readily measured or modelled, and that are closely linked to ecosystem functioning and service provision. Our overarching question is: 'How does the size of implemented NBS and the spatial extent of its influence affect the arising co-benefits and trade-offs between a range of environmental quality indicators?' In this respect, the scope in terms of range of EQIs and extent of scale dependencies is summarised diagrammatically (figure 1). The concept covers a breadth of NBS but for illustrative purposes we put particular attention on forested parkland, which is highly beneficial and commonly found in Europe (Almassy et al 2018). We address multi-domain consequences of urban forest establishment, considerations of which have been reviewed (Turner-Skoff and Cavender 2019) and also synthesised using the iTree system (Bodnaruk et al 2017). However we seek a different emphasis, through comprehensive consideration of the spatial variation in demand for NBS (by mapping potential beneficiaries) and by developing scale-dependent functions to quantify benefits. Integral to the concept are considerations of prospective changes in climate and societal drivers.
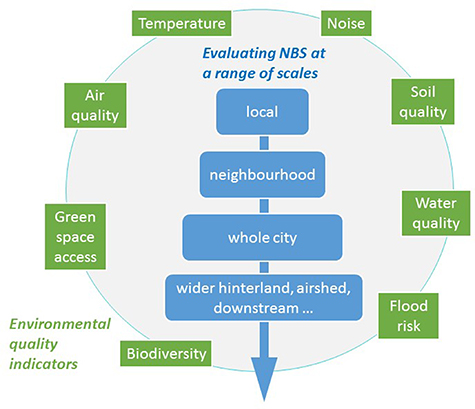
Figure 1. Scope of the multi-domain framework illustrating EQI groups and scales of assessment.
Download figure:
Standard image High-resolution image3. Demand and potential for NBS, how these relate in space and the benefits they provide
3.1. A framework for multi-disciplinary assessment
Fundamental in assessing co-benefits and trade-offs in multiple environmental domains (figure 1) is a means to quantify demand for NBS and the potential for it to deliver a service. Achieving this in a complex urban context (Gatzweiler et al 2018) requires consideration of a wide spectrum of spatial relations and temporal factors. We adopt the ecosystems-enriched Drivers-Pressures-State-Exposure-Effects-Actions framework (eDPSEEA) (Reis et al 2015) to make conceptual linkages along multiple chains of pressure-intervention-ES assessment. Optimal specifications are aligned directly to public health targets as part of a wider process of circular application of eDPSEEA. These targets are encompassed in UN Sustainable Development Goals (SDGs) and the corresponding indicators utilised to measure progress (https://unstats.un.org/sdgs/indicators/indicators-list/).
3.2. Demand
Three concepts are overlaid together to assess demand (table 1, columns 1–3). These are (1) environmental pressures (related to the EQIs we address) (2) exposure of the population (e.g. density), and (3) vulnerability defined through population demographics (e.g. indices of poverty or mobility). The choice of metrics used to represent EQIs will be application-dependent.
Table 1. Categorising demand, potential and benefits of an example NBS (tree planting with/without associated parkland). Explanation of column headings: (2) EQIs defined as statistics of state variables related to thresholds of acceptability, (3) Vulnerability indicators are defined by geographic features or demographics from census, (4) Primary ecosystem service types supported are indicated (MEA, 2005) ([S] supporting, [R] = regulating, [P] = provisioning, [C] = cultural) (11) SDGs addressed in order of relevance (in addition to SDG 11). The second row (italics) relates to where the column predominantly lies within the eDPSEEA concept (it is stressed this is a simplification of more nuanced relationships).
| Pressure (1) | Environmental quality indicator (EQI) (2) | Population density combined with GIS-derived spatial social vulnerability indicator (3) | End point (contribution to ecosystem service by NBS) (4) | Spatial relation of ecosystem service provision and benefit (5) | Likely optimal location of NBS—based on a priori knowledge (6) | Primary economic benefit (7) | Other benefits (8) | Potential funding sources (9) | Main SDG indicator addressed (10) | Other main SDGs (11) | |
|---|---|---|---|---|---|---|---|---|---|---|---|
| Pressure | State | Exposure | State | n/a (context) | Action | Effect | Effect | Action | n/a | n/a | |
| A | Regional scale aggregate of air polluting activities | Air quality (ambient pollutants concentration) | Public health (demographic proxies, Index of multiple deprivation ± mobility) | Role in air purification function [R] | Large scale: pollution sources and prevailing winds, long-range transport of pollutants into and from urban areas | Belt outside urban area reducing influx of pollutants into urban areas | Avoided loss of productivity | Reduced primary and secondary health care costs; improved cognitive development | Public | 11.6.2 Annual mean levels of fine particulate matter (e.g. PM2.5 and PM10) in cities (population weighted) | 3, 8 |
| B | Intra-urban air polluting activities | Air quality (ambient pollutants concentration) | Public health (demographic proxies, Index of multiple deprivation ± mobility) | Role in air purification function [R] | Local hotspots and sources—NBS providing barriers for exposure (potential negative effects on air circulation dispersal) | Line features and shelterbelts e.g. separating roads from cycle and walking lanes, houses, schools | Avoided loss of productivity | Reduced primary and secondary health care costs; improved cognitive development | Public | 11.6.2 Annual mean levels of fine particulate matter (e.g. PM2.5 and PM10) in cities (population weighted) | 3, 8 |
| C | Fluvial flooding (basin-scale) | Incidence of flow over threshold | Location relative to floodplain (flood frequency) (insurance cost) | Role in flood prevention (water retention) function [R] | Downslope river floodplains | Upslope of urban rivers or rivers upstream of urban area | Avoided insurance costs. Avoided damage/loss | Public/private | 11.b.2 Proportion of local governments that adopt and implement local disaster risk reduction strategies in line with national strategies | 9, 6, 10, 13 | |
| D | Pluvial flooding (local-scale) | Rainfall above threshold | Location relative to areas of topographic convergence ± low infiltration capacity (insurance cost) | Role in runoff reduction [R] | Downslope | Low lying area with drainage problem. Upslope of areas of topographic convergence ± low infiltration capacity | Reduction of investment required for storm drainage. Avoided insurance costs. Avoided damage/loss | Benefits of general green spaces, for urban biodiversity, aesthetics, urban agriculture | Public/private | 11.b.2 Proportion of local governments that adopt and implement local disaster risk reduction strategies in line with national strategies | 9, 6, 10, 13 |
| E | aDrought | Incidence of flow below threshold | Entire city population supplied by water (avoided increased water access cost — e.g. from large scale transfers) | Role in maintaining water provisioning and reducing water demand (shaded areas, less evaporation) [P] | Large-scale downstream in water supply reservoirs | In headwater areas, next to river upstream of urban area/degraded river stretch | Reduced water transfer costs, avoided crop-losses due to insufficient irrigation | Avoided water usage restrictions | Public/eventually private water company | 6.4.2 Level of water stress: freshwater withdrawal as a proportion of available freshwater resources | 6, 13 |
| F | Water polluting activities | Water quality (concentration) | Entire city population supplied by water (avoided treatment cost) | Role in water purification function [R] | River networks: downstream water abstraction points | Next to river upstream of urban area/degraded river stretch, or by urban headwaters | Avoided water treatment and/or transfer costs | Avoided cooling losses, recreational loss due to algal blooms, avoided irrigation restrictions | Public/eventually private water company | 6.3.2 Proportion of bodies of water with good ambient water quality | 6, 14, 9 |
| G | Noise polluting activities | Noise level | Proximity to major roads and rail | Role in noise mitigation [C] | Small scale: nearby | Alongside major roads and rail | Avoided loss of productivity | Avoided long-term health impacts | Public/private | 8.1.1 Annual growth rate of real GDP per capita | 8, 3 |
| H | Heat stress | Air temperature | Business land uses (City centres) and areas of high building density | Role in air cooling [R] | In-situ and downwind (nearby) | Within urban area near city centre | Avoided energy costs (air con) | Avoided loss of productivity | Public/private | 8, 13, 7 | |
| I | Cold stress | Air temperature and wind speed | Wind-exposed areas along commuting routes | Role in sheltering [R] | In-situ and downwind (nearby) | Wind breaks in exposed areas and low-rise/density developments | Avoided energy costs (heating) | Avoided loss of productivity | 8, 7 | ||
| J | Aggregate of multiple stressors | Biodiversity indicators (for fauna, flora, invasive species, red-list species) | Residences with gardens and small public spaces | Role in maintaining levels (adequate for the locality) of biodiversity, pollination and habitat [P] | Multi-directional outwards from provision | Biodiverse trees spread widely across urban and peri-urban areas | Avoided loss of food production | Lower costs for future re-planting. Savings arising from enhanced pollination. Recreation and health. | Public (eventually private if e.g. pollination could be improved) | 15, 2, 3 | |
| K | Soil degrading activities | Soil quality | Poverty ± mobility Recreational users (and whole city — in terms of water quality effects) | Role in soil formation, in immobilising soil pollutants and in runoff purification [S] | In situ; and in downstream runoff area (water pollution) | Parkland, roadside verges, brownfield sites | Avoided loss of food production | Reduced remediation costs | Public/private if remediation is required by law | 2.3.1 Volume of production per labour unit by classes of farming/pastoral/forestry enterprise size | 15, 2, 6 |
| L | Urban growth —Increase in paved area | Urban Green Space (UGS) access | UGS Accessibility (Population's distance to the UGS; Cumulative UGS within proximity to population) | Role in improving indicators of human health and wellbeing [C] | Omni-directionally and benefits the surrounding population | Within a walking distance in dense urban areas (potentially in areas with lower income population) | Recreation | Health benefits, both physical and mental. | Public | 11.7.1 Average share of the built-up area of cities that is open space for public use for all, by sex, age and persons with disabilities | 3, 10, 13, 15 |
aIn the specific case of urban forestry, impacts on water provisioning to mitigate droughts are deemed insignificant and it is not considered further in the present study.(SDGs: 1 No poverty, 2 Zero hunger, 3 Good health and well-being, 4 Quality education, 5 Gender equality, 6 Clean water and sanitation, 7 Affordable and clean energy, 8 Decent work and economic growth, 9 Industry innovation and infrastructure, 10 Reduced inequalities, 11 Sustainable cities and communities, 12 Responsible consumption and production, 13 Climate action, 14 Life below water, 15 Life on land, 16 Peace, justice and strong institutions, 17 Partnerships for the goals).
Spatial dynamics are embedded in the framework. Environmental pressures vary in their spatial extent (table 1, column 1). As human exposure and vulnerability are societally-determined (culture/demographics/wealth), they will have spatial specificity. Spatial considerations are further conceptualised when linking demand to the role of NBS. Here the particular contribution of urban forestry (column 4) is linked to the local enhancement of ecosystem functioning and support of human welfare (Escobedo et al 2018). When considering how NBS provision and evaluation of its effectiveness relate in space, we apply concepts relating ES production (X) and benefit (Y) areas (Fisher et al 2009, Syrbe and Walz 2012), primarily identifying proximal or distal categories; i.e. the process of establishing NBS (X area) in an airshed, watershed or biodiversity-shed, and evaluating at the receptor (Y) (table 1, column 5). We also recognise the sensitivity of EQIs to the relative distances between the pressure source, locations of intervention (X) and receptor (Y). When locating NBS, balanced consideration will be given between blocking the pressure at source and close protection of specific receptors.
The temporal dimension is also essential in evaluating NBS, as its consideration introduces complications. Establishing forestry takes time, and changes in climate occur over the long term, introducing spatially and temporally 'distal' elements (Morris et al 2017), both often falling outside of planning and policy horizons. Air pollution may be at its most severe in winter when deciduous trees lack full potential to mitigate. Heat pressures also vary annually, and may exhibit strong seasonality depending on the latitude and continentality of the city. Noise follows regular diurnal and weekly patterns of traffic flow and is also influenced by specific events.
3.3. Potential
In order to assess the potential for NBS to support ES provision, the following are identified (table 1) from simplified a priori assessment using literature and expert knowledge:
- the likely optimal locations of a specific NBS (in this case planting trees alongside possibly establishing additional parkland) (column 6),
- the likely financial or monetary benefits for a city and its inhabitants in terms of economics (column 7 and 8)
- potential funding sources for NBS and how this may relate to opportunity for public-private partnerships (column 9)
- more-holistic assessment of benefits towards SDG 11 (column 10, sustainable cities and communities), and other SDGs (column 11).
3.4. Specification of environmental quality indicators
Rows (A–L) in table 1 cover selected EQIs (figure 1). The entries show examples of issues and pathways of mitigation that are of primary relevance in the sphere of urban sustainability. Rather than being an exhaustive list the examples are intended to be illustrative of the contextual considerations warranted for NBS options. Some EQIs are covered by more than one separate entry to distinguish how different scales of pressure are manifested. For air quality (A, B) and water quantity (C, D) these discriminate between regional and local scale effects. Discriminating the effects of different climatic extremes is also explored both for air temperature in terms of seasonal pressures (H, I) and also water quantity in terms of floods (C, D) and droughts (E).
In terms of establishing metrics for the EQIs, characteristics either of extreme or mean conditions will be relevant as appropriate. For example flood return periods (C, D) or low flow percentile statistics (Q95) (E) can be calculated as required. Metrics relate to legislation. Concerning air quality annual average conditions or short-term peak concentrations are stipulated by WHO guidelines. To mitigate acute pollution, the EU Water Framework Directive targets peak levels of water contaminating substances via 90th percentile threshold levels (e.g. ammonium, biochemical oxygen demand) or dangerously low levels of essential qualities (e.g. 10th percentile dissolved oxygen). Conversely, chronic effects are captured by mean values (e.g. phosphorus). A spectrum of approaches can quantify EQIs. These may involve model applications of differing levels of complexity as appropriate. Alternatively, direct measurements or outcomes of systematic literature review can be used.
For purposes of simplicity in the conceptual analysis (table 1), both vulnerability (column 3) and ES benefits (columns 4, 7 and 8) are assumed to be primarily felt by the city population. Consequences outside urban areas are significant however and require consideration in practice. For example, farming activity in downstream rural areas is vulnerable to the pressures manifested on urban water quantity and quality through their requirements for irrigation and protection from flooding. Likewise, urban forestry improves air quality locally within the city but also blocks adverse longer-range effects otherwise seen further away in rural areas.
4. Conceptual relations between NBS characteristics and scale-dependent benefit
A key requirement is to build frameworks which calculate how change in level of NBS provision affects benefit (figure 2) and the persistence and longevity of such benefit away from the source (figures 3 and 4). Three main aspects of benefit (environmental planning, economic development and social equity) undergo consideration by urban planners (Campbell 2007). The graphics do not seek to specify these benefits but their relevance is explored in more detail in narrative examples.
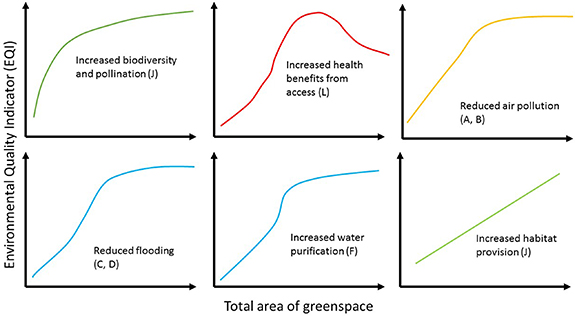
Figure 2. Relationship between total area of greenspace and EQI improvement. Qualitative Y-axis scales are normalised for each sub-plot from 0 to maximum.
Download figure:
Standard image High-resolution image
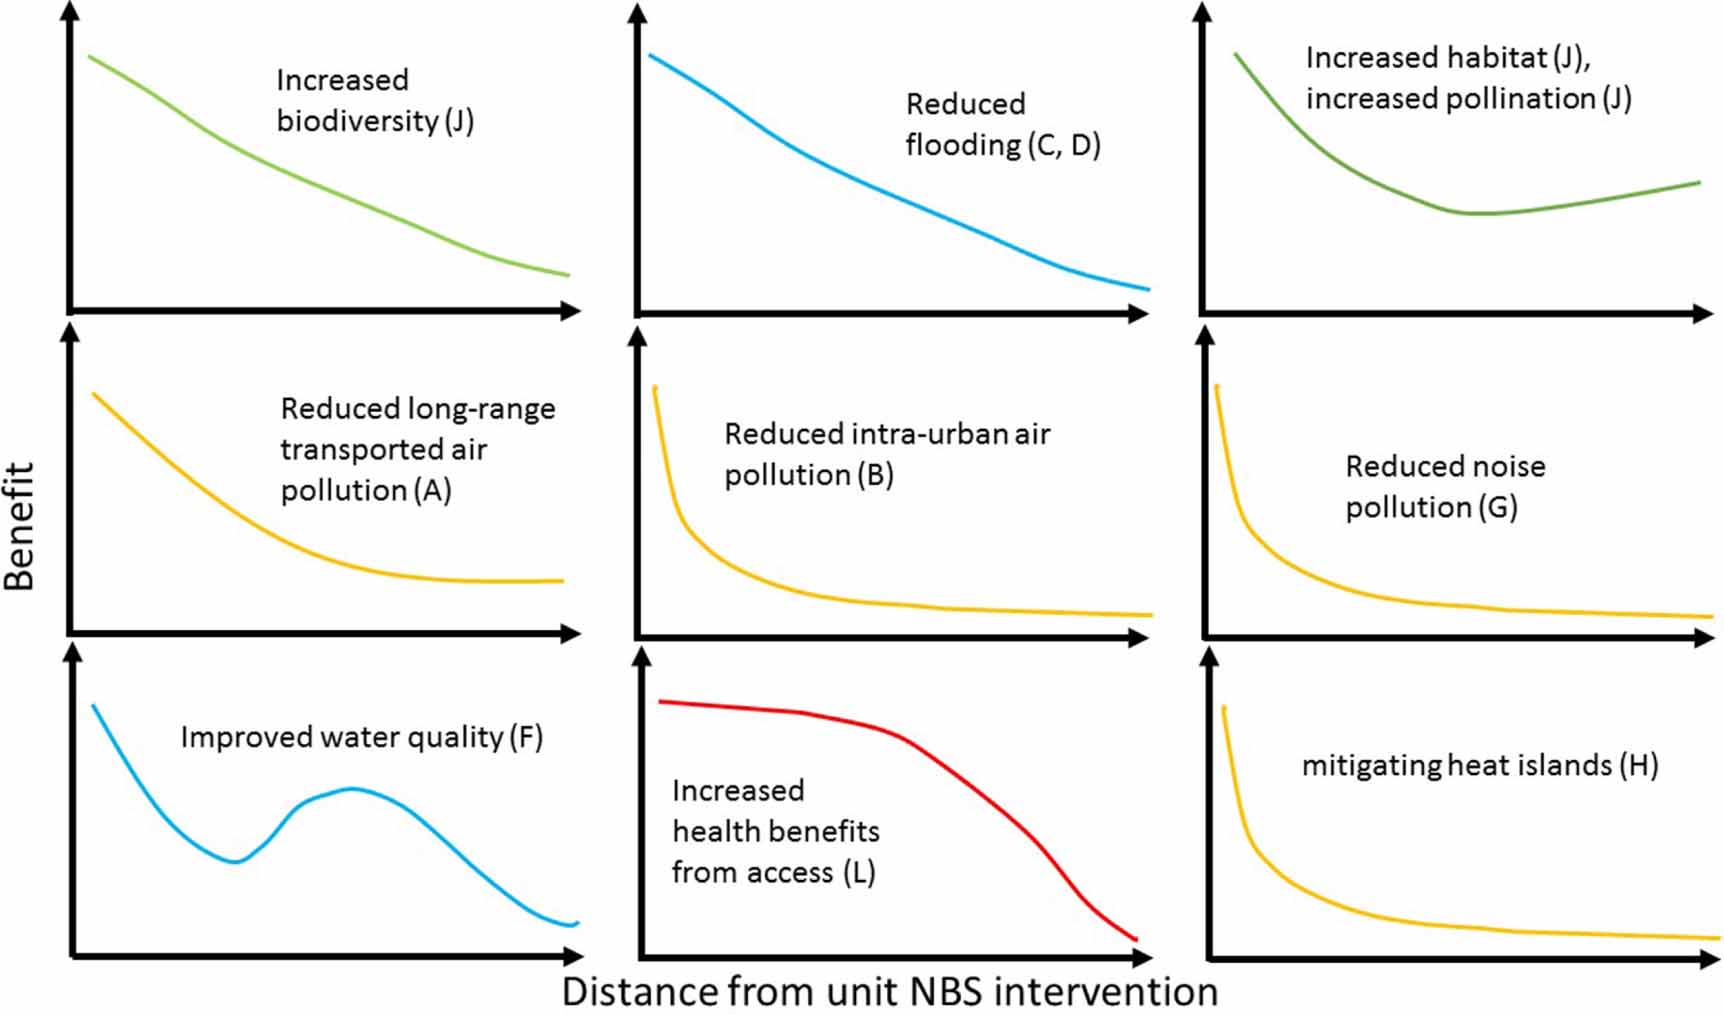
Figure 3. Relationship between benefit at a point and distance from NBS intervention. Benefit expressed in terms of EQI improvement (which each support one or more ecosystem services). Qualitative Y-axis scales are normalised for each sub-plot from 0 to maximum.
Download figure:
Standard image High-resolution image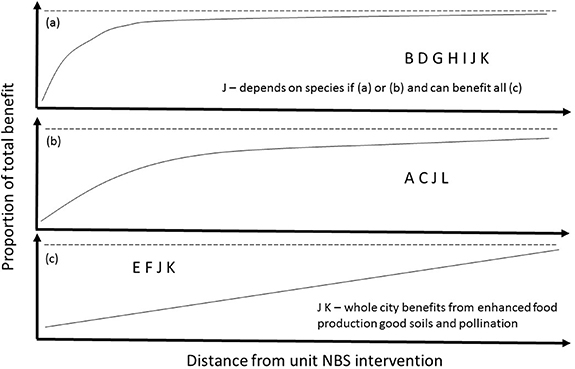
Figure 4. Relationship of proportion of total ecosystem service benefit with distance from intervention. Letters refer to rows (table 1). Total benefit reflects total numbers of beneficiaries and is expressed as ecosystem services. Total (dotted line) is not reached as there will be some additional beneficiaries (commuting and living outside the city) (a) benefits mostly realised nearby (b) benefits mainly realised nearby but substantial benefits still seen further away (c) invariant benefit as supply of ecosystem service is centralised.
Download figure:
Standard image High-resolution image4.1. How does the level of service provided respond to increasing greenspace?
Conceptually, we anticipate a family of relationships between size of greenspace and EQIs (figure 2). Service delivered can be equated to a total benefit. Here, we consider the total area of greenspace in a city. All EQIs are expected to respond positively to increasing greenspace. Nevertheless as size of greenspace progressively increases a saturation effect becomes apparent for some services (e.g. in terms of green space access (Bertram and Rehdanz 2015, Krekel et al 2016), and adverse societal effects may arise, such as escalating costs linked to increasingly attractive environments (Wolch et al 2014).
The relationships between greenspace and EQIs will vary depending on where and over what spatial range the EQIs are measured. Each indicator has a mappable hinterland (e.g. airshed, watershed etc). Relations will also vary temporally depending on ambient conditions, differing as a consequence of changing weather (e.g. level of direct sunlight) and atmospheric circulation patterns. Examples are explored in section 4.3 below. Beyond proximal temporal change, distal long-term change in climate will have substantial and diverse consequences for the role of NBS in relations between ES provision and benefit (Morris et al 2017).
Systematic consideration of further descriptors characterising the NBS are also necessary. In this respect analyses should go on to explore sensitivity in response of EQIs to factors such as NBS shape and morphology, and whether the NBS is a single entity or is fragmented, thereby lacking spatial connectivity. For example density of tree canopies (canopy percent occupancy) is important in determining the efficacy of riparian trees in cooling water temperatures (Garner et al 2017) and therefore sustaining good water quality.
4.2. How persistent is ES provision with distance from NBS?
The distance over which benefits provided by greenspace can be experienced will differ depending on the type of service. Figure 3 conceptualises how these relationships vary between EQIs and expresses the scale-dependent extent of influence of an NBS intervention. Benefit is defined as a standardised level per unit area of NBS. A key feature here are contrasting dynamics in the relationships between NBS provision and benefit for EQI in the air- and water-related domains. Assuming the number of beneficiaries is constant with distance, we seek to capture and quantify these contrasts. For air-related domains the level of benefit felt locally is strongly related to distance from the NBS. Benefits are primarily received close to the source as shown for air-related EQIs (figure 3) which are predominantly seen to decay with distance.
Conceptually, figure 4 makes the connection with ESs; and further generalises responses into three main groups. This primarily distinguishes between services that are predominantly provided through managed centralised systems (e.g. some water-based services) from other services. The proportion of total benefit accrued with distance from NBS is shown, being expressed in standardised relative values rather than absolute monetized terms. The focus is on beneficiaries within the city, but we acknowledge in practice that wider beneficiaries should be included. In the case of most services (figures 4(a) and (b)) the total benefit increases with distance as more beneficiaries are included, albeit with increasingly marginal gains due to the distance-decay functions of benefit (figure 3). Some service production and benefit relations are more localised (figure 4(a)) than others (figure 4(b)). In contrast for some water-related services (e.g. water provision and purification) a strong distance dependency in benefit is not apparent (figure 4(c)), as supply and sewerage is typically centralised at a large (whole-city) scale. However, in these cases local manifestation of benefit is still important because (a) the choice of where to abstract water requires the same understanding of local benefits (arising from proximal/distal analysis of benefit dynamics), which can be particularly relevant in rapidly urbanising regions where infrastructure is growing, (b) decentralised water supply is likely more prevalent in certain cases (e.g. in developing countries), (c) even if not the dominant component, accrual of recreational and environmental benefits of enhanced river water quality is likely to be significant.
The regional-scale interdependencies apparent for water-related services illustrate the need for consideration of inter-urban interactions. Beneficiaries of NBS established within urban areas also include those in other cities. The footprint of a city (including the mitigating influence of NBS) determines ES provision downstream via the quality and quantity of water supplied to cities further along the river system. Activities polluting the air in cities contribute both at a scale within the city itself and also to long range regional pollution which adversely affects neighbouring cities. Holistically, establishment of NBS in terms of air quality must reflect both these scales of interaction and cater for needs of beneficiaries in multiple cities.
4.3. Narrative descriptions of scale-dependent benefit for specific EQI
The dynamic relations (figures 2–4) are unpacked to illustrate greater granularity and provide example narratives of mechanisms and pathways toward NBS-related benefits. A selection of the EQIs and related ESs defined in section 3 (letters relate to table 1) are considered individually, exploring details and deviations from the general concepts.
For air-pollution-related EQI (A, B), the location of both air pollutant sources and receptors relative to the intervention is crucial. For intra-urban air pollution (B), the origin of air pollutant emissions is within the urban areas (e.g. road traffic or residential combustion) and urban vegetation will recapture for instance fine particulate matter (PM) and hence reduce ambient concentrations and thus exposure to this pollution within the city. In addition, this recapture will reduce the amount of pollution transported through the atmosphere away from the urban area and thus reduce pollution further afield. However, this effect declines rapidly, as pollution disperses and contributes to background levels. On the other hand, emissions in rural areas surrounding cities, as well as long-range transport of pollution, affect air quality in cities (A), and interventions outside the immediate urban area will reduce pollution transport into urban areas from afar. Due to lower background concentrations, interventions may be less effective by area, but larger areas available for vegetation than in urban areas can compensate for this.
Plants remove air pollutants through direct deposition of PM and gases on vegetation and through stomatal uptake of gases and PM (Jones et al 2019). Besides specific attributes of the trees themselves (e.g. leaf area index), and relevant meteorological factors (e.g. precipitation, humidity, temperature, wind speed), the key determinants of air pollution removal are extent of trees, and ambient pollutant concentration (Nowak et al 2018). For a given area of trees, a greater quantity of fine PM (PM2.5: <2.5 μm diameter) is removed at locations of high PM2.5 concentration, than at those of lower concentration. Nemitz et al (2020), however, highlight 'interactions that cannot be captured if benefits are quantified via deposition models using prescribed concentrations, and emission damage costs', underpinning the need for a more comprehensive assessment across scales and domains.
Flooding (C, D). Provision of benefits for mitigation of excess runoff caused by urban development is one of the most common and readily quantifiable forms of NBS intervention and has identifiable scale-dependent benefits. The interventions (sustainable urban drainage systems or low impact development) typically utilise natural surfaces as engineering solutions to improve infiltration, reduce runoff peaks and attenuate timing of peaks and flow recessions. The utility is long established (e.g. Butler and Parkinson 1997). Urban forestry can also achieve and enhance these desirable changes (Livesley et al 2016). The most direct benefit is locally-reduced runoff volume, leading to reduced risk of surface water flooding from exceeding storm drainage capacity. Immediately downstream this lessens the contribution to peak flows in receiving watercourses but the overall contribution is also reduced. At a wider scale, this delays the timing of peak flows in larger rivers. The effect may be negligible unless the intervention is of significant size relative to the overall contributing area. NBS measures are effective when located near headwaters, achieving reduction in downstream urban flooding. Benefits show a distance decay (figures 3 and 4). The reduction of urban flooding increases with the total area of NBS measures, and remains stable until they are saturated from local infiltration or lateral interflow. A shallow S-shaped curve depicting benefit in response to NBS size is expected (figure 2). A more rapid distance-decay in ES provision (figure 4(a)) is particularly notable with smaller-scale features that primarily address local-scale pluvial effects (row D in table 1). The increasing role of NBS in providing benefit is highly context-specific. Flood risk and control in a given urban areas will reflect a combination of source (NBS) as opposed to centralised (sewer designed) measures (Freni et al 2010).
Water quality (F). Provision or maintenance of good water quality has two main benefits: (a) enhancing or protecting aquatic biodiversity (including 'high value' species), (b) maintaining clean water supply and minimising costs of treatment or transportation of more distant and expensive resources. Separately (c), specific degraded river stretches may be targeted strategically for remediation. A broadly linear improvement in water quality in response to increasing total area of greenspace is likely (figure 2) (e.g. water temperature: Garner et al 2014, Johnson and Wilby 2015). For biological indicators, tipping points may be crossed. Saturation is likely reached at high NBS levels. When establishing riparian shade, for many physico-chemical water quality metrics (figure 3) there is distance decay. Desirable stream water cooling occurs nearby but the effect is moderated with distance. Likewise nutrient concentrations will be lower in close proximity to forested parkland but will increase again downstream. For other biologically-influenced metrics (e.g. chlorophyll, dissolved oxygen) there are more complex relationships which are influenced by water residence time (Bowes et al 2016, Hutchins et al 2016). The benefits brought about by growth limitation due to reduced light or nutrients in terms of suppressed algal blooms will not be manifested until further downstream. Oxygen dynamics initially mirror those of temperature but distal downstream benefits accrued from lessening of algal blooms also become significant.
Noise (G). Trees act to mitigate noise mainly via two key mechanisms: (a) absorption of energy by soft vegetation (leaves), although this is largely restricted to high frequency components of noise (Tang et al 1986, van Renterghem et al 2014); (b) scattering by larger woody structures (e.g. trunks) acting as barriers that break up and redirect sound waves, leading to increased atmospheric energy absorption. Redirection of sound increases the proportion of the energy absorbed by the ground, which typically under trees is softer and thereby more effective compared to for example bitumen or stone (van Renterghem et al 2012). As sound is directional, the mitigating effect of trees is contingent upon their location relative to both the source (e.g. road traffic) and the intended beneficiary (e.g. residences). For this reason, the relationship between the magnitude of benefits and scale (in the typical sense) is complex. Considering, instead, the relationship between noise level and the distance that noise has travelled through a stand of trees; there is a clear negative relationship, with sound level eventually diminishing to the regional ambient minimum. Therefore provision of benefit is likely to decay rapidly with distance (figures 3 and 4). Hypothetically, averaged noise from a linear source will diminish in air at rate of approximately 3.0 dB(A) with successive doubling of distance from the source (Haron et al 2019). Inclusion of a relatively densely planted stand of trees, would expect to provide a further diminishing of the noise level by 0.25 dB(A) per metre depth (van Renterghem et al 2014).
Urban Heat Islands (H) and Cold Stress (I). The temperature-related benefits of NBS operate through three principal mechanisms: (a) Storage and transport of heat energy (e.g. with flowing water), (b) evaporation (e.g. evapotranspiration by plants and evaporation of water), (c) buffering effects of trees, which is highly localised both for cooling by shade and reducing radiative heat loss. The high specific heat capacity of water also lessens extreme cold. Whilst airflow direction and velocity will have an impact on the detectable spatial extent of temperature effects, on still days the temperature-buffering effects of NBS can be highly localised. For example, Bao et al (2016) found that the cooling effects of urban green spaces were typically undiscernible beyond 180 m in Baotou, China. A rapid decay with distance is anticipated (figures 3 and 4(a)).
Biodiversity (J). A diverse and appropriate range of urban habitats, for example supported by a mix of tree species, supports healthy and biodiverse population levels of both sessile and motile organisms. It is helpful to consider the specific case of pollinators given their pivotal role in ES provision. Here, it can be considered that benefit realisation takes three important pathways: (a) creation of habitats with species to attract and maintain insect populations to facilitate pollination, (b) wider provision of habitats to support ecological communities, (c) maintaining a sufficient level of biodiversity as a whole, it being an important indicator of ecosystem resilience to external pressures. The presence of NBS has a big effect, but apart from habitat capacity, increasing size provides diminishing added benefit (figure 2). In terms of biodiversity indicators, realisation of pollination and foraging benefits decreases steeply with distance, down to zero at the extent of species dispersal range (Morris et al 1995). However, effects whereby large-scale pollinator corridors or colonisation habitats are linked may provide an appreciable distal enhancement of benefit (hence slight upturn with distance on figure 3) reflecting patch inter-connectedness of meta-populations (Hanski 2001) and enhancement of longevity and resilience at a landscape scale. Regarding impacts on food production, service benefits are likely more widespread and realised at a population (whole city) level (figure 4).
Urban green space (L). Receipt of benefits follows three primary pathways: (a) active regular enjoyment, (b) passive enjoyment and environment quality, (c) events and incidental enjoyment. Within walking distance, the benefits of urban green space are high and at a plateau (figures 3 and 4). Beyond that distance, which will clearly vary due to accessibility and demographic factors, the benefits decrease. Detailed specification of the relationship depends on the type of urban green space in which the unit NBS resides, the dimensions of benefits, demography, and purposes of access. The latter covers dimensions (e.g. enjoyment, physical activity, stress relief (Ekkel and de Vries 2017)) beyond the primary pathways of benefit receipt described above. Definition of 'walking distance' can be guided by nation-specific policies (Kabisch et al 2016) but for the purposes of the present analysis a threshold of 1000 m is appropriate which also represents a divide between local and community scale within a city. We recognise that this encompasses a wider potential set of users than the widely-used standard of accessible greenspace within 300 m (WHO 2016). With size of greenspace, a reduction of benefit as NBS becomes excessively large is likely in specific situations (figure 2) (as described in section 4.1).
5. Examples, outcomes and ways forward
5.1. Example application of a multi-domain NBS framework
To illustrate initial application, a mock-up example (figure 5) is presented for urban forestry NBS in Birmingham (UK). For simplicity, scale issues (section 4) are not considered. A sub-set of eight EQIs (from table 1) are evaluated under a set of NBS placement scenarios (S1–S8) which are chosen to represent optimal placement for each EQI in turn. Individual EQI evaluation scores are categorical across five classes. These can be defined in a variety of ways. Very likely, applications would use estimates of a common evaluation metric such as monetary values of the total ES provided. The simplest approach for comparing scenarios is equal average weighting. In the example, S8 (optimised for green space access (L)) scores highest. Alternatively, differential weightings are likely desired for specific purposes and can be applied with rank or absolute factors, as illustrated by two examples: (a) flood relief (C) or air quality provision (A) is perceived more important than other services, (b) for reasons of additional cultural/historic significance, remediation of contaminated land is given priority through a high soil quality (K) weighting. For context and contrast another type of NBS, rainbeds, is considered briefly (appendix).
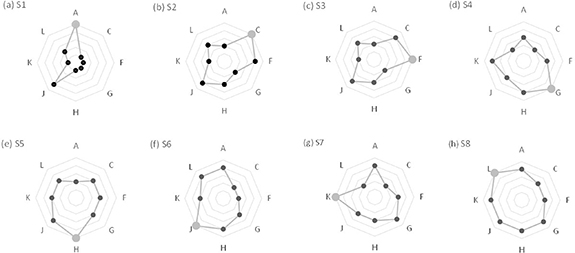
Figure 5. An a priori mock-up of a multi domain comparison whereby tree planting is optimised for maximal beneficial impact. On sub-plots (a)–(h) respectively, optimisation is undertaken in turn for eight primary benefits S1–S8 (air quality (A), flooding (C), water quality (F), noise (G), heat (H), biodiversity (J), soil quality (K), greenspace access (L)) relating to a sub-set of EQIs in table 1. In each case improvements for the primary EQI target (grey) and secondary/unintended EQIs (black) are distinguished. Individual EQI improvement scores range from low (centre) to high (edge). To illustrate application, local context for Birmingham (UK) is used as an example, with optimal locations on the sub-plots representing: (a) extensive arced belt outside urban area centered on NE side encircling the city (S1), (b) clumps near headwater urban rivers (S2), (c) along headwater urban rivers (S3), (d) along major roads and rail (S4), (e) within urban area, especially W side (S5), (f) throughout (S6), (g) along roads, in former industrial areas on E side (S7), (h) inner city (S8).
Download figure:
Standard image High-resolution imageApproaches using simple weightings of this type applied to categorical assessments of biophysical and socio-economic suitability have been employed as a pre-cursor for identifying optimal urban forest location (Sass et al 2019). Broadly, our framework mirrors this approach. In practice for all EQIs, an ongoing process of bringing together data, models and other quantitative GIS-based assessments will enable confidence in the evaluations to be progressively gained.
5.2. How to enhance the benefits of urban forestry NBS
Following the eDPSEEA response concept, the outcome envisaged from a multi-domain NBS framework is improved identification of specific actions and their effectiveness. In the case study related to urban forestry these might include:
- Undertake necessary house-building in districts where air quality is enhanced by NBS rather than those not receiving NBS benefits,
- Undertake necessary house-building in floodplains enhanced by NBS rather than those not receiving NBS benefits, in addition to leveraging the value generated by house-building for additional NBS,
- Satisfy increased water demand where water quality is most enhanced by NBS,
- Build or enhance commuting routes (walking/cycling) with NBS to improve cooling by shade and shelter from wind chill, buffering of traffic noise and filtering of pollution,
- Establish centres of productivity and amenity (e.g. allotments, protected natural zones) in areas where biodiversity is enhanced by NBS,
- Provide added amenities in the most accessible and attractive ('NBS-enhanced') parkland.
Directly planned benefits of these actions will be accompanied by indirect benefits.
5.3. Ways forward: using the framework to bring together key sectors
5.3.1. Underpinning urban systems modelling research
As perception of the value of NBS in urban environments grows, establishing better confidence in identifying optimal solutions will be of increasing importance. We envisage research progressing along three lines: (a) improving confidence in model skill, (b) use of numerical routines to bring models together to better identify optimal solutions, (c) consideration of multiple objectives as a set of interconnected eDPSEEA frameworks.
In terms of model testing (a) this will be a very substantial process and will move forward in many dimensions of NBS applications, by establishing skill in sensitivity to for example spatial extent, spatial location, fragmentation, proximal and distal effects in space and time. From a technical standpoint for pinpointing spatial location (b), multi-criteria fitting routines have been undertaken for optimising stormwater management (Kaykhosravi et al 2019, Kuller et al 2019), but with abundant alternatives in spatial configuration, the process can quickly become overwhelmingly complex. Even when considering systems comprising fewer variables than in figure 5 this is unlikely to be achievable with a single modelling tool and will demand sophisticated automated routines. Despite the challenges, multi-objective optimisation has been undertaken successfully (e.g. for agricultural management: Todman et al (2019)) which demonstrates that powerful integrated analysis can be achievable even when bringing together output from disparate models of varying structure and detail. The concepts introduced in section 4 demonstrate that the process of optimisation will potentially also require a formal mathematical representation to quantify size and proximity factors. Interconnection of multiple eDPSEEAs (c) is a means to link feedbacks between airshed and watershed processes, which can affect service provision and NBS impact. It can also improve practical connection with urban planning by better representing how the mechanism of EQI response may differ between when it is a primary consideration compared to when viewed as secondary or an unintended consequence.
5.3.2. Co-design for decision support
It is envisaged that the framework can be used in generic collaborative contexts, for example (a) in conjunction with natural capital accounting processes undertaken by different stakeholders. (b) as part of surveys of planners to validate the link between proposed NBS and required NBS. Facility to include a spectrum of different approaches to weighting can be inbuilt in the form of a sensitivity analysis. Assessing planned NBS and the relative importance of unintended consequences both beneficial and adverse are central motivations behind the scoring framework. Multi-objective optimisation has drawbacks in that its technocratic focus may foster exclusivity. However, following the principles of Saaty (1987), such frameworks have been integrated with participatory initiatives (e.g. Mendoza and Prabhu 2005).
Multi-disciplinary research will be central in gaining confidence in assessments undertaken based on the proposed framework (table 1). Research in the physical sciences will play a pivotal role in pinpointing optimal NBS locations (column 6). The examples in table 1 are illustrative and mask wide spectra of local complexity. Only through stakeholder dialogue and co-design can social, economic and policy research be effective in identifying wider benefits and mechanisms for implementation (Davies et al 2018). Nevertheless, the framework formulates clear potential, opportunity and focus for collaborative progress.
Acknowledgments
The paper is based on research undertaken for the DeSCIPHER project under the Sustainable and Liveable Cities and Urban Areas programme jointly co-ordinated by the Joint Programme Initiative (JPI) Urban Europe and National Natural Science Foundation of China (NSFC). Authors acknowledge funding from Economic and Social Science Research Council (UK), NSFC (China) and Research Council of Norway (Norway).
Data availability statement
No new data were created or analysed in this study.
Appendix.: Applications for other NBS types
For illustrative purposes rainbeds are included as a contrasting type of NBS to urban forestry. Despite differences in morphology, scale and intended purpose, the form of the functions in figures 2 and 3 are likely to be very similar. Any differences in the distance-benefit function (figure 3) are likely to be related to specific mechanisms such as cooling of river water by riparian trees which will have a different spatial dynamic to any cooling benefit provided by rainbeds. The most pronounced differences between the two NBS are likely to be overwhelmingly dominated by magnitude of effect (figure A1) which will have a large impact on weightings used in the framework (i.e. in versions of figure 5 for other NBS). In the Birmingham case study river-marginal urban wetlands and bio-retention cells/raingardens as a primary action will likely offer better improvements in flooding (C) EQI than urban forestry but will likely provide lower secondary benefits for most or all other EQIs.

Figure A1. Estimated effectiveness in terms of ecosystem service provision of rainbed NBS relative to urban forestry NBS linked to pressures (A–L) listed in table 1.
Download figure:
Standard image High-resolution image