Environmental Carrying Capacity Assessment—the Policy Instrument and Tool for Sustainable Spatial Management
 Małgorzata Świąder
 Szymon Szewrański
 Jan Krzysztof Kazak
- Institute of Spatial Management, Wrocław University of Environmental and Life Sciences, Wrocław, Poland
Nowadays, we are facing a global change associated with the rapid population growth and natural resources demand, whose impacts are accumulated in space and during the time. Therefore, humanity could be identified as Planet's Ecological Bigfoot. The anthropopressure disturbed the Earth's natural regulatory capacity, which could be noticed by the unavailability of freshwater, irregular temperatures, or interrupted biogeochemical flows. Moreover, the growth of population is expected, as well as the sprawl of urbanized areas, increasing demand for living space, food, and humans' ecological footprint. Therefore, the aim of the study was the implementation of the environmental carrying capacity (ECC) approach for more sustainable spatial management, especially in the context of developing residential areas in the city-region. The research evaluates the spatial policy established by the municipalities of the city and its surroundings and presents alternative scenarios of residential areas development. The alternative scenarios were built using excluded and restricted environmental zones to protect productive ecosystems. The impact of residential areas designed in spatial documents and scenarios has been assessed using the carbon footprint (CF) and biocapacity (BC) indicators within the environmental carrying capacity (ECC) framework. The lifestyle archetypes of the city's residents and its suburban zone were used as the main input for the assessment of CF and the natural areas required to assimilate human consumption. The comparison of CF and BC allowed verifying the consumed vs. available resources and to quantify the state of the environment. First of all, the research indicated the potential areas for the future development of human settlements. Secondly, the potential number of inhabitants in residential areas was assessed. Furthermore, the impact of inhabitants was quantified using the ECC approach. Finally, the surface of natural areas required for CF assimilation was assessed. The proposed approach could be relevant for spatial management, spatial policy evaluation, and modeling. It could provide a management tool and policy instrument for the sustainable development of human settlements. Moreover, it proposes implementation of environmental zones for allocation of land-use for housing purpose in a more sustainable manner, which is currently not used within the ECC assessment.
Introduction
Nowadays, we are facing the global change (also known as global warming, climate disruptions, climate chaos) which could be associated with the human species impacts that “transform the environment on a planetary scale and at rates that exceed historic bounds” (DellaSala, 2018). Current human activity is competing with global geophysical processes which have caused a reduction of the planet's ability to absorb pollutants and endangerment of the Earth system resilience (Steffen et al., 2011). Therefore, a recent geologic period was defined as Anthropocene (Steffen et al., 2011)—an era when humanity could be identified as Planet's Ecological Bigfoot (DellaSala, 2018). The infinite growth on a finite planet (von Weizsäcker and Wijkman, 2018) resulted in negative environmental consequences such as irregular temperatures, freshwater unavailability, and interrupted biogeochemical flows (Rockström et al., 2009). Moreover, population growth is expected, in particular in urbanized areas, as well as the sprawl of urban structures (United Nations, 2018). The urban sprawl could be seen as one of the most common spatial issues, especially by the problem of suburban boundary delimitation (Szewrański et al., 2013). Suburban areas are constantly under transformation which has a destructive effect on neighboring rural areas (Kazak and Pilawka, 2013). Rural areas provide food for the city and its inhabitants (represent the feeding zone of the city—the foodshed), as well as land for housing development. Meanwhile, rural areas struggle with biodiversity loss, degradation of the environment, and reduction in the supply of ecosystem services to residents in suburban and peripheral areas (Sylla et al., 2020). Thus, as the population growth is predicted, the increase in spatial conflicts occurring at the urban–rural fringe is also expected (Sylla et al., 2020). Therefore, the future spatial management of urbanized areas requires verification of available resources and the state of the environment (Świąder et al., 2018a) as a base for allocating land for a specific use, especially housing development. Such assessment could be provided within the framework of environmental carrying capacity (Zhang and Xu, 2010; Liu and Borthwick, 2011; Santoso et al., 2014; Wei et al., 2015; Jung et al., 2018).
The environmental carrying capacity (ECC) could be understood as “a concept and tool for sustainable development of human settlements; (…) a threshold level of anthropopressure, which the environment is able to balance and withstand without irreversible changes and serious degradation” (Świąder, 2018). One of the most frequently recommended solutions for ECC assessment is the use of environmental indicators as Ecological Footprint and biocapacity (Świąder, 2018).
The ecological footprint (EF) represents the biologically productive area needed to sustain human demands of the environment connected with resource exploitation/consumption, emitted waste and pollutants, and occupied space (Galli et al., 2015a). The major contribution to EF has a carbon footprint (CF), which could represent 60% of the total value of EF. CF “is an easy-to-apply tool for monitoring and quantifying greenhouse gas emissions (...)” (Caro, 2019). Thus, it could reflect CO2 or equivalent CO2 (CO2eq) related to waste generation or resource use by the population. In this research, the assessment of CF uses the lifestyle archetypes of the city's residents and its suburban zone. As Moore (2015) mentioned, the consumption characteristics of the residents of a given area are a necessary basis to define whether the consumption needs are adequate with an ecological carrying capacity (Moore, 2015).
The biocapacity (BC) measures the nature bioproductivity of a given area, which reflects the biosphere's regenerative capacity (Lin et al., 2016; Özbaş Emine Elmaslar et al., 2019) and provides ecosystem services, i.e., carbon dioxide sequestration (Sylla, 2016). The assessment of BC requires the assignment of current land use into six land-use types defined by the Global Footprint Network (GFN): infrastructure, forestland, grazing land, croplands, inland fishing grounds, and marine fishing ground. The BC is quantified based on area, yield factors (YF), and equivalence factors (EQF) determined for each land use type (Lin et al., 2016). YF represents the annual productivity for each land use type and is spatially and temporally different, which could be associated with various soil quality and management practices in a wide variety of countries (Baabou et al., 2017). The EQF converts a country's productivity of a given land use type into a global equivalent. EF, CF, and BC are expressed in “global hectare” unit (gha), which makes them comparable in spatial and temporal terms (Baabou et al., 2017).
The difference between EF and BC could identify the state of the environment. If EF or CF is higher than BC, it represents the state of the environment called an ecological deficit. It reflects insufficient physical area needed to sustain emission related to needs satisfied by the population of a given area (EF > BC). The state of ecological reserve presents the higher nature bio-productivity of the given area than the demand for resources—BC > EF. A quotient of EF and BC equals one represents the minimum environmental condition—ecological balance (Budihardjo et al., 2013; Galli et al., 2015b). However, the minimum environmental condition (BC ≥ EF) does not guarantee the maintenance and restoration of biodiversity, which is possible if 11–75% of productive ecosystems are preserved for this purpose (Hoekstra, 2007; Moran et al., 2008; Ohl et al., 2008).
Therefore, the study aimed to implement the environmental carrying capacity concept for more sustainable spatial management, especially the development of residential areas in the city-region. The research evaluates the spatial policy established by the municipalities of the city and its surroundings and presents alternative scenarios of residential area development. The alternative scenarios were built using excluded environmental zones and restricted environmental zones (Mondino et al., 2014) to protect productive ecosystems, increase biodiversity (Mondino et al., 2014) and allocate land use for housing purposes in a more sustainable manner. The difference between environmental zones arises from legal requirements imposed on nature protection forms such as national parks. The exclusion of protected areas should always be obligatorily considered in case of changing land use of a given area; therefore, these areas could be named as excluded environmental zones. The restricted environmental zones are not mandatory. However, excluding productive ecosystems or flooded area would avoid reducing biodiversity and decrease the vulnerability to flooding of future housing areas (Mondino et al., 2014).
The scenarios, together with indicators, are known as impact assessment tools which allow exploring the current and future state of a given area (Oana et al., 2011). The scenario modeling enables assessment, monitoring, and modeling of the development of urban and regional environments. The land use, population changes, socioeconomic factors, spatial planning, and other policies are the bases for the analysis (Barredo et al., 2005). Except for the input non-spatial and spatial data, the well-developed scenarios are based on assumptions or theories which are blended in GIS (Choi and Lee, 2016). Therefore, scenarios provide quantitative information that allows solving uncertain problems as intensive and poorly controlled urban development resulting in negative spatial changes, i.e., urban sprawl (Oana et al., 2011). It is an effective approach to understand the potential consequences of current spatial management and policies. Especially nowadays, we are facing with growing exposure to natural hazards as floods or forest fires (Barredo et al., 2005), as well as other negative effects as urban heat island, droughts, or flash flooding (Oral et al., 2020). The use of scenarios created based on multiple data, assumptions, theories, etc., allows appropriate land use management and incorporates a suitable solution to minimizing flood risk and other negative effects (Barredo et al., 2005). Thus, the scenario-based analyses using GIS are known as a spatial decision-making support system (Choi and Lee, 2016). It enables planning the future development of the area, avoiding spatial conflicts threatening the optimal use of land, natural resources and ecosystem services (Izakovičová et al., 2018; Furmankiewicz et al., 2019). Typical examples of spatial conflicts arise from the need for economic development and the need to protect the value of the natural environment (Cieślak, 2019), as allocation of best soils for industry, housing purposes, etc. (Izakovičová et al., 2018), or planning housing development in flood-risk areas (Szewrański et al., 2018). There could be divided three basic groups of spatial conflicts: “problems of endangering of the ecological stability of the landscape (including endangering of biodiversity and nature conservation areas); problems of endangering of natural resources (in particular forests, soils, waters); and, problems of endangering the immediate human environment (stress factors in residential and recreational areas)” (Izakovičová et al., 2018). The solution to avoid spatial conflicts could be to use integrated tools for optimal management of natural resources (Izakovičová et al., 2018).
Therefore, the results obtained in this research would allow the selection of land use for housing purposes based on the scenario with the least environmental impact. The proposed approach could be relevant for spatial management and spatial policy development. It could provide a management tool and a policy instrument for decision-makers and other relevant stakeholders.
Materials and Methods
Study Area
The study was illustrated by Wrocław city (Poland) and 10 surrounding municipalities (Czernica, Długołeka, Katy Wrocławskie, Kobierzyce, Kostomłoty, Miekinia, Oborniki Slaskie, Siechnice, Wisznia Mała, Zórawina)—Wrocław's suburban zone. Across the study area run six rivers Bystrzyca, Odra, Oława, Strzegomka, Sleza, and Widawa. Moreover, the research area crosses natural areas as Natura 2000—Special Areas of Conservation (SAC) and Special Protected Areas (SAP), Natural-Landscape Complexes, Protected Landscape Area, Landscape Park, ecological arable lands and nature reserves (Figure 1).
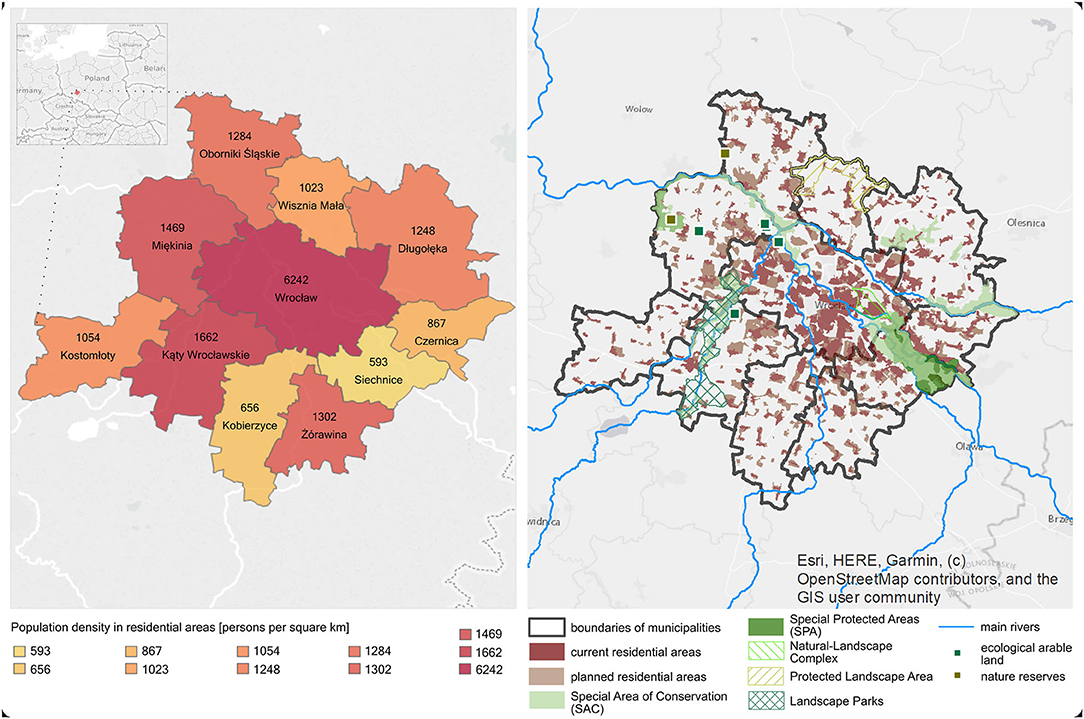
Figure 1. The study area (Left). Environmental conditions (protected areas, flood-risk areas, good-quality soils) vs. current and planned areas for housing (Right).
There are ten SAC areas crossing the study area (codes PLH020036, PLH020017, PLH020106, PLH020078, PLH020069, PLH020081, PLH020103, PLH020018, PLH020055, PLH020045); five of them cross Wrocław city, three of them cross the area of Długołeka and Miekinia municipalities, and other municipalities intersect with two or one of these areas. There are also two SAP areas (PLB020002 and PLB020008) that appear in the area of Wrocław city (PLB020002), as well as Czernica (PLB020002), Siechnice (PLB020002), and Miekinia municipalities (PLB020008). The Natural-Landscape Complex is located in Wrocław city. The Protected Landscape Area (Trzebnica Hills, org. Wzgórza Trzebnickie) cross municipalities Długołeka, Oborniki Slaskie, and Wisznia Mała, while the Landscape Park (Bystrzyca Valley Landscape Park, org. Park Krajobrazowy Dolina Bystrzycy) goes through the Wrocław city and Katy Wrocławskie, Kostomłoty, and Miekinia municipalities. There are two ecological arable lands—one in Oborniki Slaskie municipality and the second one in Miekinia municipality. Moreover, six nature reserves are located in the study area: three in the Wrocław city and two in Miekinia municipality.
Despite the natural conditions, Wrocław's suburban zone is known by its urban character, allocation of the most land for housing development, strong immigration of people from the central city, single-family housing dominance, long distances from the city center, homogenization of society, and development of new residential housing on former agricultural land (Szewrański et al., 2013).
In the period 1998–2009, one of the spatial policy objectives assumed the allocation of land use for housing development corresponding to the needs of 1,740,000 new inhabitants. The designation of an area for such number of people seemed to be impossible. Especially, the population growth in this area was not constant. Wrocław and its suburban zone were inhabited by 748,000 people in 1998, 741,000 in 2002, and 755,000 in 2009 (Szewrański et al., 2013). Currently, the total population of Wrocław amounts to 640,648 people, which together with 10 neighboring communes accounts for 820,851 inhabitants (state as for 31.12.2018). The highest population density in residential areas could be noted for Wrocław–6,242 persons per square kilometer, Katy Wrocławskie–1,662, Miekinia–1,469, and the lowest one for Siechnice–593.
The growth of the population between 1998 and 2018 was also not significant. However, the future objectives of spatial policy for this area still provide for the allocation of land for new housing development. The analyses of data have shown that the most land use for housing purpose would be allocated in Wrocław city—ca. 4570 ha, Miekinia—ca. 2690 ha, Oborniki Slaskie—ca. 2300 ha, in municipalities Kobierzyce, Zórawina, Siechnice, Czernica—between 1,600 and 1,000 ha, and in the other—Kostomłoty, Wisznia Mała, and Długołeka—ca. 800–700 ha.
This study would verify the allocation of land for housing purposes. It would assess the potential impact of current and planned residential areas defined within official planning documents of municipalities. Moreover, alternative scenarios would be created and a similar assessment would be provided. The assessment would quantify the potential number of inhabitants in these areas and their impact on the environment using the ECC approach.
Methods
The research has evaluated the spatial policy for the development of residential areas. The use of ECC allowed to assess the potential impact of current and future residential areas planned within the framework of the official planning document “a study of land use conditions and directions” (in short, a study; plural—studies) of each municipality. The study, according to Act on Spatial Planning and Development (org. Ustawa o planowaniu i zagospodarowaniu przestrzennym), is a planning document established for the entire area of the municipality, where the general description of the spatial policy and local development principles are provided. The study is not an act of local law; however, its principles are mandatory and should be taken into account in the preparation of the local spatial development plans.
The research provided alternative scenarios to municipal studies regarding the development of residential areas. The alternative scenarios were created by the implementation of environmental zones and identification of overlaps between them and residential areas planned within studies. The research implemented the following environmental zones:
• excluded environmental zones represented by the protected areas (P) as national parks, nature reserves, and 100-meter-long buffer zones from rivers and water reservoirs located in the territory of the landscape parks and protected landscape areas where, in accordance with the Act on Nature Conservation (org. Ustawa o ochronie przyrody), construction of new buildings is prohibited;
• restricted environmental zones represented by good quality soils (S) as reserves for urban agriculture, characterized by soil complex as “very good wheat complex”—the best, mostly black soils, where high yields of demanding plants are achieved (Szewrański et al., 2017) and flood-risk areas (F)—areas with a high probability of flooding occurring every 10 years—Q 10% (Szewrański et al., 2018).
The overlaps, used for alternative scenario building, could be seen as spatial conflicts. Therefore, in alternative scenarios, in case of identification of spatial conflicts, residential areas have been assigned the current land use based on the Corine Land Cover data set (CLC). Taking into account the above assignment, the ECC assessment was conducted for the following scenarios:
• Base scenario—showing the planned land-use determined in the study of each municipality;
• Scenario no. 1 P—showing the planned land use determined in the study of each municipality, excluding protected areas (identified by codes as POO, PSO, POF, PSF (Figure 2) representing the occurrence of given characteristics) and changing overlaps of the planned land use with the environmental zone into current land use determined in CLC2018;
• Scenario No. 2 PS—showing the planned land use determined in the study of each municipality, excluding protected areas together with good-quality soils (identified by codes as POO, OSO, PSO, PSF, OSF) and changing overlaps of planned land use with environmental zones into current land use determined in CLC2018;
• Scenario No. 3 PF—showing the planned land use determined in the study of each municipality, excluding protected areas together with flood-risk areas (identified by codes as POO, OOF, POF, PSF, OSF) and changing overlaps of the planned land use with environmental zones into current land use determined in CLC2018;
• Scenario No. 4 PSF—showing the planned land use determined in the study of each municipality, excluding protected areas together with good-quality soils and flood-risk areas (identified by codes as POO, OSO, OOF, PSO, POF, OSF, PSF) and changing overlaps of the planned land use with environmental zones into current land use determined in CLC2018.
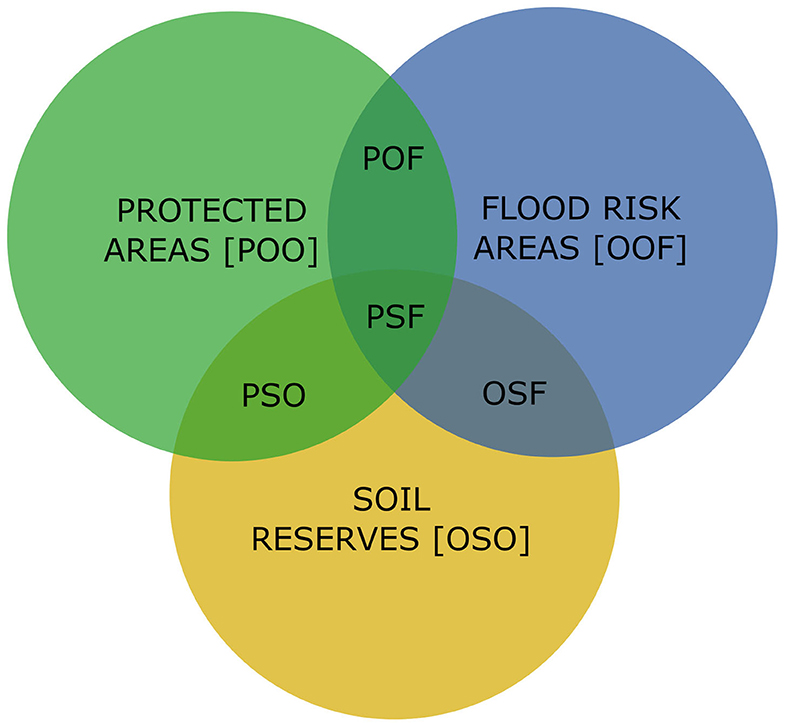
Figure 2. The codes defined for excluded environmental zones represented by protected areas, and restricted environmental zones characterized by good-quality soil reserves for urban agriculture and flood-risk areas.
The alternative scenarios have also, and perhaps most importantly, provided changes related to the reduction of areas designated for human settlements development. The residential areas are the basis for evaluating the potential number of inhabitants (using the surface of residential areas and the population density on these areas—see subchapter 2.2.2.), as well as for CF assessment using consumption characteristics of the residents of the study area (Figure 3).
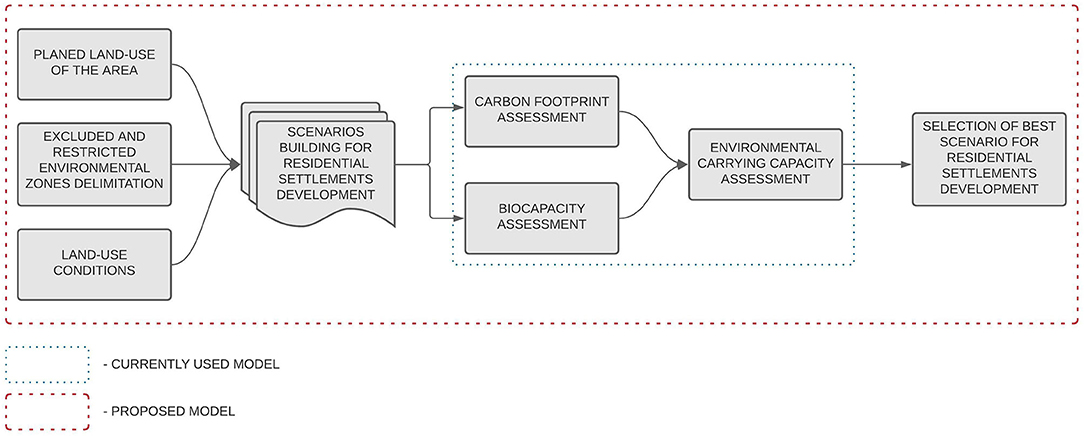
Figure 3. The framework of ECC assessment assuming the delimitation of an excluded environmental zone (represented by protected areas) and restricted environmental zones (represented by good quality soil reserves for urban agriculture and flood-risk areas).
The proposed framework has made it possible to assess spatial policy, in particular with regard to potential human impact on the environment, as well as to propose alternative scenarios for the development of residential areas and choose the scenario with the lowest environmental impact—the lowest ECC. Thus, the presented assessment could be divided into two parts: (1) assessment of CF for the current state using statistic data—as input for CF and ECC assessment of the future residential areas and (2) assessment of CF, BC, and ECC of the future residential areas based on studies and created scenarios.
The CF Assessment—Current State
This research uses the carbon footprint (CF) as input for ECC assessment of the future residential areas defined in studies (Base Scenario) and other alternative scenarios created based on environmental zone implementation. The CF assessment was calculated according to lifestyle archetypes of the city's residents and its suburban zone. The analysis used the consumption characteristics of the residents as the usage of water, electricity, gas, or solid and liquid waste generation.
Thus in this research, the CF was calculated on the basis of the bottom-up approach for categories as CF of food, CF of housing, and CF of mobility (Świąder et al., 2020). Each category of CF had assigned components, as CF of food consumption; CF of sewage/liquid waste generation, CF of garbage/solid waste generation, CF of water use, CF of electricity use, CF of gas supply; CF of car use (Figure 4).
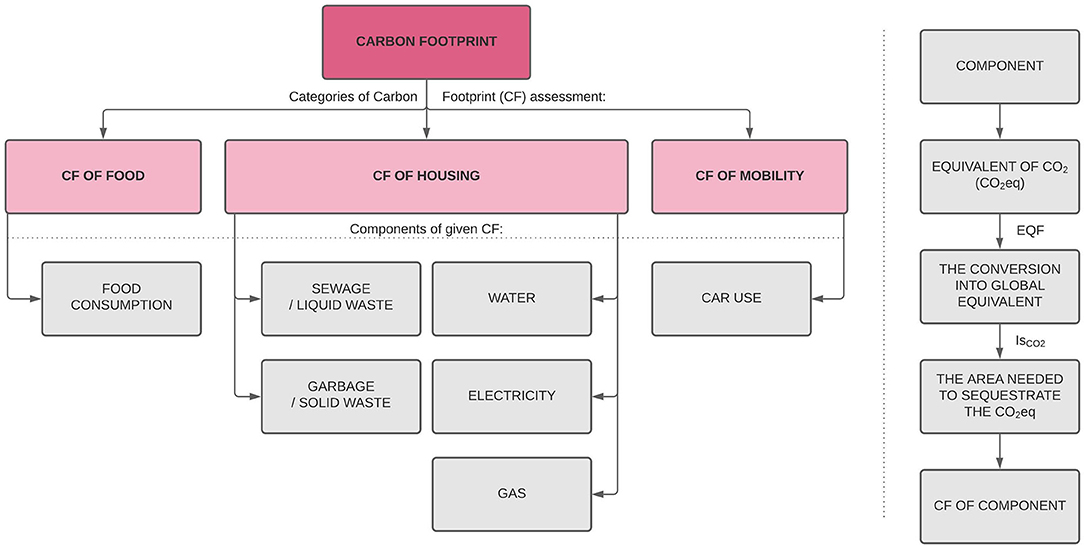
Figure 4. Categories and components for bottom-up CF assessment (Left). The conversion of the given component into CF (Right).
The CF of the given component was assessed based on the number of the population, resource exploitation, or waste generation and recalculated into CO2 or CO2eq (Table 1):
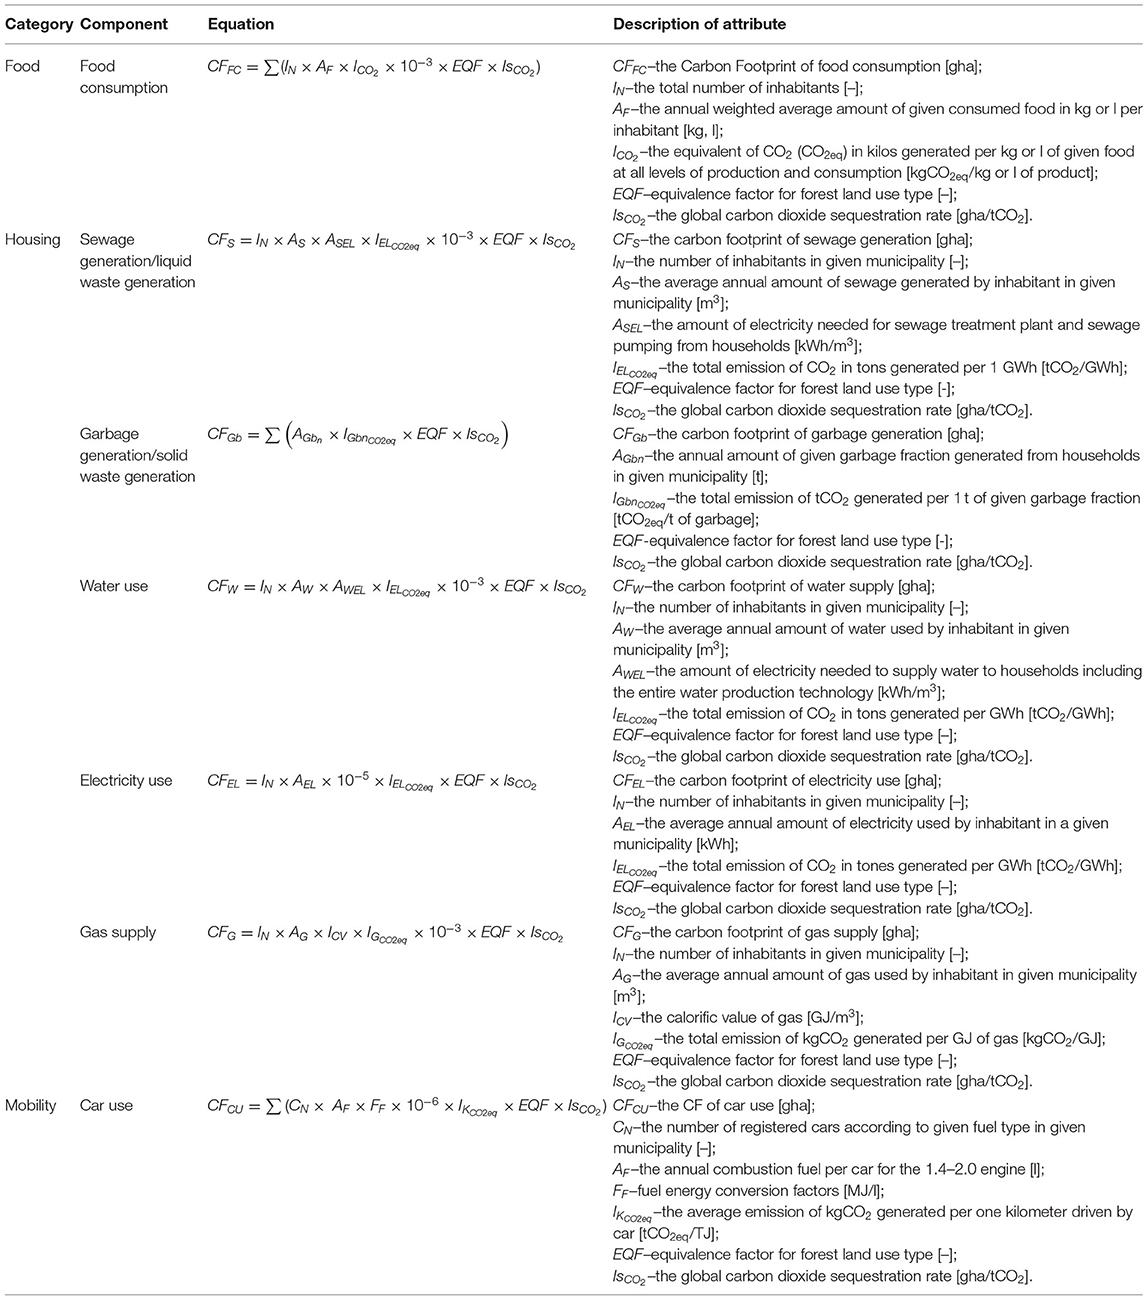
Table 1. Equations for the CF assessment of a given component.
Each value representing the carbon dioxide (CO2) or carbon dioxide equivalent (CO2eq) was converted into the area needed to sequestrate it (Świąder et al., 2020) based on the global carbon dioxide sequestration rate expressed in global hectares per ton of CO2 [gha/tCO2] and Equivalence Factor (EQF). The calculated area represented the CF of a given component. The CF of the given component divided by the number of population represents CF per capita, which was an input for calculation of potential CF of residential areas in different scenarios.
The CF Assessment—Planned Land-Use
Firstly, the assessment of the CF of residential areas required a quantification of population. Therefore, the future number of inhabitants in each scenario was assessed by multiplying the surface of territory designed for housing development and population density at residential areas (average density was calculated using CLC2018—codes No. 111 and 112, and the number of population in 2018). The CFs were assessed as follows:
where:
CFTiSi–CF in total of i-component in i-scenario [gha];
PSi–number of population in i-scenario;
CFi–CF per capita of i-component in i-scenario [gha].
The BC Assessment—Planned Land Use
The BC was calculated according to National Footprint Accounts standards (Lin et al., 2016) for the planned land use defined within studies and developed scenarios. The BC was calculated according to five land-use types (infrastructure, forestland, grazing land, croplands, inland fishing grounds), assigned to them Yield Factors (YF) and Equivalence Factors (EQF), as follows:
where:
BC–the biocapacity [gha];
An–the area of given land use type [ha];
YFn–the yield factor for given land use type [-];
EQFn–the equivalence factor for given land type [-].
The difference between BC and CF allowed for quantification of ECC and definition of the environment state referred to as ecological deficit, ecological reserve, or ecological balance. Moreover, the equation for BC assessment allowed for quantification of the surface of natural areas needed to sustain CF. The surface was quantified for forest land and grazing/green land in hectares including an additional 11% of natural area, which is a minimum required for biodiversity restoration (Świąder et al., 2018b).
Materials
The CF assessment at the local level requires the selection of the baseline year understood as the newest year for which most of the statistical data was available (Moore et al., 2013). Therefore, in this study, the baseline year for evaluating the current CF was 2016. Data used for analysis were obtained from multiple data sources: national database, local government units, scientific articles, or reports (Table 2).
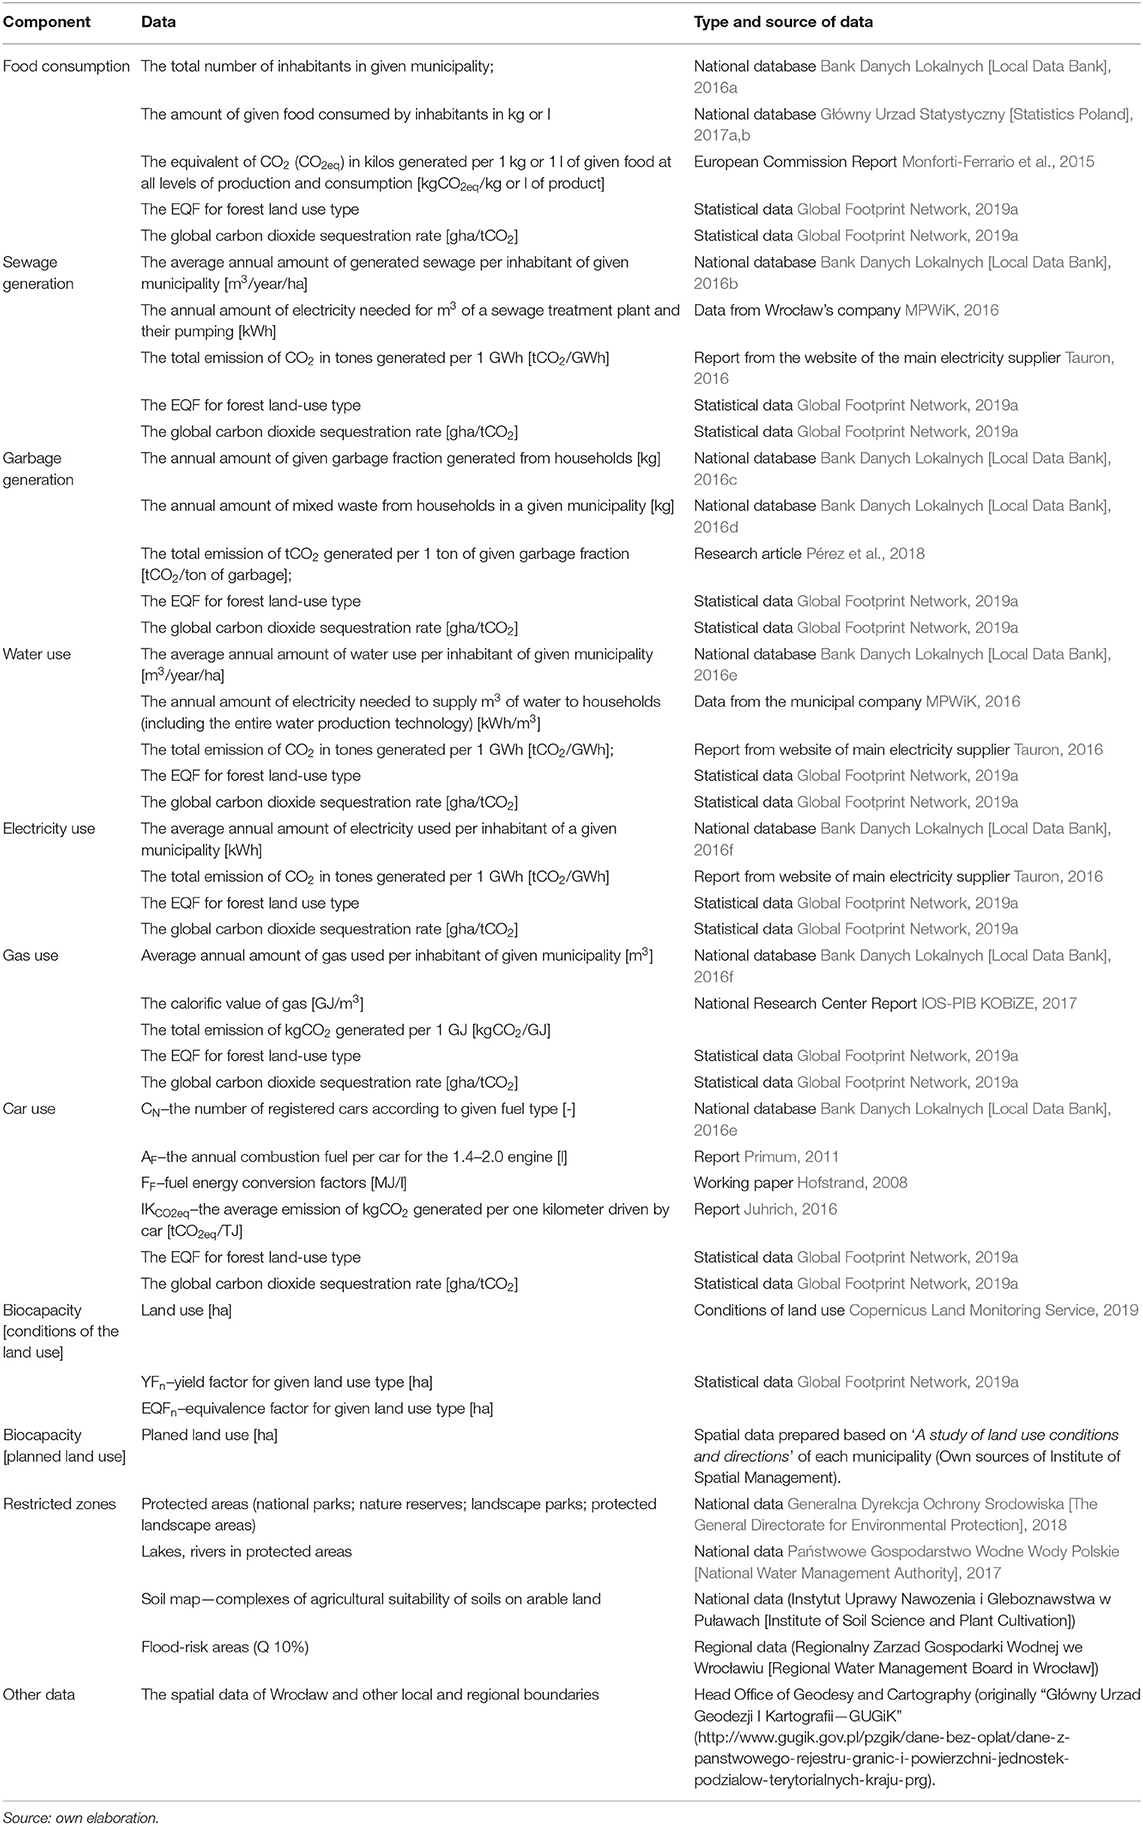
Table 2. Data sources.
Data Preparation
The data obtained from various sources required the verification of their accuracy. The non-spatial data were adjusted to adequate units, assigned to appropriate municipalities, and some assumptions had to be undertaken according to the lack of precise local data.
Therefore, in the case of the food consumption component, two data sets have been used: (I) average monthly consumption of selected foodstuffs per capita in households in Lower Silesia voivodeship region, where all municipalities are located, and (II) average monthly consumption of selected foodstuffs per capita in households by a class of locality (referred after as n-class of locality), as (i) Polish cities larger than 500,000 in the population (as Wrocław), (ii) municipalities lower than 20,000 in the population (as Oborniki Slaskie, Kobierzyce, Zórawina, Czernica, Wisznia Mała, Miekinia, Kostomłoty), and (iii) municipalities larger than 20,000 and lower than 90,000 in the population (as Katy Wrocławskie, Siechnice, Długołeka). Therefore, the weighted average was calculated as follows:
where:
AFi–the annual weighted average amount of a given consumed food in kg (or l) per inhabitant of i-municipality [kg];
WLn–the weight according to the population by n-class of the locality;
AFiLn–the annual average amount of i-food in kg per inhabitants by n-class of the locality;
WV–the weight according to the population of the region (voivodeship);
AFnV–the annual average amount of a given consumed food in kg (or l) per inhabitants of voivodeship;
WLn and WV were estimated as follows:
where:
Ii–the number of inhabitants of i-municipality;
In–the number of inhabitants in all municipalities in Poland assigned to n-class of the locality;
IV–the number of inhabitants of the region (voivodeship).
The data regarding local solid waste generation—garbage generation component—was available only for Wrocław city. In the case of other municipalities, there were regional data used and the following assumption has been adopted:
where:
Ani–the annual amount of waste generation of n-fraction per inhabitants of i-municipality;
Ii–the number of inhabitants of i-municipality;
AnV–the annual amount of waste generation of n-fraction per inhabitants of the region (voivodeship);
IV–the number of inhabitants of the region (voivodeship).
The local data of annual average electricity use per inhabitant were available for Wrocław city, Katy Wrocławskie, Siechnice, and Oborniki Slaskie. Thus, for other municipalities, the average annual for the district (org. powiat)—the unit of territorial self-government and administrative division of the second degree in Poland—was used. The superior unit is the voivodeship, the subordinate unit is the municipality (Kaczmarek, 2016).
According to the car use component, the data on the number of cars by fuel type was available for Wrocław city and districts. Therefore, for municipalities other than Wrocław, the following assumption was used:
where
Cni–the number of cars by n-fuel type for i-municipality;
Ii–the number of inhabitants of i-municipality;
Cndi–the number of cars by n-fuel type for i-district;
Idi–the number of inhabitants of i-district.
The research required also the preparation of spatial data. The dataset representing excluded and restricted environmental zones required some maintenance and processing. Environmental zones were delimitated according to three characteristics: protected areas (together with delimitated 100-meter zones from rivers and lakes located on the landscape parks and protected landscape areas), good-quality soils as reserves for urban agriculture, and flood-risk areas. Each record of a dataset representing protected areas (P), good-quality soil reserves for urban agriculture (S), and flood-risk areas (F) has been assigned a value (P, S, or F). Secondly, datasets have been consolidated and coded (POO; OSO, OOF, PSO; POF, OSF, PSF). The character “O” corresponded to the lack of a given characteristic in the given area.
Moreover, the planned land-use dataset created, based on the study of each municipality, had to be updated by newly established residential areas. Thus, the residential areas indicated in studies were blended with CLC2018—codes No. 111 and 112.
The BC assessment dataset also required preparation. Usually, the BC is quantified for six categories as infrastructure, forestland, grazing land, croplands, inland fishing grounds, and marine fishing grounds. However, there was no land use type defined as “marine fishing ground” in the study area. Moreover, the study focuses on the allocation of land use for human settlements development. Thus, the infrastructure land-use type was divided into infrastructure (residential areas) and infrastructure (other).
CommunityViz—a Tool for Automated Indicator-Based Assessment
The assessment of ECC was supported by the use of the CommunityViz (CV) platform—an extension dedicated to ArcGIS software. The CV allows to create and compare different scenarios of the land use by determined indicators. The indicator-based assessment enables to automate the calculations of indicators (taking into account any topological change of land use or change of parameterized assumption) and visualize obtained values (García Castro et al., 2019). Moreover, the CV user has an opportunity to define equations without using separate software or joining data from additional spreadsheets (Kazak et al., 2019).
Results
Allocation of Land Use for Human Settlements Development
The research evaluated the spatial policy established by the municipalities of the city and its surroundings and presented alternative scenarios of residential area development. The base for ECC assessment was the allocation of land use for human settlements development. Each scenario presents existing residential areas, as well as the possible areas for human settlements development (hereinafter referred to as the “possible future residential areas”). Possible future residential areas have been presented in accordance with the assumptions of the land-use division defined within the studies of each municipality (Base Scenario), as well as alternatively presented in Scenarios No. 1–No. 4. The alternative scenarios were built using excluded and restricted environmental zones to protect productive ecosystems. Alternative land use for residential areas was developed based on verified overlaps between the possible future residential areas (defined in the study of each municipality) and environmental zones. Identified overlaps have been transferred to their previous land use status–land-use conditions.
Moreover, the differences between possible future residential areas (defined in studies) and possible future residential areas (hereinafter referred to as the “differences in planned residential areas”) were presented (Figure 5).
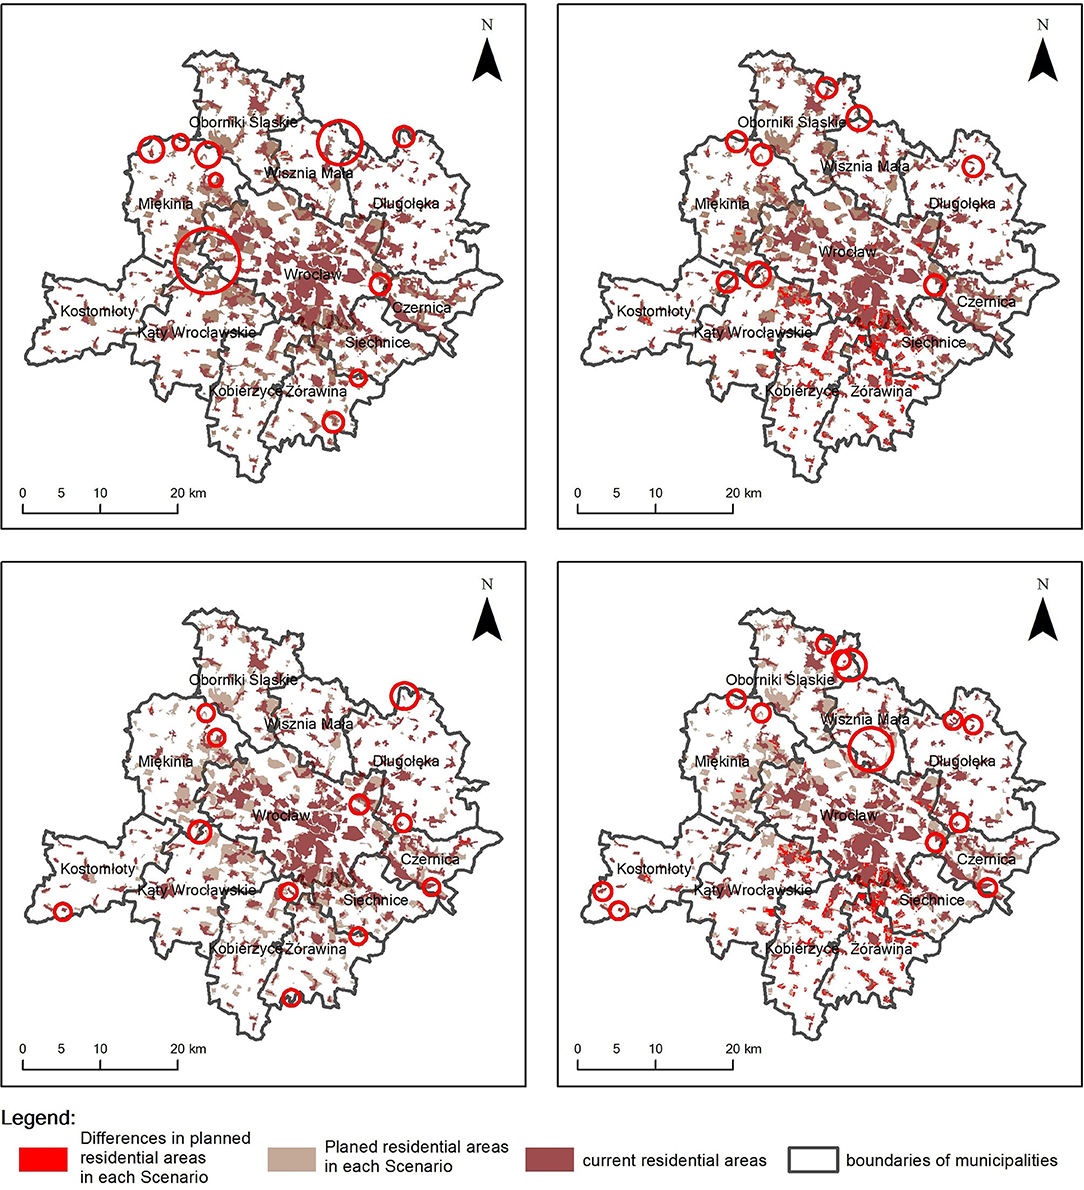
Figure 5. Current residential areas, possible future residential areas, and differences in planned residential areas in each scenario. The red circles show the smallest changes.
In Scenario No. 1, it is noticeable that municipalities such as Czernica, Kobierzyce, and Zórawina have not shown the differences in planned residential areas or the difference was <0.01 ha. In these communes, the excluded zones had the smallest surface. However, it also means that the planned development of residential areas was not included in areas where the forms of nature protection occur. The highest difference in planned residential areas in Scenario No. 1 was quantified for municipality Wisznia Mała—the assessed difference represented 58.4 ha (Figure 6) and a decrease of areas designed for human settlements by 7.5%.
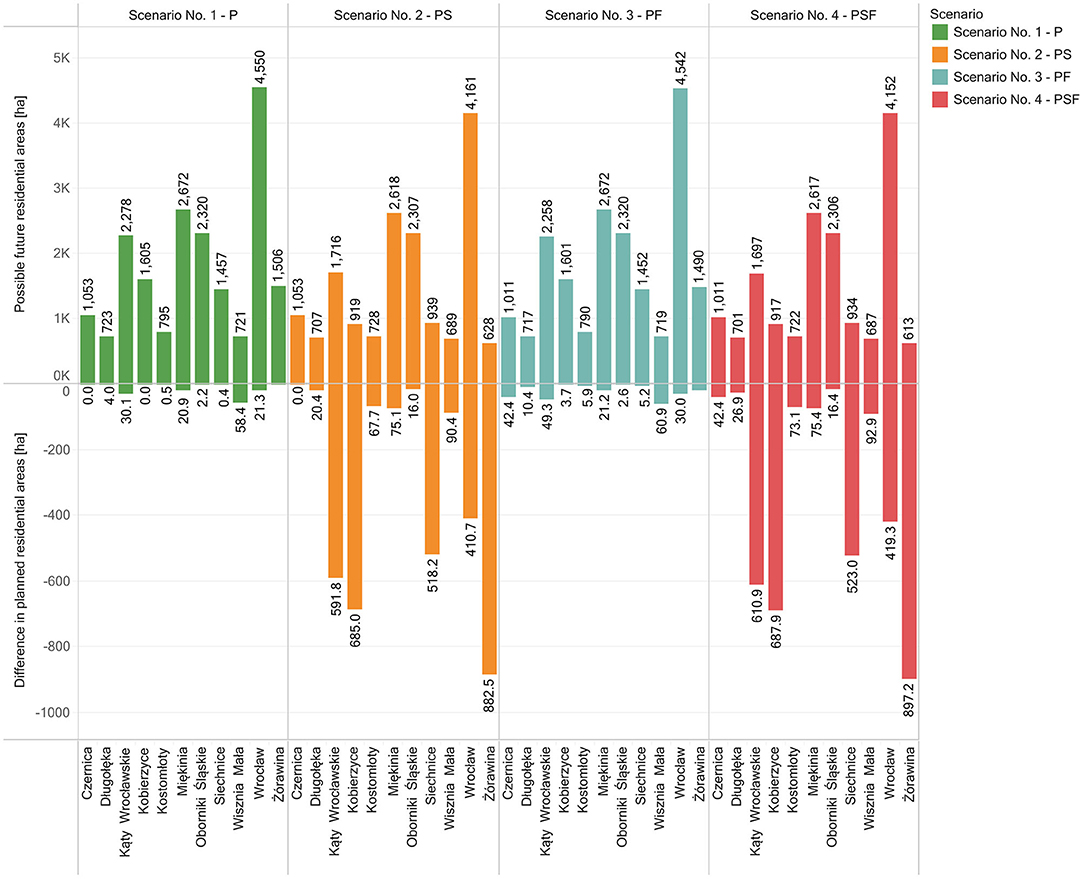
Figure 6. The possible future residential areas and differences in planned residential areas.
The analysis for Scenario 2—PS—did not show any differences in the planned residential areas only for the Czernica municipality, which also has poor-quality soils that could be excluded from the analysis. The highest decrease in areas designed for human settlements was quantified for Zórawina, Katy Wrocławskie, Długołeka, and Siechnice. These municipalities had the most areas with good-quality soils. There could be noticed a decrease in planned residential areas by 58.4% or 882.5 ha for the Zórawina municipality, 42.7% or 685 ha for Katy Wrocławskie, 25.6% or 685 ha for Kobierzyce, and 35.6% or 518.2 ha for Siechnice. This means that new residential areas were planned mainly on good-quality areas than on nature-protected areas or buffers from water bodies located in these areas.
The results obtained for Scenario No. 3—PF—showed the highest decrease in planned residential areas for Wrocław city−60.9 ha, Katy Wrocławskie−49.3 ha, and Czernica−42.4 ha. In the case of the municipality, the decrease of residential areas could be mainly connected with the occurrence of flood-risk areas. The similar designation of flood-risk areas for residential areas was noted for the Katy Wrocławskie municipality. The comparison between Scenario No. 3 and Scenario No. 1 showed that 19.2 ha from 49.3 ha designed for residential areas was overlapping with areas vulnerable to flood. The Wrocław city planned to spend 2.5 ha (from 60.9 ha marked as PF) of flood-risk areas for the development of residential areas. The analysis conducted for Scenario No. 4 indicated the greatest change for Zórawina municipality. The decrease in planned residential areas was quantified as 897.2 ha, which represents the decrease of 59.4% to planned residential areas in Base Scenario. Moreover, this decrease could be associated mainly with the restriction of good-quality soils (882.5 ha from 897.2 ha). The following one with the highest decrease was quantified for the Kobierzyce municipality−687.9 ha—which could be also connected mainly with the presence of good-quality soils (685 ha from 687.9 ha).
The lowest change in Scenario PSF could be observed for Oborniki Slaskie−16.4 ha, Długołeka−26.9 ha, and Czernica−42.4 ha. The decrease in areas designated for housing municipalities of Obornik Slaski and Długołeka resulted mainly from the overlapping of planned housing areas with good-quality soils. In the case of Czernica, the decrease in planned residential areas may be related mainly to the planned location in areas vulnerable to flood.
The CF Assessment—Current State
The total value of CF for Wrocław and its suburban zone was assessed as 3,652,211 gha, whose per capita represents the value of 4.523 gha. The highest impact on the total value of CF (see Supplementary Material) was quantified for electricity use (66.6%), mobility (16.81%), and food (6.4%). The lowest percentage represented such components as gas (3.6%), water (3.18%), sewage (2.16%), and garbage (1.21%).
The CF per capita was largest for Kobierzyce municipality−5.178 gha per capita per year (Figure 7). The following ones were Czernica−5.053 gha—and Długołeka−5.012 gha. The lowest value was quantified for Siechnice municipality−3.136 gha per capita. Similarly, as in the case of an average value of CF for the study area, the highest values were assessed for electricity, mobility, and food consumption components.
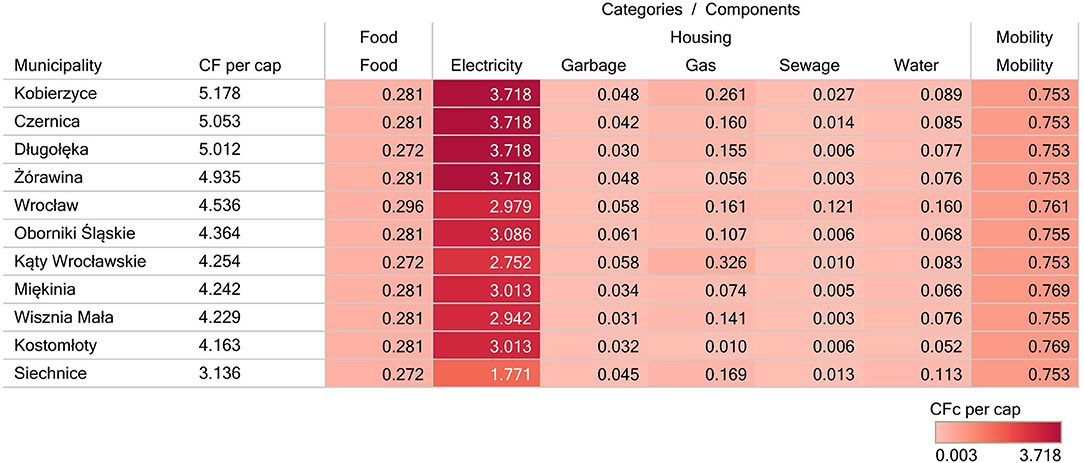
Figure 7. The CF per capita according to categories and components of the bottom-up approach.
The ECC Assessment—Planned Land Use
The CF in total for the current state was assessed as 3,652,211 gha, which could be represented by a circular extent using a radius of 107.8 km. According to the planned land use (Base Scenario), the CF in total was quantified as 6,275,076 gha (radius of 141.4 km), which represents the increase in CF by 72%. This growth of CF could be linked with the possible impact of the increasing number of inhabitants from 807,503 to 1,392,297 and the assumption that the living habits of the population would not change (see Supplementary Material).
The difference between BC and CF showed that an additional 5,858,170 gha would be needed to sustain human impact if the planned studies were fully implemented. This means that there would be needed additional 2,003,657 ha of forest area (more than the area of Lower Silesia voivodeship where Wrocław and its suburban zone is located at 1,994,670 ha) or 6,716,716 ha of grazing/green area (more than the area of three neighboring voivodeships to Lower Silesia−5,322,630 ha in total). If there was surplus included, representing the minimum 11% of the area required for biodiversity restoration, these values would increase to 2,224,059 ha for forest area and 6,716,716 ha for green areas, respectively.
The analyses showed that if the planning assumptions of the study had been fulfilled in 100%, all municipalities would have been considered as ecological debtors (Figure 8). A more detailed analysis showed that the highest increase in CF was noticed for Katy Wrocławskie—the CF increased by 272% compared to the current state. The subsequent ones were Zórawina with 198% growth in CF, Miekinia−176%, Oborniki Slaskie−162%, and Wisznia Mała−127%. There could be observed that Wrocław CF would increase by 55%. Although Wrocław was not recorded as the municipality with the highest CF growth if the planned development would be implemented, it would require the largest physical area to sustain ecological deficit (4 419 060 gha−75% of the total value of the ecological deficit estimated for the study area). This high ecological deficit would be connected with the increase of Wrocław city inhabitants from 637,683 (state as at 31.12.2016) to 987,157 in case of planned land-use implementation. The compensation of quantified ecological deficit would require 1,508,363 ha of forest land, and in case of including an additional 11% for biodiversity restoration−1,674,283 ha (84% of Lower Silesia area). If the human impact were to be compensated by green areas, it would require 4,555,296 ha or 5,056,379 ha if the restoration of biodiversity would be guaranteed. These values correspond to 2.3–2.5 of the area of Lower Silesia voivodeship.
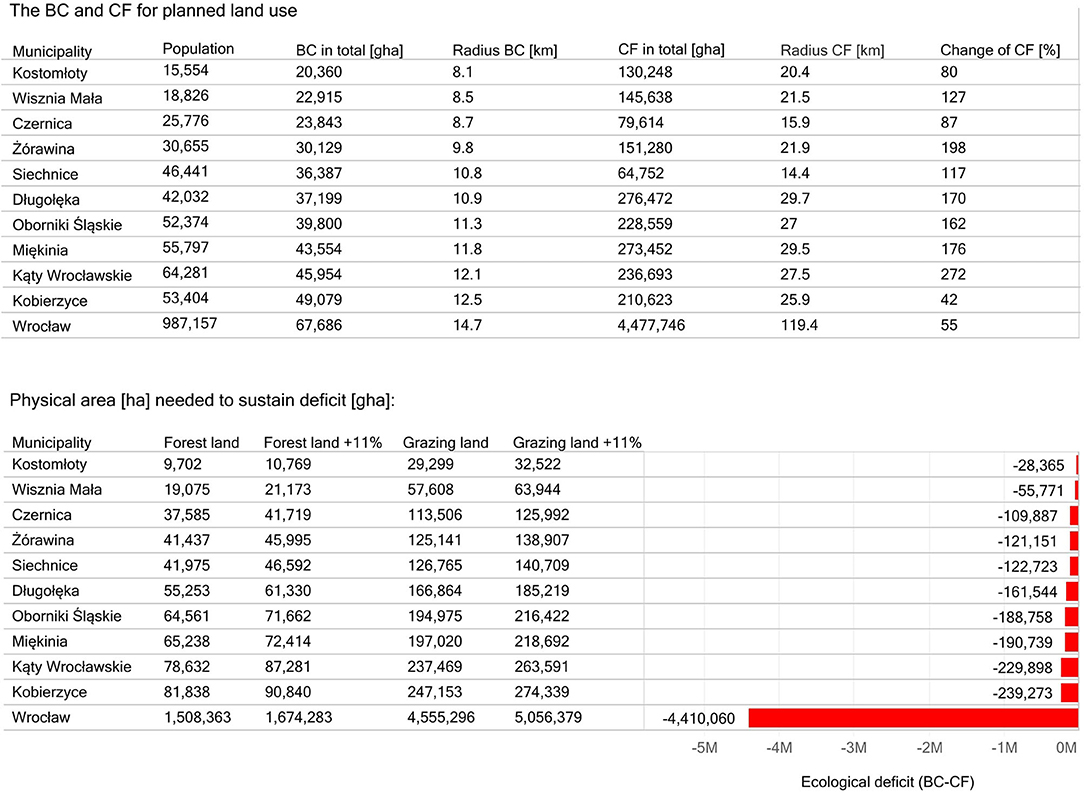
Figure 8. The values and radiuses of CF and BC. The top part of the figure shows also the percentage change of CF (the difference between the current state and Base Scenario). The bottom part of the figure shows the physical area needed to sustain ecological deficit assessed based on planned land use.
The ECC Assessment—Scenarios Differences
The results showed that the highest impact on CF reduction had the implementation of restricted environmental zones represented by good-quality soils as reserves for urban agriculture (S). It could be seen in the results of CF in total obtained for Scenario No. 2—PS and Scenario No. 4—PSF (see Supplementary Material).
The research verified the percentage change in CF and BC values according to the Base Scenario. The highest overall decrease of CF were quantified for Scenarios PS and PSF as −13.31% and −14.39%, respectively. However, there should be indicated that Wrocław city, as well as municipalities (i.e., Kobierzyce or Katy Wrocławskie) where a lot of big companies and investments are located, which definitely deviate from the average assessed for the whole study area.
The analysis quantified that the highest percentage change in the value of CF was noticed for Zórawina municipality—decrease in CF by 62.18% in Scenario No. 4 and 60.55% in Scenario No. 2. The second municipality, where the CF value decreased by environmental zones implementation, was Kobierzyce municipality with a decrease of 34% in CF value in Scenario No. 2 and Scenario No. 4 (Figure 9). The subsequent ones were Siechnice and Katy Wrocławskie municipalities with a reduction of CF by 19–23%—depending on the scenario. What is worth underlining is the fact that even changes < +0.01% in BC had an impact on CF reduction. There was also a noted reduction of BC in created scenarios according to the Base Scenario, as in the case of municipalities of Wrocław, Czerenica, Wisznia Mała, and Oborniki Slaskie.
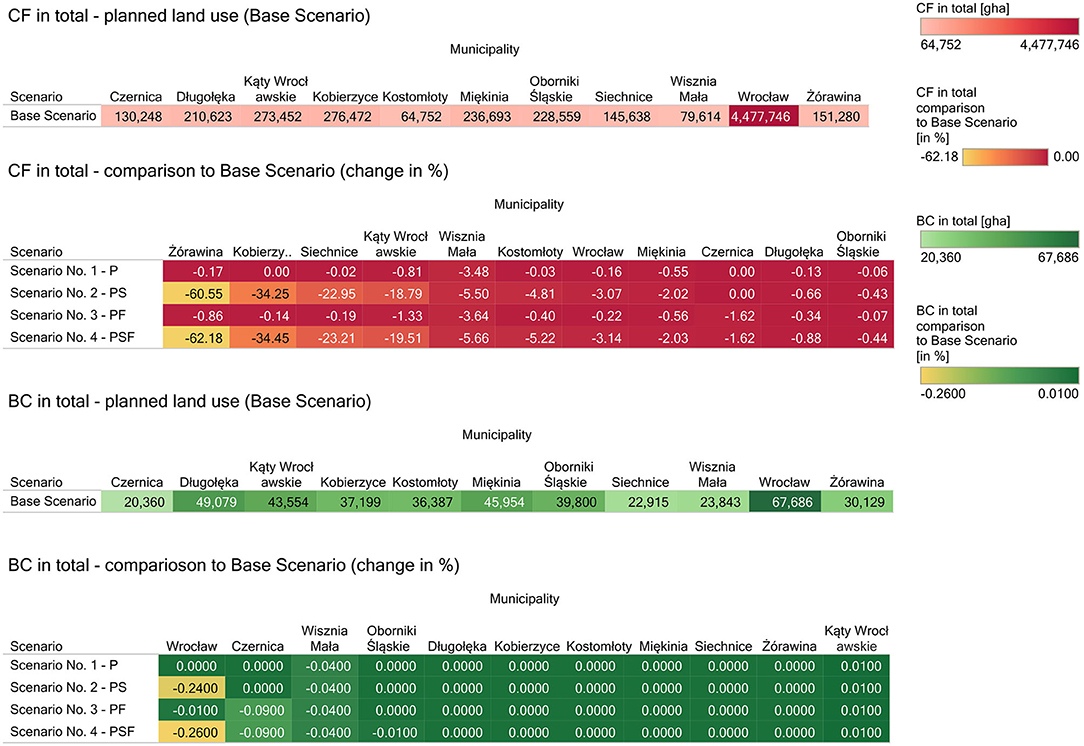
Figure 9. The percentage changes in the values of CF and BC for a given municipality in the given Scenario. The changes lower than ±0.01% were presented in the table as 0.0000.
The total area of forest land for CF assimilation and restoring biodiversity was assessed as 1,998,929 ha for Scenario No. 1, Scenario no. 2–1,885,472 ha, Scenario no. 3–1,995,935 ha, and Scenario no. 4–1,882,535 ha. If forest land was to be assessed separately for Wrocław city and its suburban zone, there should be assured ca. 493,000 ha of forest land for assimilation of CF from municipalities representing the suburban zone of Wrocław (in case of Scenario No. 1). The forest land assessed within other scenarios was quantified as ca. 423,000 ha for Scenario No. 2, ca. 491,000 ha for Scenario No. 3 and ca. 421,000 ha for Scenario No. 4. It means that the physical area needed for sustaining human impact of the suburban zone would represent ca. 25% of the total value quantified for the study area.
The highest total value of forest land needed for sustaining total CF from the human impact was quantified for Wrocław city (Figure 10) as 1,505,989 ha in Scenario No. 1—P (same value as in case of Base Scenario) and 1,505,032 ha for Scenario No. 3—PF. The values quantified for Scenario No. 2—PS and Scenario No. 4—PSF were similar to each other with values circa 1,462,000 ha. The assessed values of forest land needed for sustaining CF of Wrocław would require an area equal to 73–78% of the Lower Silesia region surface. Adding to this area, an additional 11% for biodiversity restoration would represent ca. 90% of the region surface.
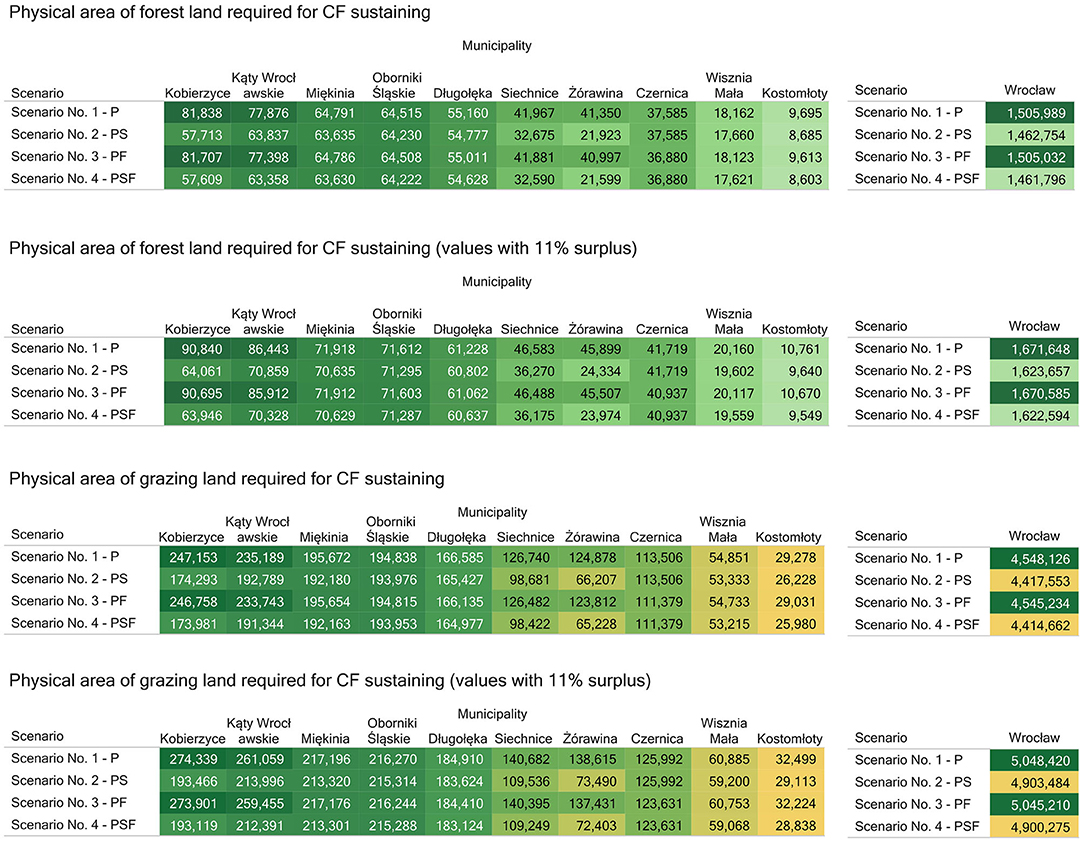
Figure 10. The absolute values of physical natural areas required for sustaining total CF for a given municipality in a given scenario. The lighter colors represent less physical natural areas needed for CF assimilation. The darker color shows more physical natural areas required for CF assimilation.
If the forest land would be recalculated into grazing/green area, there would be needed from 4,414,662 ha (in case of Scenario No. 4—PSF) to 4,548,126 ha (in case of Scenario No. 1—P), which represents 83–85% of the total area of three neighboring voivodeships to Lower Silesia. Except for the Wrocław city, the municipalities as Kobierzyce, Katy Wrocławskie, Miekinia, and Oborniki Slaskie could be verified as the biggest ecological debtors from all municipalities in the suburban zone of Wrocław. However, there could be noticed that the required physical natural area required for CF assimilation for these suburban municipalities is 94% lower (as in the case of Kobierzyce) than for Wrocław city.
Discussion
There is a variety of solutions for human impact reduction, starting from managing and designing cities to be integrated and compact, planning spatial development within the natural capacity to maintain the overall material needs of society, decarbonization of the economy, changes in production, distribution and consumption of food (moving to more local and more plant-based diet), and establishment of smaller families (Rees and Moore, 2013; Wackernagel et al., 2019). To be sustainable, mankind's activity must respect the ecological limitations of planet Earth. The ecological limits assessed with carrying capacity as the benchmark allowed to quantify the human impact and the level that could be sustained by the environment. Its application allows minimizing the risks of unsustainable production and consumption of humanity (Clift et al., 2017). Otherwise, the population would still exceed the capacity of Earth and planetary boundaries. As Clift et al. (2017) indicated, “[w]here governance of the ‘safe operating space’ is absent or ineffective, there is a particular need for metrics and approaches to measurement and allocation that have a chance of achieving acceptance by business and others with the foresight to see that sustaining humankind is dependent on not violating the Planetary Boundaries and is a prerequisite for any future economy” (Clift et al., 2017). The lack of change in human activity raises concerns that further pressure on the earth system may lead to critical destabilization of biophysical systems and thus cause irreversible environmental changes that would be dangerous to human well-being. This problem is significant, especially as the current paradigm of social and economic development remains largely unaware of the possible risk of manmade environmental disasters (Rockström et al., 2009).
Currently, there would be a required 1.69 Earths to sustain the needs of the global population (Global Footprint Network, 2019b). The results quantified for Wrocław city and its suburban zone showed that there would be a required 2.77 of Earths if everybody had the same CF as an average inhabitant of the study area. The quantified number of Earths for Wrocław and its suburban zone was 0.05 higher than that quantified for Poland−2.72. The highest number of Earths needed for sustaining human impact was quantified for Czernica, Długołeka, Kobierzyce, and Zórawina municipalities—value higher than 3.0. The lifestyle of inhabitants of these areas could be similar to the lifestyle of inhabitants in countries as the Russian Federation (3.17 of Earths), Slovenia (3.14), or Ireland (3.14). The number of Earths quantified for the study area could be even greater, especially that the CF represent 60% of EF.
The analysis allowed for the evaluation of spatial policy and designed areas for new human settlements. The results obtained within Base Scenario showed that the highest increase in CF should be expected for Katy Wrocławskie—the CF increased by 272% compared to the current state, Zórawina−198%, Miekinia−176%, Oborniki Slaskie−162%, Wisznia Mała−127%, and Wrocław−55%. The highest CF values for these municipalities are correlated with the planned development of the residential areas designated in the study. For years, the fastest rate of growth of new residential areas has been noticeable there, especially directly at the border with the city of Wroclaw and along the main transport routes (Szewrański et al., 2013). Thus, it can be concluded that the future spatial policy focuses on the development of residential areas in those municipalities where growth patterns have already been observed. If the studies were 100% implemented, it would mean that residential development will develop faster within the suburban zone than within the city boundaries. It also indicates that the phenomenon of urban sprawl would intensify.
The results also showed the biggest decrease in the value of CF in case of alternative land use for residential purposes under Scenario 2—PS and Scenario 4—PSF. The differences in CF in alternative scenarios in each municipality arise from natural conditions and verified spatial conflicts between environmental zones and planned residential areas designed within studies. Therefore, there could be observed that, in the case of Wrocław and its suburban zone, new residential areas were planned in studies mainly on good-quality soils or flood-risk areas.
The analysis also showed some limitations. Reduction of BC in created scenarios was noted according to Base Scenario, as in the case of municipalities of Wrocław, Czerenica, Wisznia Mała, and Oborniki Slaskie. The reduction of BC was noted especially for Scenario No. 2—PS and Scenario No. 4—PSF. Such a result could be explained by the process of data blending. The data preparation for a given scenario based is on the planned land use (defined in studies of land use conditions and directions) and the current land use (from CLC2018). Areas, where housing areas were planned to be built within environmental zones, have been attributed to the current land use with CLC2018. Thus, the validity of data should be assured, which would eliminate the abnormalities in results, as mentioned biocapacity decreasing after blending planned land-use data with current land use from CLC (some investments were already realized even tough were not designed within the study). Therefore, other types of data could be implemented in the environmental modeling and assessment as high-resolution Digital Elevation Models (DEMs), Digital Surface Models (DSMs) or airborne laser scanning (LiDAR) point clouds (Wróżyński et al., 2020).
A few limitations of the approach used to identify potential areas of the future human settlement development, in general, might be identified. One of them could be connected with data availability and accuracy. The research requires data acquisition and preparation, especially spatial data, which are a basis for analysis conducting and scenario building. Some of the data could not be available as spatial data; thus, there would be required data generation (vectorization of data, geodatabase preparation, and topology validation). Spatial data representing land use should be assigned to land-use types defined in NFA, then reassignment into planned land use according to spatial plan, as well as blended according to environmental zones. Therefore, the analysis conducting requires also a high level of skills from an analyst. Moreover, the food consumption, or other data, could represent the average information, available only at the national or regional level. Therefore, the information could not represent the actual lifestyle archetypes of residents living in a given area. Except for food consumption, there could appear a problem with the availability of data regards CO2 emission connected with electricity production. In the case of this research, information was available in the open report available at the website of the main supplier providing electricity in the study area, which could not be available in the case of other cities or suburban zones. Some of the data could not be easily available from municipalities or companies, but as the experience of other cities shows, the good cooperation between municipalities, companies, and researchers could result in well-provided assessment at the local level. Such an example could be a “Greenest City 2020 Action Plan: The Greenest City. A Renewable City” (GCAP) which was created for the city of Vancouver. The goal of the GCAP is the reduction of the footprint of Vancouver's residents created based on the local dataset (City of Vancouver, 2015). The well-modeled scenarios would allow to evaluate current and model future land-use policy (Malek et al., 2018) as well as show the land use under global change (Martinez-Harms et al., 2017). The application of such solutions allows national, regional and local economies to adapt to climate change and protect various sectors of the national economy from the effects of climate change, such as agriculture (Sojka et al., 2019).
This research could be applicable in other suburban zones with the same or different land-use and socio-demographic dynamics. The approach could be changed according to land-use conditions of a given area, i.e., environmental zones may include national parks that were not located in the study area or areas important for a given community. The assumptions undertaken for assessment may also base on the vulnerable areas to natural hazards (i.e., flood-risk areas as in the case of this research) or the other ones, i.e., socially vulnerable areas. Therefore, the proposed approach would allow to add or delete variables in order to reflect local socio-environmental conditions. Furthermore, the approach could be applied also in case of a lack of designated areas for the development of new residential areas according to planning documents. The use of environmental zones in the ECC assessment could be preceded or implemented to appraise the best location for residential development (based on such features as elevation, slopes, the proximity of rivers or protected areas, etc.). The implementation of environmental zones together with the ECC approach would support a more sustainable development of the city (Kazak, 2018). On the one hand, it would allow the allocation of land use for housing purposes by combining the planned allocation of land use in the planning documents with ecological zones, and on the other the quantification of ECC using BC and CF, as well as the surface of natural areas needed for the assimilation of humanity CF. The implementation of environmental carrying capacity together with environmental zones would allow to increase the biodiversity and natural potential of the area, as well as decrease the human impact on the environment. The implementation of environmental zones for spatial management process could also be a base for spatial conflict verification, which could be understood as a designation of new residential areas on areas providing ecosystem services (as good-quality soils, areas of nature protection forms or within their buffer zones) or on areas vulnerable to flood. Such spatial decision could decrease the natural potential of an area and reduce the quality of life of residents.
Data Availability Statement
The data analyzed in this study is subject to the following licenses/restrictions: Some of datasets presented in this study are included in the article/Supplementary Material. Some of the data can be obtained by contacting the authors. Requests to access these datasets should be directed to Małgorzata Świąder, malgorzata.swiader@upwr.edu.pl.
Author Contributions
MŚ: conceptualization, methodology, software, validation, formal analysis, investigation, resources, data curation, writing—original draft, writing—review and editing, visualization, and funding acquisition. SS: resources, writing—review and editing, visualization, and supervision. JK: resources, writing—review and editing, supervision, and funding acquisition. All authors: contributed to the article and approved the submitted version.
Funding
This research received a grant for young researchers from the Faculty of Environmental Engineering and Geodesy of Wrocław University of Environmental and Life Sciences [No. B030/0099/19]. The open-access publication fee was financed under the Leading Research Groups support project from the subsidy increased for the period 2020–2025 in the amount of 2% of the subsidy referred to Art. 387 (3) of the Law of 20 July 2018 on Higher Education and Science, obtained in 2019.
Conflict of Interest
The authors declare that the research was conducted in the absence of any commercial or financial relationships that could be construed as a potential conflict of interest.
Acknowledgments
We would like to thank Global Footprint Network, especially David Lin, for data sharing, all guidelines and previous cooperation which allowed to realize our following research as research provided to Frontiers.
Supplementary Material
The Supplementary Material for this article can be found online at: https://www.frontiersin.org/articles/10.3389/fenvs.2020.579838/full#supplementary-material
References
Baabou, W., Grunewald, N., Ouellet-Plamondon, C., Gressot, M., and Galli, A. (2017). The ecological footprint of mediterranean cities: awareness creation and policy implications. Environ. Sci. Policy 69, 94–104. doi: 10.1016/j.envsci.2016.12.013
Bank Danych Lokalnych [Local Data Bank] (2016a). Ludność [Population]. Available online at: https://bdl.stat.gov.pl/BDL/metadane/grupy/3?back=True# (accessed May 24, 2018)
Bank Danych Lokalnych [Local Data Bank] (2016b). Stan i ochrona środowiska. Oczyszczanie ścieków komunalnych. Scieki oczyszczone w ciagu roku. Odprowadzone na 1 mieszkańca [Condition and environmental protection. Treatment of municipal sewage. Sewage treated during the year. Discharged per capita]. Available online at: https://bdl.stat.gov.pl/BDLS/dane/podgrup/wymiary (accessed December 13, 2019).
Bank Danych Lokalnych [Local Data Bank] (2016c). Stan i ochrona środowiska. Odpady komunalne. Odpady zebrane selektywnie w ciagu roku [Condition and environmental protection. Municipal waste. Wastes collected separately during the year]. Available online at: https://bdl.stat.gov.pl/BDLS/metadane/cechy/2175 (accessed December 13, 2019).
Bank Danych Lokalnych [Local Data Bank] (2016d). Stan i ochrona środowiska. Odpady komunalne. Zmieszane odpady zebrane w ciagu roku z gospodarstw domowych [Condition and environmental protection. Municipal waste. Mixed waste collected during the year from households]. Available online at: https://bdl.stat.gov.pl/BDLS/dane/podgrup/teryt (accessed December 13, 2019).
Bank Danych Lokalnych [Local Data Bank] (2016e). Transport i łaczność. Pojazdy. Pojazdy według rodzajów stosowanego paliwa [Transport and communication. Vehicles. Vehicles by type of fuel used]. Available online at: https://bdl.stat.gov.pl/BDL/dane/podgrup/teryt (accessed March 27, 2019).
Bank Danych Lokalnych [Local Data Bank] (2016f). Zuzycie wody, energii elektrycznej oraz gazu w gospodarstwach domowych [Consumption of water, electricity and gas in households]. Available online at: https://bdl.stat.gov.pl/BDL/dane/podgrup/wymiary (accessed May 24, 2018).
Barredo, I. J., Petrov, L. O., Sagris, V., Lavalle, C., and Genovese, E. (2005). Towards an Integrated Scenario Approach for Spatial Planning and Natural Hazard Mitigation. Ispra: European Communities, DG-JRC.
Budihardjo, S., Hadi, S. P., Sutikno, S., and Purwanto, P. (2013). The ecological footprint analysis for assessing carrying capacity of industrial zone in semarang. J. Hum. Resour. Sustain. Stud. 1, 14–20. doi: 10.4236/jhrss.2013.12003
Caro, D. (2019). Carbon footprint. Encycl. Ecol. 4, 252–257. doi: 10.1016/B978-0-12-409548-9.10752-3
Choi, H., and Lee, G. (2016). Planning Support Systems (PSS) -based spatial plan alternatives and environmental assessment. Sustainability 8:286. doi: 10.3390/su8030286
Cieślak, I. (2019). Spatial conflicts: analyzing a burden created by differing land use. Acta Geogr. Slov. 59, 43–57. doi: 10.3986/AGS.5181
City of Vancouver (2015). Greenest City 2020 Action Plan: The Greenest City. A Renewable City. Part Two: 2015-2020. Vancouver.
Clift, R., Sim, S., King, H., Chenoweth, J. L., Christie, I., Clavreul, J., et al. (2017). The challenges of applying planetary boundaries as a basis for strategic decision-making in companies with global supply chains. Sustainability 9, 1–23. doi: 10.3390/su9020279
Copernicus Land Monitoring Service (2019). Corine Land Cover - CLC 2018. Available online at: https://land.copernicus.eu/pan-european/corine-land-cover/clc2018 (accessed December 13, 2019).
DellaSala, D. A. (2018). Global change. Encycl. Anthr. 2, 347–349. doi: 10.1016/B978-0-12-809665-9.05355-6
Furmankiewicz, M., Potocki, J., and Kazak, J. (2019). Land-use conflicts in the sudetes, Poland. IOP Conf. Ser. Mater. Sci. Eng. 471, 1–10. doi: 10.1088/1757-899X/471/9/092033
Galli, A., Halle, M., and Grunewald, N. (2015a). Physical limits to resource access and utilisation and their economic implications in mediterranean economies. Environ. Sci. Policy 51, 125–136. doi: 10.1016/j.envsci.2015.04.002
Galli, A., Halle, M., and Grunewald, N. (2015b). Physical limits to resource access and utilisation and their economic implications in Mediterranean economies. Environ. Sci. Policy 51, 125–136.
García Castro, D., De Elizagarate Gutierrez, V., Kazak, J., Kaczmarek, I., and Wang, T. (2019). Nuevos desafíos para el perfeccionamiento de los procesos de participación ciudadana en la gestión urbana. Retos para la innovación social [New challenges in the improvement of the citizen participation processes of the urban management. Social innovation challenges]. Cuad. Gestión 20, 41–64. doi: 10.5295/cdg.170751dg
Generalna Dyrekcja Ochrony Srodowiska [The General Directorate for Environmental Protection] (2018). Dostep do danych geoprzestrzennych - Informacja o środowisku [Access to geospatial data - Environmental information]. Available online at: https://www.gdos.gov.pl/dane-i-metadane (accessed December 13, 2019).
Global Footprint Network (2019a). Poland Consumption Land Use Matrix (CLUM) 2016. Oakland, CA: Global Footprint Network.
Global Footprint Network (2019b). Sustainable Development. Human Development Index and Ecological Footprint (2016). Available online at: http://data.footprintnetwork.org/?_ga=2.245264077.972494000.1580173981-105897319.1575079121#/sustainableDevelopment?cn=all&type=earth&yr=2016 (accessed January 27, 2020).
Główny Urzad Statystyczny [Statistics Poland] (2017a). Budzety gospodarstw domowych w 2016 r. [Household budgets in 2016.]. Warszawa [Warsaw] Available online at: Tabl. 47. Przecietne miesieczne spozycie niektórych
Główny Urzad Statystyczny [Statistics Poland] (2017b). Dostawy na rynek krajowy oraz spozycie niektórych artykułów konsumpcyjnych na 1 mieszkańca w 2016 roku [Deliveries to the domestic market and consumption of some consumer goods per capita in 2016]. Available online at: https://stat.gov.pl/obszary-tematyczne/ceny-handel/handel/dostawy-na-rynek-krajowy-oraz-spozycie-niektorych-artykulow-konsumpcyjnych-na-1-mieszkanca-w-2016-roku,9,7.html (accessed May 24, 2018).
Hoekstra, A. Y. (2007). Human Appropriation of Natural Capital: Comparing Ecological Footprint and Water Footprint Analysis. Value of Water Research Report Series No. 23. Enschede, the Netherlands. Available online at: http://waterfootprint.org/media/downloads/Report23-Hoekstra-2007.pdf (accessed June 25, 2018).
Hofstrand, D. (2008). Liquid Fuel Measurements and Conversions. Available online at: www.extension.iastate.edu/agdm (accessed March 22, 2019).
IOS-PIB KOBiZE (2017). Wartości opałowe (WO) i wskazniki emisji CO2 (WE) w roku 2014 do raportowania w ramach Wspólnotowego Systemu Handlu Uprawnieniami do Emisji za rok 2017 [Calorific values (CV) and CO2 emission factors (EF) in 2014 for reporting under the Community Emission. Available online at: http://www.kobize.pl/pl/article/monitorowanie-raportowanie-weryfikacja-emisji/id/318/tabele-wo-i-we
Izakovičová, Z., Miklós, L., and Miklósová, V. (2018). Integrative assessment of land use conflicts. Sustainability 10, 1–30. doi: 10.3390/su10093270
Juhrich, K. (2016). CO2 Emission factors for fossil fuels. Clim. Chang. 28, 45–47. Available online at: https://www.umweltbundesamt.de/sites/default/files/medien/1968/publikationen/co2_emission_factors_for_fossil_fuels_correction.pdf (accessed June 10, 2018).
Jung, C., Kim, C., Kim, S., and Suh, K. (2018). Analysis of environmental carrying capacity with emergy perspective of jeju Island. Sustainability 10, 1–12. doi: 10.3390/su10051681
Kaczmarek, T. (2016). Administrative division of Poland - 25 years of experience during the systemic transformation. EchoGéo 35, 1–17. doi: 10.4000/echogeo.14514
Kazak, J., and Pilawka, T. (2013). Warunki życia a migracje w strefie suburbialnej Wrocławia [Living conditions and migration in suburban area of Wrocław]. J. Agribus. Rural Dev. 4, 71–81
Kazak, J. K. (2018). The use of a decision support system for sustainable urbanization and thermal comfort in adaptation to climate change actions—the case of the wrocław larger urban zone (Poland). Sustainability 10:1083. doi: 10.3390/su10041083
Kazak, J. K., Garcia Castro, D., Swiąder, M., and Szewranski, S. (2019). Decision support system in public transport planning for promoting urban adaptation to climate change. IOP Conf. Ser. Mater. Sci. Eng. 471:112007. doi: 10.1088/1757-899X/471/11/112007
Lin, D., Hanscom, L., Martindill, J., Borucke, M., Cohen, L., Galli, A., et al. (2016). Working Guidebook to the National Footprint Accounts 2016 Edition. Oakland: Global Footprint Network Available online at: http://www.footprintnetwork.org/ (accessed May 18, 2018].
Liu, R. Z., and Borthwick, A. G. L. (2011). Measurement and assessment of carrying capacity of the environment in Ningbo, China. J. Environ. Manage. 92, 2047–2053. doi: 10.1016/j.jenvman.2011.03.033
Malek, Ž., Verburg, P. H. R., Geijzendorffer, I., Bondeau, A., and Cramer, W. (2018). Global change effects on land management in the Mediterranean region. Glob. Environ. Chang. 50, 238–254. doi: 10.1016/j.gloenvcha.2018.04.007
Martinez-Harms, M. J., Bryan, B. A., Figueroa, E., Pliscoff, P., Runting, R. K., and Wilson, K. A. (2017). Scenarios for land use and ecosystem services under global change. Ecosyst. Serv. 25, 56–68. doi: 10.1016/j.ecoser.2017.03.021
Mondino, E. B., Fabrizio, E., and Chiabrando, R. (2014). A GIS tool for the land carrying capacity of large solar plants. Energy Procedia 48, 1576–1585. doi: 10.1016/j.egypro.2014.02.178
Monforti-Ferrario, F., Dallemand, J.-F., Pascua, I. P., Motola, V., Banja, M., Scarlat, N., et al. (2015). Energy Use in the EU Food Sector: State of Play and Opportunities for Improvement, eds F. Monforti-Ferrario and I. Pinedo Pascua Luxembourg. Available online at: http://publications.jrc.ec.europa.eu/repository/bitstream/JRC96121/ldna27247enn.pdf (accessed May 21, 2018).
Moore, J. (2015). Ecological footprints and lifestyle archetypes: exploring dimensions of consumption and the transformation needed to achieve urban sustainability. Sustainability. 7, 4747–4763. doi: 10.3390/su7044747
Moore, J., Kissinger, M., and Rees, W. E. (2013). An urban metabolism and ecological footprint assessment of metro vancouver. J. Environ. Manage. 124, 51–61. doi: 10.1016/j.jenvman.2013.03.009
Moran, D. D., Wackernagel, M., Kitzes, J. A., Goldfinger, S. H., and Boutaud, A. (2008). Measuring sustainable development - nation by nation. Ecol. Econ. 64, 470–474. doi: 10.1016/j.ecolecon.2007.08.017
MPWiK (2016). The electricity use for water and sewage technology from Municipal Water and Sewage Enterprise in Wroclaw (originally Miejskie Przedsiebiorstwo Wodociagów i Kanalizacji S.A. we Wrocławiu – MPWiK).
Oana, P. L., Harutyun, S., Brendan, W., and Convery, S. (2011). Scenarios and indicators supporting urban regional planning. Procedia - Soc. Behav. Sci. 21, 243–252. doi: 10.1016/j.sbspro.2011.07.012
Ohl, B., Wolf, S., and Anderson, W. (2008). A modest proposal: global rationalization of ecological footprint to eliminate ecological debt. Sustainability Sci Pract Policy 4, 5–16. doi: 10.1080/15487733.2008.11908010
Oral, H. V., Carvalho, P., Gajewska, M., Ursino, N., Masi, F., Hullebusch, E. D., et al. (2020). A review of nature-based solutions for urban water management in European circular cities: a critical assessment based on case studies and literature. BlueGreen Syst. 2, 112–136. doi: 10.2166/bgs.2020.932
Özbaş Emine Elmaslar Hunce, S. Y., Özcan, H. K., and Öngen, A. (2019). “Ecological Footprint Calculation,” in Recycling and Reuse Approaches for Better Sustainability, Environmental Science and Engineering, eds. N. Balkaya and S. Guneysu (Cham: Springer International Publishing AG, part of Springer Nature), 179–186. doi: 10.1007/978-3-319-95888-0_15
Państwowe Gospodarstwo Wodne Wody Polskie [National Water Management Authority] (2017). Baza danych przestrzennych aktualizacji planów gospodarowania wodami (aPGW) [Spatial database for updates of water management plans (aPGW)]. Available online at: https://dane.gov.pl/dataset/599,baza-danych-przestrzennych-aktualizacji-planow-gospodarowania-wodami-apgw/resource/672/table (accessed December 13, 2019).
Pérez, J., de Andrés, J. M., Lumbreras, J., and Rodríguez, E. (2018). Evaluating carbon footprint of municipal solid waste treatment : methodological proposal and application to a case study. J. Clean. Prod. 205, 419–431. doi: 10.1016/j.jclepro.2018.09.103
Primum, B. V. (2011). Oszacowanie Bilansu Emisji Gazów Cieplarnianych Dla Obszaru Miasta Poznania [Assessment of the greenhouse gas emission balance for the city of Poznań]. Poznań. Available online at: https://www.poznan.pl/mim/public/wos/attachments.att?co=show&instance=1017&parent=70838&lang=pl&id=183071 (accessed May 24, 2018).
Rees, W. E., and Moore, J. (2013). “Ecological Footprints, Fair Earth-Shares and Urbanization,” in Living Within a Fair Share Ecological Footprint, eds R. Vale and B. Vale (London: Routledge), 3–32.
Rockström, J., Steffen, W., Noone, K., Persson, Å., Chapin, F. S., Lambin, E. F., et al. (2009). A safe operating space for humanity. Nature 461, 472–475. doi: 10.1038/461472a
Santoso, E. B., Erli, H. K. D. M., Aulia, B. U., and Ghozali, A. (2014). Concept of carrying capacity: challenges in spatial planning (case study of East Java Province, Indonesia). Procedia Soc. Behav. Sci. 135, 130–135. doi: 10.1016/j.sbspro.2014.07.336
Sojka, M., Kozłowski, M., Stasik, R., Napierała, M., Kęsicka, B., Wróżyński, R., et al. (2019). Sustainable water management in agriculture -The impact of drainage water management on groundwater table dynamics and subsurface outflow. Sustainability 11:4201. doi: 10.3390/su11154201
Steffen, W., Persson, Å., Deutsch, L., Zalasiewicz, J., Williams, M., Richardson, Katherine, Crumley, C., et al. (2011). The anthropocene: from global change to planetary stewardship. Ambio 40, 739–761. doi: 10.1007/s13280-011-0185-x
Świąder, M. (2018). The implementation of the concept of environmental carrying capacity into spatial management of cities: a review. Manag. Environ. Qual. An Int. J. 29, 1059–1074. doi: 10.1108/MEQ-03-2018-0049
Świąder, M., Lin, D., Szewrański, S., Kazak, J. K., Iha, K., van Hoof, J., et al. (2020). The application of ecological footprint and biocapacity for environmental carrying capacity assessment: a new approach for European cities. Environ. Sci. Policy 105, 56–74. doi: 10.1016/j.envsci.2019.12.010
Świąder, M., Szewrański, S., Kazak, J., van Hoof, J., Lin, D., Wackernagel, M., et al. (2018b). Application of ecological footprint accounting as a part of an integrated assessment of environmental carrying capacity: a case study of the footprint of food of a large city. Resources 7:52. doi: 10.3390/resources7030052
Świąder, M., Szewrański, S., and Kazak, J. K. (2018a). Foodshed as an example of preliminary research for conducting environmental carrying capacity analysis. Sustainability 10:882. doi: 10.3390/su10030882
Sylla, M., Hagemann, N., and Szewrański, S. (2020). Mapping trade-offs and synergies among peri-urban ecosystem services to address spatial policy. Environ. Sci. Policy 112, 79–90. doi: 10.1016/j.envsci.2020.06.002
Sylla, M. (2016). Mapping and assessment of the potential to supply selected ecosystem services at a sub-regional scale. The example of Wroclaw and its surrounding municipalities. Ekon. i Srodowisko 4, 87–98. Available online at: http://ekonomiaisrodowisko.pl/uploads/ei%C5%9B%2059/07_sylla.pdf (accessed June 24, 2020).
Szewrański, S., Kazak, J., Żmuda, R., and Wawer, R. (2017). Indicator-based assessment for soil resource management in the wrocław larger urban zone of Poland. Polish J. Environ. Stud. 26, 2239–2248. doi: 10.15244/pjoes/70178
Szewrański, S., Kazak, J. K., and Sasik, J. (2013). Procesy Suburbanizacyjne I Ich Skutki Srodowiskowe W Strefie Niekontrolowanego Rozprzestrzeniania Sie Duzego Miasta [eng. Suburbanisation Processes and their Environmental Effects in a Zone of Uncontrolled Spread of a Large City]. Pr. Nauk. Uniw. Ekon. we Wrocławiu, 170–179. Available online at: http://yadda.icm.edu.pl/yadda/element/bwmeta1.element.ekon-element-000171371225 (accessed June 24, 2020)
Szewrański, S., Swiąder, M., Kazak, J. K., Tokarczyk-Dorociak, K., and van Hoof, J. (2018). Socio-environmental vulnerability mapping for environmental and flood resilience assessment: the case of ageing and poverty in the city of Wrocław, Poland. Integr. Environ. Assess. Manag. 14, 592–597. doi: 10.1002/ieam.4077
Tauron (2016). Tauron- Raport Zintegrowany 2016 [TAURON, Integrated Report 2016]. Available online at: http://raport2016.tauron.pl/nasze-otoczenie/w-trosce-o-srodowisko-naturalne/ (accessed May 24, 2018)
United Nations (2018). World Urbanization Prospects: The 2018 Revision [key facts]. Available online at: https://esa.un.org/unpd/wup/Publications/Files/WUP2018-KeyFacts.pdf (accessed July 26, 2018).
von Weizsäcker, E. U., and Wijkman, A. (2018). Come On! Capitalism, Short-termism, Population and the Destruction of the Planet. A Report to the Club of Rome. New York, NY: Springer-Verlag. doi: 10.1007/978-1-4939-7419-1
Wackernagel, M., Lin, D., Evans, M., Hanscom, L., and Raven, P. (2019). Defying the footprint oracle: implications of country resource trends. Sustainability 11:2164. doi: 10.3390/su11072164
Wei, Y., Huang, C., Lam, P., Sha, Y., and Feng, Y. (2015). Using urban-carrying capacity as a benchmark for sustainable urban development: an empirical study of Beijing. Sustainability 7, 3244–3268. doi: 10.3390/su7033244
Wróżyński, R., Pyszny, K., and Sojka, M. (2020). Quantitative landscape assessment using LiDAR and rendered 360 panoramic images. Remote Sens. 12:386. doi: 10.3390/rs12030386
Keywords: environmental carrying capacity (ECC), carbon footprint (CF), sustainable resource management, housing development, human impact assessment, decision support systems–DSS
Citation: Świąder M, Szewrański S and Kazak JK (2020) Environmental Carrying Capacity Assessment—the Policy Instrument and Tool for Sustainable Spatial Management. Front. Environ. Sci. 8:579838. doi: 10.3389/fenvs.2020.579838
Received: 03 July 2020; Accepted: 23 September 2020;
Published: 02 November 2020.
Edited by:
Ioan Cristian Ioja, University of Bucharest, RomaniaReviewed by:
Constantina Alina Hossu, University of Bucharest, RomaniaAkbar Rahimi, University of Tabriz, Iran
Copyright © 2020 Świąder, Szewrański and Kazak. This is an open-access article distributed under the terms of the Creative Commons Attribution License (CC BY). The use, distribution or reproduction in other forums is permitted, provided the original author(s) and the copyright owner(s) are credited and that the original publication in this journal is cited, in accordance with accepted academic practice. No use, distribution or reproduction is permitted which does not comply with these terms.
*Correspondence: Małgorzata Świąder, malgorzata.swiader@upwr.edu.pl