Accretion–Erosion Dynamics of the Yellow River Delta and the Relationships with Runoff and Sediment from 1976 to 2018


State Key Laboratory of Resources and Environmental Information System, Institute of Geographic Sciences and Natural Resources Research, Chinese Academy of Sciences, Beijing 100101, China
*
Author to whom correspondence should be addressed.
Water 2020, 12(11), 2992; https://doi.org/10.3390/w12112992
Submission received: 5 October 2020
/
Revised: 21 October 2020
/
Accepted: 23 October 2020
/
Published: 25 October 2020
(This article belongs to the Section Oceans and Coastal Zones)
Abstract
:Timely understanding of the coastal accretion–erosion dynamics of the Yellow River Delta (YRD) can not only deepen the understanding of the evolution of the delta but also provide scientific support for water-sediment regulation (WSR) in the lower reaches of Yellow River and the implementation of a protection strategy for the Yellow River Estuary. In this long-term study, Landsat images from 1976 to 2018 were acquired, and the cloud processing platform of the Google Earth Engine was used for extraction of coastlines. On the basis of these coastlines, the area and accretion–erosion dynamics were analyzed. Then, after statistical analysis of the interannual and intra-annual variations in runoff and sediment, we discuss the relationship between the accretion–erosion dynamics and the annual runoff and sediment. The results show that (1) the coastline of the YRD lengthened first and then shortened, and the average annual growth rate was 1.48 km/a. (2) The land area of the YRD showed a significant accretionary trend before 1996, with an average annual growth rate of 28.60 km2/a. Then, the area gradually decreased from 1997 to 2001. After WSR was implemented in 2002, the accretion–erosion dynamics gradually became smooth, with an annual growth rate of 0.31 km2/a. (3) After WSR, the maximum annual sedimentation decreased by 79.70%. The average annual sediment discharge accounted for only 6.69% from November to March of the following year during the non-flood season. (4) With the continuous decrease in sediment discharge, the determination coefficient (R2) between the cumulative accretion–erosion area of the estuary and the annual sedimentation decreased from 0.98 in 1976–1996 to 0.77 after 2002. Overall, although WSR has maintained a steady increase in delta land area, it cannot change the long-term decrease in the land area of the delta. The insights gained from our study can provide some references for related coastline research, and will be useful to science community and decision makers for coastal environmental monitoring, management, protection, and sustainable development of the YRD.

1. Introduction
River deltas are not only major coastal landforms on our planet but also one of the most important and coveted assets for countries [1,2,3]. Although deltas only account for approximately 5% of the global land surface, they nourish more than half a billion people around the world [4,5]. As the interface between oceans, rivers, and lands, deltas have flat topography, fertile alluvial soils, clean freshwater and seawater, easy waterway transportation, and flora biodiversity in wetlands [1,2,5,6]. Most deltas commonly contain vast underground mineral and organic resources of oil and gas [4], which have important strategic and economic significance for a country [2].
At the same time, deltas depend particularly on sustained runoff and sediment supply, which principally originate from the upstream river basins, to sustain the progradation of the normal delta evolution [2,7]. However, the effects of climate change, especially human activities, are causing deltas to become environmentally vulnerable. Over the past decades, a variety of human activities (e.g., increasing urbanization, construction of dams, dykes and weirs, channelization and channel deviation, agricultural irrigation, soil conservation practices, mining activities, extraction of channel-bed sediments, and regulation of river flow by channeling) [7,8,9,10,11,12,13] have sharply decreased the terrestrial sediment supply to deltas, triggering potentially severe erosion and a reduction in subaerial delta areas [5,13,14,15,16,17,18,19,20,21,22,23,24,25]. This issue has become a global concern and has attracted attention worldwide [6,12]. Therefore, studying the coastal erosion and sediment dynamics of deltas and their response to runoff–sediment fluxes is essential for understanding the evolution and protection of river deltas, which is also the goal of the International Geosphere Biosphere Program (IGBP) [26].
The Yellow River (Huanghe), as one of the largest contributors of global riverine sediment to the oceans, delivers much sediment to its estuary and the surrounding sea annually [5,13,14,27,28]. The modern Yellow River Delta (YRD), which is the youngest land in China, began to form by the accumulation of sediment from the Yellow River in 1855, when the last avulsion of the river channel occurred and the delta returned from the southern Yellow Sea coast (Jiangsu coast) to the Bohai Sea [15,28,29,30,31]. The YRD is rich in land resources, with continuous growth and great development potential. It is the core area of the Yellow River Delta Efficient Ecological Economic Zone and the industrial agglomeration area of the Shandong Peninsula Blue Economic Zone [32]. Meanwhile, the YRD has the most complete wetland ecosystem in China’s warm temperate zone, which is of great importance for biodiversity conservation [33]. Because of the short accumulation time, the muddy coastal landforms of the YRD are very unstable and easily erode [28,29,31]. At the same time, influenced by estuary diversion, upstream inflow, sediment and sea level changes, the coast of the YRD has been changing, which poses great challenges for protection and development [5,34]. A timely understanding of the coastal evolution of the YRD can not only deepen the understanding of the evolution processes and development patterns but also provide scientific and technological support for the high-quality development of the YRD and the implementation of estuarine protection strategies [14,28,29].
Many studies have analyzed the coastal evolution dynamics of the YRD [5,13,28,29,32,35], which mainly include the following aspects. (1) To study the evolution of actual underwater deltas, researchers have mainly analyzed the erosion and sediment dynamics in different spaces by using the measured coastal profile data from different periods [17,29,35,36]. The advantages of this method are that the erosion and sediment data are very accurate, and the distribution and the amount can also be obtained at different spatiotemporal scales. However, the disadvantages are that the workload is large, the monitoring frequency is low, and data collection takes time and expensive. (2) To study the evolution dynamics of deltas on land, the spatiotemporal changes on deltas can be analyzed by using the coastlines derived from the measured data or the data extracted from remote sensing images, which can directly further determine the patterns of increase and decrease in the delta area [13,15,28]. The advantages of this method are that it is a convenient and rapid approach to analyze the annual or interannual variations in erosion and sediment and effectively improve the monitoring frequency. Especially when measured data are lacking, the coastline location can be extracted quickly to grasp the latest evolution of the coast. However, the disadvantage is that this method provides no information about the process or rate of vertical sediment deposition; hence, quantitatively estimating the total amount of sediment deposition in the delta is impossible [4,14,37]. However, because of the close relationship between erosion and deposition of the underwater delta and the changing coastline, the dynamics of the coastline in space can well represent the erosional and sediment depositional processes in the underwater delta. Meanwhile, multisource remote sensing data derived from different sensor platforms have been more easily acquired in recent years and provide a rich data source for timely exploration of the evolution dynamics of the delta. Therefore, monitoring coastal evolution dynamics based on high-frequency remote sensing data in the YRD has become a popular approach and future trend [4,13,15,28,32]. However, how to choose the images at the appropriate periods, and to extract the coastal evolution dynamic accurately are still the focus and difficulty of the related research.
The main difficulty of coastline dynamic monitoring by remote sensing methods is how to accurately extract the coastline. Due to the instantaneity of remote sensing imagery and the influence of tidal dynamics, it is difficult to guarantee the accuracy of coastline extraction results based on a single image, which leads to some uncertainties in the dynamic analysis of coastal evolution [38,39,40,41,42]. To reduce these uncertainties caused by coastline extraction, many studies extract the coastline by using several images for a period of time (e.g., several years), which can reduce the influence of systematic errors in coastline extraction to a certain extent [4,11,14,28]. However, most of these studies focus on a specific time period with a small time span, which makes it difficult to grasp the coastal evolution dynamics systematically. Using only a few periods of imagery is insufficient to understand the coastal evolution processes, and establishing a correlation between the coastal erosion and sediment dynamics and the annual runoff–sediment fluxes is impossible [5,13,32,43,44]. Fortunately, with the freely accessible 30 m resolution Landsat series of sensor images since 1973 and the very large computing capability provided by the Google Earth Engine (GEE) [45], we are in an advanced position to conveniently and efficiently extract long time series of coastlines.
The water-sediment regulation (WSR) scheme in the flood season has been implemented annually since 2002, usually lasting for approximately 20 days from mid-June to early July, and approximately 30–50% of annual water and sediment fluxes is discharged to the sea within a short period, which presents a new changing situation for the spatiotemporal process of runoff–sediment in estuaries [13,15,37]. However, there are relatively few comparative studies on the coastline changes and the influence of runoff–sediment fluxes before and after WSR in the YRD [13,28].
Therefore, the objectives of this study are to: (1) quantify coastline dynamics for determining the YRD land area since 1976 based on the long time series of Landsat Multispectral Scanner (MSS), Thematic Mapper (TM), Enhanced Thematic Mapper (ETM+), and Operational Land Imager (OLI) data within one year after the flood season (October–March of the following year) and the GEE platform; (2) further analyze the coastal erosion and sediment dynamics of the YRD; and (3) intensely explore the contemporaneous relationships between the accretion–erosion dynamics of YRD land and the runoff–sediment fluxes before and after the WSR since 2002. The results of this study can provide a scientific reference for future research on delta-related erosion and sediment evolution.
2. Materials and Methods
2.1. Study Area
The YRD (37°35′–38°12′ N, 118°33′–119°20′ E) is located in the estuary of the Yellow River in northeastern Shandong Province, China, and the northern and eastern regions are adjacent to Bohai Bay and Laizhou Bay (Figure 1). After the end portion of the Yellow River diverted to the Daqing River in 1855, the contemporary YRD area formed, for which Ninghai serves as the apex. Downstream from Ninghai lies an area of approximately 5400 km2 extending from the mouth of the Taoer River in the north to the mouth of the Zhimai River in the south. The apex of diversion was moved down to form the modern YRD with Yuwa as its apex (land area of approximately 2200 km2), which extended from the mouth of the Tiao River in the north to the mouth of the Songchungou River in the south.
Two major artificial diversions of the channel in the YRD were implemented in the past 40 years. For the development of the Shengli Oilfield, the second largest oilfield in China, the first artificial diversion was carried out in May 1976, in which the original northbound Diaokou River was abandoned, and the delta lobe shifted course into the Bohai Sea through the southeastern Qingshuigou River [14,28,30]. To facilitate the offshore to onshore operation of the Xintan and Kendong Oilfields, the second artificial diversion of the main channel was implemented during May to July 1996, in which the delta lobe was diverted northeast to the 8th branch section of the Qingshuigou River (commonly named the “Qing 8 course”), forming the current estuary of the YRD. Since then, the main channel of the YRD has remained essentially unchanged, apart from some minor movements [28,35].
Due to the demands of oil exploitation, wetland protection, port development and storm surge protection, some coastlines of the YRD are mostly artificial and relatively stable; these sections are not significant for the analysis of erosion and sedimentation [13]. Therefore, this study mainly focuses on the open part of the estuary in the YRD, including the northern coast of the Diaokou River, the southeastern coast of the abandoned Qingshuigou River, and the eastern coast of the current Qing 8 course river channel (Figure 1).
2.2. Materials
2.2.1. Remote Sensing Data and Preprocessing
Remote sensing provides an effective means for the study of delta coastline changes [40,42]. At present, many remote sensing data sources can be used, including low- and moderate-resolution data derived from the Moderate Resolution Imaging Spectroradiometer (MODIS) and the Advanced Very High Resolution Radiometer (AVHRR), moderate-resolution data derived from the Landsat series satellites, the Systeme Probatoire d’Observation de la Terre (SPOT), the China–Brazil Earth Resources Satellite (CBERS), and the Sentinel series satellites, and high-resolution data derived from the Chinese GF series satellites. However, Landsat series data are undoubtedly the best data in terms of sensor continuity, image acquisition time span, and image spatial and temporal resolutions [11,13,28,46]. The first Landsat satellite was launched in 1972 and decommissioned in 1978. Landsat 2 was launched in 1975, but the sensor failed in 1976. It was repaired in 1980 and continued to collect data until 1982. Landsat 3 was launched in 1978 and retired in 1983. Landsat 4 was launched in 1982 and retired in 2001 due to the failure of the TM sensor. Landsat 5, the longest-serving satellite, was launched in 1984 and retired in 2013. Landsat 7 was launched in 1999, and the scanning line corrector of the ETM+ sensor failed in 2003, but it continued to collect and transmit data. Landsat 8 was launched in 2013, and Landsat 9 is scheduled to launch in 2021. Since the successful launch of the first Landsat satellite in the 1970s, an image data set with global coverage consisting of high-frequency time series over nearly 50 years has been collected.
In addition, because the Landsat series satellites are designed to have near-polar circular orbits synchronized with the Sun, the mid-latitude region of the Northern Hemisphere is ensured to obtain moderate solar altitude (25°–30°) images in the morning, and the satellites can pass through the same location with the same local time and direction. Based on this basic consistency of the remote sensing observation conditions, the Landsat images are conducive to the study of coastlines [4,11,28,46].
Therefore, the long time series data set of Landsat series satellites was selected as the remote sensing data source to extract the coastlines of the YRD for 43 years. All satellite data with less than 20% cloud cover were acquired from the U.S. Geological Survey (USGS) EarthExplorer website [47]. The remote sensing data included Landsat MSS images with a spatial resolution of 60 m and Landsat TM, Landsat ETM+ and OLI data with a spatial resolution of 30 m. Because the data directly and completely covered the study area, the mosaicking of images was not required in this study. The Path-Row number of Landsat MSS data covering the study area was 130-34, and the remaining Landsat series satellite data were all 121-34. To unify the follow-up research, a total of 4 spectral bands of the existing green, red, near-infrared (NIR) 1 and near-infrared 2 from Landsat 2 and 3 were used, and 6 spectral bands of blue, green, red, near-infrared, shortwave infrared (SWIR) 1, and shortwave infrared 2 from Landsat 4, 5, 7, and 8 were used. In addition, two vegetation index features of the normalized difference vegetation index (NDVI) [48] and normalized difference water index (NDWI) [49] were utilized to distinguish the land vegetation and water–land boundaries (Table 1).
In view of the key impacts of runoff and sediment on coastal accretion–erosion during the flood season, multiphase Landsat images during the non-flood season were selected for extracting the coastlines and constructing the delta area in this study. The selected satellite data were concentrated from November to March of the following year, with a total of 209 scenes (Figure 2). Because the amount of sediment entering the sea during this period accounted for less than one-tenth of the annual amount of sediment of the Yellow River, the impact on coastline changes was relatively small (Section 3.3.2).
The Landsat time series data used in this study were mainly processed in the cloud computing platform of GEE, which contains archived complete Landsat series remote sensing data [50,51]. GEE could also make the complex and long-term sequence coastline extraction process convenient and rapid through relatively simple Python language code. Considering the influence of clouds or cloud shadows, the quality band values of the images were obtained by the C Function of Mask (CFMask) algorithm [52]. The decision tree method was then used to judge and identify the clouds and cloud shadows, and the effective pixel of each image was obtained by removing the cloud and cloud shadow with the masking process. Based on the above procedure, the median value of the corresponding pixels of the preprocessed images in each year was taken as the pixel value of the image for the year, and the data set of time series images in units of years was finally generated.
2.2.2. Runoff and Sediment Data
The Lijin hydrological gauging station is located in the village of Liujiahe, Lijin town, Dongying city, which is approximately 100 km upstream from the mouth of the Yellow River Estuary (YRE) (Figure 1). It is the last hydrological station before the Yellow River enters the Bohai Sea and has been monitoring the daily amounts of runoff and sediment since 1950. Therefore, the daily monitoring runoff and sediment data for the Lijin station from 1976 to 2018 were used in this study. Monthly runoff and sediment data were calculated by accumulating daily runoff and sediment, and the annual runoff and sediment were calculated by accumulating monthly runoff and sediment.
2.3. Methods
The coastline is the boundary between land and ocean and is defined as the boundary line between sea and land at the mean high tide level of the spring tide for multiyear tide [38]. Changes in coastline position are affected by tides, coastal topography, and other factors. The location of the coastline is usually determined by field surveys and extraction of information from remote sensing data [38,40,42]. The first method is relatively accurate, but the heavy workload and difficulty of field work are not conducive to large-scale development. The repeatable acquisition and comprehensive performance of remote sensing images provides timely and extensive spatial data for coastline extraction. The latter approach can mainly be divided into direct and indirect methods [40,42,53,54]. Direct methods include visual interpretation and automatic extraction. Visual interpretation involves directly interpreting remote sensing images based on some coastal features. Automatic interpretation is used to detect the coastline by applying edge detector technology or texture analysis to the images. Then, indirect methods are used to quantitatively obtain the position of the coastline with tidal and terrain corrections based on the instantaneous water boundary line during satellite transit.
The tidal changes in the YRE are complicated and characterized by irregular semidiurnal tides. The maximum tide level in Bohai Bay is 0.7–1.8 m and gradually increases from north to south [31]. The collection time of remote sensing images in the YRD was approximately 10:30 at local time (02:30 UTC). The tidal water level is relatively low at this time, but the tidal level changes greatly from the beginning of the month to the middle and end of the month due to the gravitational attraction of the Moon. For this reason, various methods of coastline extraction have been developed [11,28,42,55], including the mean high tide line, mean tide line, and water–land boundary line [40]. The YRD is located in weak tide continental estuary, and the time for seawater to reach the position of the high tide line is very short; thus, the mean high tide line is difficult for the instantaneous remote sensing images to capture. The instantaneous water–land boundary lines extracted from the images are greatly affected by the tidal water and display complicated changes, which makes it difficult to obtain the true coastline changes by the water–land boundary line method.
Therefore, on the basis of previous studies, the method of the mean tide line is adopted to extract the coastline in this study; that is, the coastline is extracted indirectly through the mutual corrections of the land area of the instantaneous water–land boundary line and the general high tide line [4,40]. Then, based on the obtained coastlines, the land area and the accretion–erosion dynamics of the YRD are analyzed. Finally, the relationship between the accretion–erosion dynamics and the annual runoff and sediment are also discussed. The overall technical route and workflow of this study are showed in Figure 3.
2.3.1. Image Classification Based on the Random Forest Algorithm
Due to the difference in geomorphological characteristics and vegetation development between the high tidal flats and middle-low tidal flats, different spectral features are shown in the remote sensing imagery. High tidal flats are exposed above the water surface most of the time and appear light gray on the false color images. The salt-tolerant vegetation growing on the beach shows a red–reddish–brown tone. In contrast, the middle and low tidal flats are affected by the frequent action of waves, characterized by more tidal erosion gullies and erosion pits, and strongly reflect sunlight; thus, they showed gray to grayish-brown tones. The water bodies and inland areas are easy to distinguish, so they were not troublesome in this study. Therefore, four types of water bodies, middle and low tidal flats, high tidal flats, and land could be classified in this study.
The random forest (RF) algorithm is an integrated learning method with a decision tree as the basic classifier. By extracting multiple samples from the original samples and then modeling the decision tree for each sample, the combination of multiple trees is predicted, and the final prediction results are obtained through voting [56]. The RF algorithm is a nonparametric classification and regression method that does not require prior knowledge and is easy to use. Based on the decision tree classifier and the bagging integrated learning theory, the RF can tolerate certain noise and outliers and parallelize and process high-dimensional data in massive amounts; it also has relatively good accuracy [57].
2.3.2. Extraction of the Coastline Based on the Water–Land Boundary Line and High Tide Line
Due to the large difference between the reflectivities of water and land, a clear water–land boundary shows in the imagery. Thus, the water–land boundary line can be directly extracted between the middle and low tidal flats and water from the image classification results [4,28]. Therefore, the ArcGIS 10.2 software is directly used to extract the instantaneous water–land boundary line through visual interpretation (Figure S1 online).
The general high tide line refers to the average boundary line of the shoreline when the ocean tide is not a super high tide [38]. Generally, the high tide line is located between the high tidal flats and the middle and low tidal flats. Due to the difference in the material composition and exposure time of the tidal flats, the water contents differ. Thus, different spectral characteristic information is shown in the imagery, which is easy to identify. The extraction of the general high tide line follows the same procedure as the above extraction of the instantaneous water–land boundary line [40]; the general high tide line is directly determined simply and easily by combining the classification results and visual interpretation method (Figure S1 online).
When the water–land boundary line and high tide line are obtained, the area between the general high tide line and the instantaneous water–land boundary line is frequently affected by tide water. The average area between these two lines can be approximated as the average area affected by tide water over a long period of time. Then, this average area is added to the area of the general high tide line to modify the general high tide line and obtain the final coastlines.
2.3.3. Calculation of the Accretion–Erosion Dynamics and the Relationships with Runoff and Sediment
When the coastlines are extracted based on the identified water–land boundary line and high tide line, the land area of the YRD is then calculated by according to the extracted coastlines and the inland boundary.
Based on the above areas of the YRD, the evolution characteristics of accretion–erosion from 1976 to 2018 are obtained by spatial superposition and the zonal statistics analysis of the accretion and erosion area in the ArcGIS 10.2 software.
On the basis of studying the evolution of runoff and sediment transport at Lijin station from 1976 to 2018 by using the double cumulative curve, a correlation analysis between the sediment accretion–erosion dynamics and the runoff and sediment is performed to establish the relationship.
3. Results
3.1. Spatiotemporal Dynamics of Coastline Changes from 1976 to 2018
The spatiotemporal dynamic distribution of the coastline (Figure S2 online) shows that the coastline changes were complicated and dramatic under the influences of runoff and sediment discharges and human activities since the Yellow River was diverted to Qingshuigou. To facilitate the analysis, the 43 years from 1976 to 2018 are divided into three periods: 1976–1996, 1997–2001, and 2002–2018. For the first period of 1976–1996, the whole coastline changed extremely dramatically (Figure S2a online). Due to the lack of replenishment by runoff and sediment from the Yellow River, the northern coastline continuously retreated towards the land. In contrast, the estuary area had been advancing towards the sea given the sufficient supply of runoff and sediment. The artificial coastlines gradually became stable after the construction of the Shengli oilfield and Dongying port. For the second period of 1997–2001, the northern coastline continued to retreat towards the land. The Yellow River was diverted to the Qing 8 course in the estuary area, runoff and sediment no longer came to the southeastern coast, and the southeastern coastline continued to move towards the land as the northern coastline did. In contrast, the coastline of the Qing 8 estuary changed dramatically, with accretion first and then a small amount of erosion. The artificial coastlines were basically stable. After 2001, the coastline changes were relatively concentrated in the northern and eastern coastal estuary areas. The northern coastline of the Diaokou River and the southeastern coastline of the abandoned Qingshuigou estuary continued to retreat towards the land. The eastern coastlines continuously advanced towards the northeastern Bohai Sea. The artificial coastlines gradually stabilized under the influence of some aquaculture.
A statistic of the coastline length and its changes in different coastal sections, and different periods was further conducted in this study (Figure 4). The overall length of the YRD coastline showed significant growth before 2013, increasing rapidly from 124.91 km in 1976 to 203.23 km in 2013. Then, the length slightly decreased after 2014 to 186.98 km in 2018. In the past 43 years, the length of the coastline increased more than it decreased, and the average annual growth rate was 1.48 km/a. Although the spatiotemporal changes in the northern coastline were more dramatic, the length changed little based on the range of variation within ±13 km, decreasing first and then increasing. The artificial coastline showed a trend of stable growth, and the length slowly increased from 49.03 km in 1976 to 60.98 km in 2018. The changing dynamics of the estuarine coastline are similar to those of the YRD’s overall coastline. Before 2013, the length mainly increased rapidly, followed by a slow decrease for an average annual growth rate of 1.12 km/a. The lengths of the eastern and southeastern coastlines changed remarkably. The eastern coastline showed a stable growth trend over the 43 years, increasing from 8.68 km in 1976 to 38.64 km in 2018, with an increase of 29.96 km in the past 43 years. The southeastern coastline was affected by runoff and sediment from the Yellow River before 1996 and was advancing towards the sea. Its length continued to increase from 28.22 km in 1976 to 56.16 km in 1996, with an increase of 27.94 km. After 1996, the Yellow River was diverted to the Qing 8 course, the southeastern coastline receded and shrank, and the coastline length gradually decreased to 45.22 km in 2018.
3.2. Dynamics of Accretion–Erosion in the YRD from 1976 to 2018
3.2.1. Dynamics of Accretion–Erosion in the YRD
According to the changes in the area of the YRD in the past 43 years (Figure 5a), the land area of the YRD exhibited significant changes. From 1976 to 1996, the total area showed a trend of rapid growth, with an increase from 2108.31 km2 to 2449.31 km2 at its peak. From 1997 to 2001, the land area gradually decreased to 2392.81 km2 in 2001. After 2002, the overall change in the land area was relatively small, and the area remained stable at approximately 2390.00 km2, except for a small increase in 2012. The land area reached 2387.49 km2 by 2018.
The accretion–erosion dynamics of the YRD subaerial areas were further analyzed (Figure 5b), which showed that the average annual land area change for the past 43 years was approximately 6.65 km2/a. The delta was mainly dominated by sediment before 1996. Especially before 1986, the area of land accretion increased rapidly, with an average annual growth rate of 28.60 km2/a. From 1986 to 1996, the rate of accretion decreased, especially when erosion occurred in 1988–1989 and 1994–1995, and the average annual accretion rate was only 5.50 km2/a. From 1997 to 2001, significant erosion and retreat occurred in the delta, with an average annual erosion rate of 11.30 km2/a. Except for a significant accretion interval in 2011–2012, the accretion rate gradually decreased and became stable, with an average annual accretion rate of only 0.31 km2/a.
3.2.2. Dynamics of the Accretion–Erosion Area in the Yellow River Estuary from 1976 to 2018
From 1976 to 1996, the area of the YRE showed a trend of significant growth (Figure 5c), increasing from 213.62 km2 to 567.49 km2, with a total accreted area of 353.87 km2. During this period, the accretion–erosion changed significantly, and the accretion process was dominated by sedimentation, with an average accretion rate of 17.69 km2/a (Figure 5d).
From 1997 to 2018, the change in the estuarine area was relatively small (Figure 5e), basically in the range of 530.00–570.00 km2. From 1997–2001, the area of the estuary decreased significantly to 523.57 km2 by 2001. The area has been relatively stable since 2002 and remained at 536.92 km2 in 2018. The estuary revealed erosion, with a total eroded area of 31.08 km2. For the accretion–erosion dynamics of the estuary area (Figure 5f), significant erosion occurred from 1997 to 2001, but the erosion area gradually decreased. The accretion–erosion process began to stabilize in 2002. The only relatively obvious accretion took place in 2011–2012, with an accretion area of 11.75 km2. The overall accretion gradually decreased and became stable, with an average annual accretion rate of only 0.67 km2/a.
For the current eastern coast of the Qing 8 estuary (Figure 5g), the land area decreased slightly in 1997–2001 to 174.21 km2 in 2001. The area has gradually increased since 2002 to 241.79 km2 by 2018. The eastern coast generally underwent a process of sedimentation. For the accretion–erosion dynamics of the eastern coastal area (Figure 5h), slight erosion occurred in the Qing 8 estuary from 1997 to 2001, and stable sedimentation continued after 2002. The accretion area decreased from 8.82 km2 in 2001–2002 to 0.68 km2 in 2017–2018.
For the abandoned eastern coast of the Qingshuigou estuary (Figure 5i), due to the lack of replenishment by runoff and sediment from the Yellow River, the land area decreased from 380.67 km2 in 1997 to 295.13 km2 in 2018. Regarding the accretion–erosion dynamics (Figure 5j), the abandoned Qingshuigou estuary exhibited stable erosion over 22 years, with an average erosion rate of approximately 3.93 km2/a.
3.2.3. Dynamics of the Accretion–Erosion Area on the Northern Coast from 1976 to 2018
After the Yellow River was diverted to Qingshuigou route to the sea in 1976, tidal and storm surges were the two main factors affecting the accretion–erosion dynamics of the northern coastal area of the Diaogou River estuary. The area decreased year by year with annual fluctuations (Figure 5k). In the past 43 years, the land area changed from the initial 270.69 km2 to 154.73 km2 in 2018, with a percentage decrease of 42.84%. For the accretion–erosion dynamics of the northern coast (Figure 5l), erosional processes were relatively obvious before 1996, with an average annual erosion rate of approximately 3.96 km2/a. Then, erosion began to diminish in 1997, and the average annual erosion rate decreased to 1.67 km2/a. The overall average annual erosion rate of the northern coastal area was 2.76 km2/a over the past 43 years.
3.3. Variation Characteristics of Runoff and Sediment Supply to the YRD from 1976 to 2018
3.3.1. Interannual Variation Characteristics of Runoff and Sediment
According to the variation trends of the annual runoff and sediment at the Lijin hydrological station (Figure 6), the record can divided into two stages: the 1976–2001 stage before the full operation of the Xiaolangdi reservoir and the 2002–2018 stage with water-sediment regulation (although the regulation was not carried out in 2016 and 2017).
For the annual runoff into the sea (Figure 6a), the overall runoff showed a volatile downward trend from 1976 to 2018, with a rate of decrease of 4.00 × 10⁸ m3/a. The fit curves are:
Formulas (1)–(3) are for the annual runoff at the different time periods. The x and yr are year and annual runoff (108 m3), respectively. During this time, the decreasing trend was obvious from 1976 to 2001, with a rate of decrease of 12.54 × 10⁸ m3/a and an average annual runoff of 214.94 × 10⁸ m3. Then, the runoff showed a volatile increasing trend from 2002 to 2018, with a growth rate of 1.62 × 10⁸ m3/a and an average annual runoff of 174.36 × 10⁸ m3, which reflected significant decreases compared with the earlier stage.
For the annual sediment discharge into the sea (Figure 6b), the overall sediment showed a significant downward trend from 1976 to 2018, with a rate of decrease of 0.21 × 10⁸ t/a. The fit curves are:
Formulas (3)–(6) are for the annual sediment at the different time periods. The x and ys are year and annual sediment (108 t), respectively. During this time, the rate of decrease was 0.31 × 10⁸ t/a, and the average annual sediment was 5.36 × 10⁸ t from 1976 to 2001. Then, the annual sediment rate decreased to 0.07 × 10⁸ t/a, and the average annual sediment was 1.35 × 10⁸ t during the later stage, which reflected significant decreases compared with the earlier stage.
The interannual characteristics of runoff and sediment changed significantly due to the implementation of water-sediment regulation.
The relationship between runoff and sediment was analyzed further (Figure 7) and the fit curves are:
Formulas (7) and (8) are for the annual cumulative sediment and runoff at the different time periods. The xr_c and ys_c are the annual cumulative runoff (108 m3) and sediment (108 t), respectively. The annual cumulative sediment and runoff show a significant positive correlation, but the double cumulative curve has a downward deflection point between 1976 and 2018, which indicates a sudden reduction in sediment. The turning point occurred in 2001–2002, which was mainly due to the final completion of the Xiaolangdi key water-control project and the implementation of WSR by the Xiaolangdi reservoir. An artificial flood peak was formed by massive discharge from the reservoir and increased the erosion of the downstream riverbed. In the meantime, the runoff greatly increased, while the amount of sediment slowly decreased, which caused the double cumulative curve to show a significant clockwise deflection.
3.3.2. Intra-Annual Variation Characteristics of Runoff and Sediment
According to the variation trend of the average monthly runoff and sediment at the Lijin hydrology station (Figure 8), the monthly runoff and sediment in 1976 to 2001 were roughly the same as those in 1976–2018 in terms of intra-annual distribution. The rising point of the flood peak and the sand peak started in June and reached a peak in August. There was a large runoff and sediment throughout the flood season (July–October). After the implementation of water-sediment regulation in 2002, the rising point of the flood peak and the sand peak advanced to May, and the peak time advanced to July. The runoff and sediment decreased significantly. The flood peak decreased from 42.67 × 10⁸ m3 to 31.03 × 10⁸ m3, with a decreasing ratio of 27.29%. The maximum sediment decreased from 1.89 × 10⁸ t to 0.38 × 10⁸ t, with a decreasing ratio of 79.75%. The results indicated that the water-sediment regulation changed the intra-annual distribution of runoff and sediment.
The regulation of water and sediment generally started in late June of each year, leading to the advance of the flood season by one month. In this study, the time of the flood season was from June to October in the year of water-sediment regulation. The average annual runoff and sediment during the flood season decreased from 139.13 × 10⁸ m3 and 4.81 × 10⁸ t in 1976–2001 to 114.36 × 10⁸ m3 and 1.21 × 10⁸ t in 2002–2018, with decreasing ratios of 17.80% and 74.84%, respectively. It showed a significant decreasing trend. In contrast, the annual runoff and sediment during the non-flood season had relatively small changes before and after 2002. Especially in the period from November to March of the following year, the runoff and sediment accounted for only 25.69% and 6.69%, respectively.
The amount of sediment was the main source of land material for sedimentary land reclamation in the YRD. The proportion of sediment entering the sea from November to March of the following year was relatively small, which had little impact on the accretion–erosion process of the delta. Therefore, it is feasible to select Landsat time series imagery during this period to study the accretion–erosion dynamics of the YRD.
3.4. Relationship between the Accretion–Erosion Dynamics and the Runoff and Sediment
Since the Yellow River was diverted to Qingshuigou and thus into the sea in 1976, the main areas directly affected by the water and sediment in the delta have been the YRE and the Qing 8 estuary. Therefore, the relationships between the accretion–erosion dynamics and the runoff and sediment in the YRE and Qing 8 estuaries were directly analyzed in this study.
The relationships between the cumulative annual runoff and sediment and the cumulative accretion–erosion area of the YRE was analyzed (Figure 9a,b), and the fit curves are:
Formulas (9)–(11) are for the cumulative accretion–erosion area and runoff, and the Formulas (12)–(14) are for the cumulative accretion–erosion area and sediment at the different time periods. The xr_c, xs_c, and ya-e are the cumulative annual runoff (108 m3), cumulative annual sediment (108 t), and the cumulative accretion–erosion area (km2) of YRE, respectively. The results show high correlations before 1996, with R2 values of 0.99 and 0.98, respectively. The water and sediment from the Yellow River directly affected the accretion–erosion process of the YRE from 1976–1996. During the period from 1997 to 2001, the water and sediment from the Yellow River decreased sharply and experienced multiple interruptions, which caused severe erosion of the eastern Qing 8 estuary and the abandoned southeastern Qingshuigou estuary. The land accretion area was continuously negative, and the cumulative accretion–erosion area was negatively correlated with runoff and sediment. During the period from 2002 to 2018, the YRE reverted to slow accretion with the regulation of water and sediment. The abandoned Qingshuigou estuary was no longer affected by the water and sediment from the Yellow River after 1996 but was affected by tides in a process of continuous erosion, which reduced the correlation between the cumulative accretion–erosion area of the whole YRE and the cumulative annual runoff and sediment, leading to R2 values of only 0.76 and 0.77, respectively.
Formulas (15)–(17) are for the cumulative accretion–erosion area and runoff, and the Formulas (18)–(20) are for the cumulative accretion–erosion area and sediment at the different time periods. The xr_c, xs_c, and ya-e are the cumulative annual runoff (108 m3), cumulative annual sediment (108 t), and the cumulative accretion–erosion area (km2) of Qing 8 estuary, respectively. The results showed that the cumulative accretion–erosion area had positive correlations with runoff and sediment before 1996, but the correlations were not significant. The main reason was that the runoff and sediment entering the sea from the Qingshuigou estuary directly affected the overall accretion–erosion process in the YRE. The eastern Qing 8 estuary had not yet formed and accounted for only a small part of the YRE, which caused the lack of significant correlations between the accretion–erosion area and the runoff and sediment. In the period from 1997 to 2001, the Yellow River was diverted to the Qing 8 channel and entered the sea. The runoff and sediment were significantly related to the accretion–erosion area. However, the runoff and sediment decreased sharply, and the flow was interrupted frequently, causing significant negative correlations with the accretion–erosion area, yielding R2 values of 0.84 and 0.69, respectively.
The accretion–erosion dynamics of the eastern Qing 8 estuary were significantly correlated with runoff and sediment after the implementation of water-sediment regulation in 2002, with R2 values of 0.98 and 0.97, respectively. The correlations were much higher than that of the whole YRE, which shows that under the premise that the sediment from the Yellow River was the material basis of accretion–erosion, water and sediment processes directly affected accretion–erosion in the eastern Qing 8 estuary.
4. Discussion
4.1. Uncertainty of the Coastline Extraction through Remote Sensing Method
Accurate extraction of the coastlines is of great significance for the study of coastal zones, especially for our study of accretion–erosion evolution in the YRD. Based on the long time series Landsat images and combined with random forest algorithm and manual visual interpretation method, the instantaneous water–land boundary line and general high tide line are extracted on the basis of image classification information, and then, the coastline is extracted through the mutual corrections of the land area of these above two lines in this study.
Compared with other early studies, which select only one image every year [5,13,14,33], our method can effectively reduce the uncertainty of the coastline extraction. Because of the influence of tides, the water boundary line or tide line monitored by remote sensing may be greatly different at each time of the satellite’s revisit period, and the coastline extracted only from one image may have great uncertainty, and result in an unrepresentative result. This finding is similar to many subsequent studies, which select all the high quality images with less cloud and rain each year [2,4,11,28,35,43]. However, due to the effects of runoff, sediment, and tides, the coastlines extracted from satellite images at different times of the year vary greatly, the abundant amount of runoff and sediment in summer affects the accretion–erosion process significantly every year. The shoreline and land area extracted from the images at this moment may be much smaller than that when the runoff and sediment enter the sea in autumn or winter [13,28]. Therefore, this study firstly analyzes the intra-annual variation characteristics of the sediment entering the sea from 1976 to 2018, and concludes that the proportion of sediment from November to March of the following year is less than 10% of the annual sediment, which has relatively little impact on the accretion–erosion process of the delta. Thus, we select high quality Landsat time series imagery during this period to extract the coastlines, which greatly reduces the uncertainties caused by the selection of time series images in the traditional coastline extraction.
In addition, there are also some uncertainties in the spatial resolution of images. Note briefly that the imagery for the 9 years from 1976 to 1984 is derived from the MSS sensors with a resolution of 60 m, and the subsequent TM, ETM+ and OLI data all have a spatial resolution of 30 m. Therefore, the extraction accuracy of the water–land boundary line after 1985 should be slightly higher than that for the imagery from the initial 9 years. However, the central positions of the water and land boundary pixels are used to mark the boundary line, which can control the maximum error of extraction within ±30 m in the actual process of boundary extraction. This error is basically less than 10% in the extensive tidal flat delta and can be ignored in this study [2,4].
Moreover, this study applies a coastline extraction method combining machine learning classification with manual visual interpretation. In the study of automatic coastline extraction, most scholars focus on the using various algorithms to efficiently extract the coastline from the images mutation information, without fully considering the size, texture, shape and other information of the features in the image [4,11]. The coastline, in the final analysis, is a kind of geographical phenomenon. When extracting the coastline, it should not be pursued from the perspective of image processing. The spectral, texture, and geometric shape should be considered comprehensively, and combined with the features of actual land types, tides, and other geographical factors, in order to obtain the coastline more accurately and scientifically [28,40,41]. Thus, the classification method based on the random forest algorithm is studied to extract the classified information of high, middle and low tide rapidly and accurately, which cannot be achieved by direct automatic coastline extraction. Then, combined with expert knowledge and the local geographical factors, a visual interpretation method was used to extract the water–land boundary line and high tide line, which is still one of the most accurate approaches [2,4]. Thus, the coastlines extracted with the above coupling method have a high precision, which can meet the needs of the subsequent research on accretion–erosion in the YRD.
4.2. Influences of Runoff and Sediment on Coastal Accretion–Erosion in Different Periods
The development of the YRD and the evolution of coastal accretion–erosion are influenced by the interactions of water and sediment conditions along the Yellow River and the dynamics of the ocean. The former conditions made the land advance towards the sea, while the latter processes caused retreat towards the land [29,32,35,60]. The YRD has been in a dynamic accretion–erosion situation since the Yellow River was artificially diverted to the Qingshuigou channel. The evolution of coastal accretion–-erosion has obviously been different in different periods. These spatiotemporal variations in accretion–erosion are comprehensively influenced by the water and sediment of the Yellow River, the topography of the estuary, and the dynamic conditions of the ocean.
In the early stage of the Yellow River’s diversion to Qingshuigou from 1976 to 1996, sediment was quickly deposited because of sufficient water and sediment and the wide and shallow estuary area. During this period, because the northern Diaokou River estuary was cut off from water and sediment, marine dynamics became the dominant factor in the evolution of accretion–erosion dynamics. The northern coast experienced obvious erosion and retreat under the action of waves and tidal currents. However, overall accretion was greater than erosion, and the land area grew steadily in the YRD. Therefore, the relationship between the accretion–erosion dynamics and the water and sediment were further analyzed in the estuary area. Significant positive correlations were found between the accretion–erosion area and the runoff and sediment, which marked the main sedimentation stage in the estuarine area during the past 43 years. This conclusion is basically consistent with those of previous studies [4,5,14,28,43].
The water and sediment decreased sharply in the Yellow River from 1996 to 2001. At the same time, the Yellow River was diverted to the northeast to enter the sea by the Qing 8 course, which caused large changes in the estuary morphology, coastal conditions and marine dynamics. With effective soil and water conservation projects (terraced fields, afforestation, grass, and warping dams that blocked sediment), the intensification of industrial and agricultural water and sediment diversion along the Yellow River Basin, especially the beginning of the Grain to Green Program (GTGP) and the operation of the Xiaolangdi project, the downstream river channel shrank, the flow was frequently interrupted, and the sediment was functionally exhausted. The amounts of runoff and sediment entering the sea decreased, and ocean erosion intensified. As a result, coastal erosion exceeded accretion, and the cumulative land area showed a decreasing trend [30,32,43,60]. At the same time, the original southeastern Qingshuigou estuary lost its direct supply of water and sediment, the amount of sediment resuspended through the mouth was limited, the sand mouth extended deep into the sea and was strongly affected by ocean dynamics, and the land area of the southeastern estuary was strongly eroded [28,43,61]. Therefore, the YRE presented more obvious processes of erosion and retreat during this period, which marked the stage of sea advance and land retreat.
Since the Xiaolangdi reservoir began to implement the unified regulation of water and sediment in 2002 and through 2018, the amount of sediment entering the sea has increased compared with the stage of 1996–2001, and the trend of total decrease has been curbed. However, the projects of soil and water conservation and GTGP continued to take effect in the Loess Plateau, which reduced the total amount of sediment entering the channel of the Yellow River from the sources. In addition, the regulation of water and sediment increased the amount of sediment delivered to the sea in a short time by means of water conservancy projects and reservoir dredging, but the sediment in the reservoir inevitably decreased with the passage of time and the increased frequency of WSR [5,13,37]. As a result, the annual amount of sediment entering the sea decreased sharply from the previous 4.00 × 10⁸ t–6.00 × 10⁸ t to 1.00 × 10⁸ t–2.00 × 10⁸ t. The water-sediment situation of the Yellow River began to change from “less water and more sediment” to “more water and less sediment”. The density of water from the estuary into the sea decreased, forming a plume flow and moving on the upper layer of seawater, which became the main routed for sediment entering the sea and sedimentation in the Yellow River [32,35,61]. The sediment transport pattern of the plume flow was affected by runoff and tide more dramatically than that of the previous gravity flow, and the accretion process was more difficult and complicated, resulting in a decrease in the average annual accretion rate of the estuary from 17.69 km2/a before WSR to 0.67 km2/a after 2002. At the same time, the abandoned southeastern Qingshuigou estuary was eroded strongly by waves and tidal currents. Overall, the accretion of the YRE was slightly greater than erosion, and the land area was still slowly increasing, which is basically consistent with the results of previous studies [5,14,28].
In addition to the interannual variations in the amounts of runoff and sediment entering the sea, the uneven distribution of water and sediment within the year affected the accretion–erosion dynamics of the YRD. During the implementation of water-sediment regulation, the runoff and sediment were adjusted from July to October in the previous flood season to June to August, and the amount of sediment generally exceeded 85% of the annual sediment transport. As a result, the accretion time was shortened, and the erosion interval was lengthened. This situation was conducive to the stability of the flow path and reduced accretion in the channel along the Yellow River, but it may be unfavorable for the accretion of the YRD. Through the comparison of results in this paper, the accretion–erosion process after water-sediment regulation is found to be generally lower than that before. This finding is consistent with those of some relevant studies [13,15]: the relatively concentrated time of water and sediment adjustment would change the original water-sediment conditions and increase the land area quickly but lead to erosion in the long run.
4.3. Influences of the Dynamics of the Ocean on Coastal Accretion–Erosion
The marine dynamic is another key factor influencing the evolution of accretion–erosion in the YRD. Our study finds that the determination coefficient R2 between the cumulative accretion–erosion area and the cumulative annual sediment decreased from 0.98 before 1996 to 0.88 during 1996–2001 and then to 0.77 after water-sediment regulation during 2002–2018. To a certain extent, these changes illustrate the constraints of ocean dynamics on delta land accretion. The annual sediment exceeded 4.00 × 10⁸ t before 1996, forming a gravity flow with a density greater than that of seawater, which was easy to deposit. The effects of ocean tides were small, and the land accretion process was significant during this period. In 1996, the Qing 8 course project was implemented, and the distance between the branch outlet and the no-tide point was shortened by 18 km. These conditions were conducive to the formation of a high-speed flow field outside the new river mouth and convenient for sedimentation in a relatively shallow area under the action of tidal forces [4,31,35,60]. However, the reduction in sediment reduced the impact on estuarine sedimentation, resulting in a decrease in the correlation coefficient between the two factors, but the sediment still played a leading role in the process of land construction. After the implementation of water and sediment regulation in 2002, although the sediment load decreased, it was in the form of plume flow into the sea and was affected by other factors, such as tidal power, residual current and bottom flow. These factors hindered the land accretion process, increased the complexity of land sedimentation, and reduced the correlations between the accretion–erosion area and the runoff and sediment [5,13,15,61].
Generally, the YRD could maintain a relatively stable dynamic process of accretion–erosion. However, the amount of sediment entering the Yellow River has been greatly reduced from the source, the sediment in the reservoir area that can be dredged as part of the water-sediment regulation has continued to decrease, and the diversion of water and sediment by industries and agriculture along the river has intensified, all of which cause the amount of sediment entering the sea to continuously decrease in the long run. In addition, the northern coast of the Diaokou River and the abandoned southeastern Qingshuigou estuary continue to erode and retreat under the action of ocean dynamics. As the accretion process in the east Qing 8 estuary continues to decelerate, gradually turns into erosion, and the sea level rises due to global warming, the total land area of the YRD will tend to decrease in the future.
5. Conclusions
Landsat long-term satellite imagery from 1976 to 2018 and the statistical runoff and sediment data for the Yellow River were used as the data sources in this paper. The remote sensing big data cloud processing platform of the Google Earth Engine and the mean tide line method were used to extract the coastlines of the YRD in multiple years. Based on these coastlines, the accretion–erosion dynamics were analyzed. Then, the interannual and intra-annual characteristics of runoff and sediment were also studied. The relationships between the accretion–erosion dynamics and the runoff and sediment under different artificial measures (diversion of the Yellow River and WSR) were explored. The overall conclusions are as follows:
The dynamic coastlines of the YRD generally lengthened first and then shortened. The coastlines were dominated by growth from 1976 to 2013 and then began to decrease slowly, with an average annual growth rate of 1.48 km/a. The range of changes along the northern coastline near the Diaokou River was small, within ±13 km. The artificial coastline generally showed a stable growth trend. The changes in the YRE coastlines were similar to those of the overall YRD coastlines, with an average growth rate of 1.12 km/a.
The erosion–accretion dynamics of the YRD generally showed a pattern of intense accretion, followed by rapid erosion and reduction, and then gradually stabilizing accretion. The YRD experienced rapid sedimentation before 1996, with an average annual growth rate of 28.60 km2/a. Affected by the sharp decrease in the sediment in the Yellow River and the action of marine dynamics, the land area showed a trend of erosion during the period from 1997–2001. After the implementation of water-sediment regulation in 2002, the accretion–erosion processes gradually approached a balance, and the average annual accretion rate decreased to 0.31 km2/a. The accretion–erosion processes were basically similar in the YRE and eastern Qing 8 estuary. The abandoned southeastern Qingshuigou estuary has experienced stable erosion since 1996. The northern Diaohe estuary has generally undergone erosion since the Yellow River was diverted to Qingshuigou in 1976.
The amount of sediment, which affected the evolution of coastal accretion–erosion, showed significant interannual and intra-annual variations. The annual sediment discharge showed a general downward trend during the past 43 years, with a rate of decrease of 0.21 × 10⁸ t/a. Before and after water-sediment regulation, the rates of decrease in annual sediment were 0.31 × 10⁸ t/a and 0.07 × 10⁸ t/a, respectively. In terms of intra-annual variation, the maximum amount of sediment decreased by 79.70%, and the amount of sediment during the flood season decreased by 74.80% after water-sediment regulation. The proportion of sediment during the period from November to March of the following year accounted for only 6.69% of the annual sediment discharge.
The constraints of marine dynamics on the accretion–erosion processes in the YRD were constantly increasing. As the amount of sediment entering the sea continued to decrease, although the water and sediment processes still directly affected the accretion–erosion of the YRE, the influences of other factors, such as tidal power, residual currents and bottom flow fields, increased. The correlation between the accretion–erosion area of the YRE and the cumulative annual sediment discharge continually decrease.
In conclusion, based on the analysis of the temporal differentiation of the runoff and sediment, the suitable months for the study of coastline extraction and accretion–erosion dynamics are obtained in this study. On this basis, a coastline extraction method with relatively high accuracy is proposed in combination with time-series remote sensing images, and corresponding coastline results are obtained. Then, the relationship between the accretion–erosion and the runoff and sediment in different periods of the artificial diversion of the Yellow River is further analyzed. The appropriate time and extraction method of coastline extraction can provide some references for related coastline research. The analysis of the relationship between the accretion–erosion and the runoff and sediment in different stages can be used for better management, protection and sustainable development of the delta coast, and also provide a certain reference for internationally related remote sensing research on delta coast accretion–erosion.
Supplementary Materials
The following are available online at https://www.mdpi.com/2073-4441/12/11/2992/s1, Figure S1: Extraction of the high tide line and water–land boundary line from the remote sensing classification for 2013, Figure S2: Spatiotemporal dynamic distributions of the coastline in the whole YRD (a,d,g), the northern coast (b,e,h) and the Yellow River Estuary (c,f,i) from 1976 to 2018.
Author Contributions
C.H., and H.L. conceived of and designed the experiments. H.L. performed the experiments, analyzed the data, and wrote the paper. C.H., Q.L. and G.L. reviewed the data analysis and the paper. All authors have read and agreed to the published version of the manuscript.
Funding
This research was funded by the the Science and Technology Basic Resources Investigation Program of China, grant number 2017YFD0300403 & 2017FY100706; the National Natural Science Foundation of China, grant number 41890854 & 41801353; and the Strategic Priority Research Program of the Chinese Academy of Sciences, grant number XDA23050101.
Acknowledgments
We thank the Yellow River Water Conservancy Commission of China for permission to access the observed hydrological data, and Chenchen Zhang in our research group for her help in organizing and verifying the daily runoff and sediment data.
Conflicts of Interest
The authors declare no conflict of interest.
References
- Besset, M.; Anthony, E.J.; Bouchette, F. Multi-decadal variations in delta shorelines and their relationship to river sediment supply: An assessment and review. Earth Sci. Rev. 2019, 193, 199–219. [Google Scholar] [CrossRef] [Green Version]
- Kuenzer, C.; Heimhuber, V.; Huth, J.; Dech, S. Remote sensing for the quantification of land surface dynamics in large river delta regions—A review. Remote Sens. Basel. 2019, 11, 1985. [Google Scholar] [CrossRef] [Green Version]
- Murray, N.J.; Phinn, S.R.; DeWitt, M.; Ferrari, R.; Johnston, R.; Lyons, M.B.; Clinton, N.; Thau, D.; Fuller, R.A. The global distribution and trajectory of tidal flats. Nature 2019, 565, 222–225. [Google Scholar] [CrossRef] [PubMed]
- Kuenzer, C.; Ottinger, M.; Liu, G.; Sun, B.; Baumhauer, R.; Dech, S. Earth observation-based coastal zone monitoring of the Yellow River Delta: Dynamics in China’s second largest oil producing region over four decades. Appl. Geogr. 2014, 55, 92–107. [Google Scholar] [CrossRef]
- Wu, X.; Bi, N.; Xu, J.; Nittrouer, J.A.; Yang, Z.; Saito, Y.; Wang, H. Stepwise morphological evolution of the active Yellow River (Huanghe) delta lobe (1976–2013): Dominant roles of riverine discharge and sediment grain size. Geomorphology 2017, 292, 115–127. [Google Scholar] [CrossRef]
- Syvitski, J.P.M. Deltas at risk. Sustain. Sci. 2008, 3, 23–32. [Google Scholar] [CrossRef]
- Anthony, E.J.; Brunier, G.; Besset, M.; Goichot, M.; Dussouillez, P.; Nguyen, V.L. Linking rapid erosion of the Mekong River delta to human activities. Sci. Rep. 2015, 5, 14745. [Google Scholar] [CrossRef] [Green Version]
- Anthony, E.J.; Marriner, N.; Morhange, C. Human influence and the changing geomorphology of Mediterranean deltas and coasts over the last 6000 years: From progradation to destruction phase? Earth Sci. Rev. 2014, 139, 336–361. [Google Scholar] [CrossRef]
- Dada, O.A.; Li, G.; Qiao, L.; Asiwaju-Bello, Y.A.; Anifowose, A.Y.B. Recent Niger Delta shoreline response to Niger River hydrology: Conflict between forces of nature and humans. J. Afr. Earth Sci. 2018, 139, 222–231. [Google Scholar] [CrossRef]
- De Boer, W.; Mao, Y.; Hagenaars, G.; De Vries, S.; Slinger, J.; Vellinga, T. Mapping the sandy beach evolution around seaports at the scale of the African continent. J. Mar. Sci. Eng. 2019, 7, 151. [Google Scholar] [CrossRef] [Green Version]
- Fan, Y.; Chen, S.; Zhao, B.; Pan, S.; Jiang, C.; Ji, H. Shoreline dynamics of the active Yellow River delta since the implementation of Water-Sediment Regulation Scheme: A remote-sensing and statistics-based approach. Estuar. Coast. Shelf Sci. 2018, 200, 406–419. [Google Scholar] [CrossRef]
- Syvitski, J.P.M.; Kettner, A.J.; Overeem, I.; Hutton, E.W.H.; Hannon, M.T.; Brakenridge, G.R.; Day, J.; Vörösmarty, C.; Saito, Y.; Giosan, L.; et al. Sinking deltas due to human activities. Nat. Geosci. 2009, 2, 681–686. [Google Scholar] [CrossRef]
- Zhou, Y.; Huang, H.Q.; Nanson, G.C.; Huang, C.; Liu, G. Progradation of the Yellow (Huanghe) River delta in response to the implementation of a basin-scale water regulation program. Geomorphology 2015, 243, 65–74. [Google Scholar] [CrossRef]
- Kong, D.; Miao, C.; Borthwick, A.G.L.; Duan, Q.; Liu, H.; Sun, Q.; Ye, A.; Di, Z.; Gong, W. Evolution of the Yellow River Delta and its relationship with runoff and sediment load from 1983 to 2011. J. Hydrol. 2015, 520, 157–167. [Google Scholar] [CrossRef] [Green Version]
- Wang, H.; Wu, X.; Bi, N.; Li, S.; Yuan, P.; Wang, A.; Syvitski, J.P.M.; Saito, Y.; Yang, Z.; Liu, S.; et al. Impacts of the dam-orientated water-sediment regulation scheme on the lower reaches and delta of the Yellow River (Huanghe): A review. Glob. Planet. Chang. 2017, 157, 93–113. [Google Scholar] [CrossRef]
- Bergillos, R.J.; Ortega-Sánchez, M. Assessing and mitigating the landscape effects of river damming on the Guadalfeo River delta, southern Spain. Landscape Urban Plan. 2017, 165, 117–129. [Google Scholar] [CrossRef]
- Bergillos, R.J.; López-Ruiz, A.; Ortega-Sánchez, M.; Masselink, G.; Losada, M.A. Implications of delta retreat on wave propagation and longshore sediment transport—Guadalfeo case study (southern Spain). Mar. Geol. 2016, 382, 1–16. [Google Scholar] [CrossRef]
- Bergillos, R.J.; Rodríguez-Delgado, C.; Millares, A.; Ortega-Sánchez, M.; Losada, M.A. Impact of river regulation on a Mediterranean delta: Assessment of managed versus unmanaged scenarios. Water Resour. Res. 2016, 52, 5132–5148. [Google Scholar] [CrossRef]
- Anthony, E.J.; Almar, R.; Aagaard, T. Recent shoreline changes in the Volta River delta, West Africa: The roles of natural processes and human impacts. Afr. J. Aquat. Sci. 2016, 41, 81–87. [Google Scholar] [CrossRef]
- Yang, S.L.; Milliman, J.D.; Li, P.; Xu, K. 50,000 dams later: Erosion of the Yangtze River and its delta. Glob. Planet. Chang. 2011, 75, 14–20. [Google Scholar] [CrossRef]
- Jabaloy-Sánchez, A.; Lobo, F.J.; Azor, A.; Bárcenas, P.; Fernández-Salas, L.M.; Del Río, V.D.; Pérez-Peña, J.V. Human-driven coastline changes in the Adra River deltaic system, southeast Spain. Geomorphology 2010, 119, 9–22. [Google Scholar] [CrossRef]
- Le, T.V.H.; Nguyen, H.N.; Wolanski, E.; Tran, T.C.; Haruyama, S. The combined impact on the flooding in Vietnam’s Mekong River delta of local man-made structures, sea level rise, and dams upstream in the river catchment. Estuar. Coast. Shelf Sci. 2007, 71, 110–116. [Google Scholar] [CrossRef]
- Frihy, O.E.; Debes, E.A.; El Sayed, W.R. Processes reshaping the Nile delta promontories of Egypt: Pre- and post-protection. Geomorphology 2003, 53, 263–279. [Google Scholar] [CrossRef]
- Jiménez, J.; Sánchez-Arcilla, A.; Valdemoro, H.I.; Gracia, V.; Nieto, F. Processes reshaping the Ebro delta. Mar. Geol. 1997, 144, 59–79. [Google Scholar] [CrossRef]
- Pranzini, E. Updrift river mouth migration on cuspate deltas: Two examples ž/ from the coast of Tuscany Italy. Geomorphology 2001, 38, 125–132. [Google Scholar] [CrossRef]
- Syvitski, J.P.M. Impact of humans on the flux of terrestrial sediment to the global coastal Ocean. Science 2005, 308, 376–380. [Google Scholar] [CrossRef]
- Chu, Z. The dramatic changes and anthropogenic causes of erosion and deposition in the lower Yellow (Huanghe) River since 1952. Geomorphology 2014, 216, 171–179. [Google Scholar] [CrossRef]
- Cui, B.L.; Li, X.Y. Coastline change of the Yellow River estuary and its response to the sediment and runoff (1976–2005). Geomorphology 2011, 127, 32–40. [Google Scholar] [CrossRef]
- Liu, Y.; Du, T.; Huang, H.; Liu, Y.; Zhang, Y. Estimation of sediment compaction and its relationship with river channel distributions in the Yellow River delta, China. Catena 2019, 182, 104113. [Google Scholar] [CrossRef]
- Wang, H.; Yang, Z.; Saito, Y.; Liu, J.P.; Sun, X.; Wang, Y. Stepwise decreases of the Huanghe (Yellow River) sediment load (1950–2005): Impacts of climate change and human activities. Glob. Planet. Chang. 2007, 57, 331–354. [Google Scholar] [CrossRef]
- Wang, S.; Hassan, M.A.; Xie, X. Relationship between suspended sediment load, channel geometry and land area increment in the Yellow River Delta. Catena 2006, 65, 302–314. [Google Scholar] [CrossRef]
- Fan, Y.; Chen, S.; Zhao, B.; Yu, S.; Ji, H.; Jiang, C. Monitoring tidal flat dynamics affected by human activities along an eroded coast in the Yellow River Delta, China. Environ. Monit. Assess. 2018, 190, 396. [Google Scholar] [CrossRef] [PubMed]
- Zhu, C.; Zhang, X.; Huang, Q. Four decades of Estuarine Wetland changes in the Yellow River Delta based on Landsat observations between 1973 and 2013. Water 2018, 10, 933. [Google Scholar] [CrossRef] [Green Version]
- Wolters, M.L.; Sun, Z.; Huang, C.; Kuenzer, C. Environmental awareness and vulnerability in the Yellow River Delta: Results based on a comprehensive household survey. Ocean Coast. Manag. 2016, 120, 1–10. [Google Scholar] [CrossRef]
- Peng, J.; Chen, S.; Dong, P. Temporal variation of sediment load in the Yellow River basin, China, and its impacts on the lower reaches and the river delta. CATENA 2010, 83, 135–147. [Google Scholar] [CrossRef]
- Qiao, S.; Shi, X.; Zhu, A.; Liu, Y.; Bi, N.; Fang, X.; Yang, G. Distribution and transport of suspended sediments off the Yellow River (Huanghe) mouth and the nearby Bohai Sea. Estuar. Coast. Shelf Sci. 2010, 86, 337–344. [Google Scholar] [CrossRef]
- Yang, Z.; Yan, Y.; Liu, Q. Assessment of the flow regime alterations in the Lower Yellow River, China. Ecol. Inform. 2012, 10, 56–64. [Google Scholar] [CrossRef]
- Boak, E.H.; Turner, I.L. Shoreline definition and detection: A review. J. Coast. Res. 2005, 214, 688–703. [Google Scholar] [CrossRef] [Green Version]
- Fabris, M. Coastline evolution of the Po River Delta (Italy) by archival multi-temporal digital photogrammetry. Geomat. Nat. Hazards Risk 2019, 10, 1007–1027. [Google Scholar] [CrossRef] [Green Version]
- Gens, R. Remote sensing of coastlines: Detection, extraction and monitoring. Int. J. Remote Sens. 2010, 31, 1819–1836. [Google Scholar] [CrossRef]
- Mikhailova, M.V.; Kravtsova, V.I.; Morozov, V.N. Long-term variations of Danube Delta coastline. Water Resour. 2019, 46, 659–669. [Google Scholar] [CrossRef]
- Toure, S.; Diop, O.; Kpalma, K.; Maiga, A. Shoreline detection using optical remote sensing: A review. ISPRS Int. J. Geo Inf. 2019, 8, 75. [Google Scholar] [CrossRef] [Green Version]
- Bi, N.; Wang, H.; Yang, Z. Recent changes in the erosion–accretion patterns of the active Huanghe (Yellow River) delta lobe caused by human activities. Cont. Shelf Res. 2014, 90, 70–78. [Google Scholar] [CrossRef]
- Liu, F.; Yang, Q.; Chen, S.; Luo, Z.; Yuan, F.; Wang, R. Temporal and spatial variability of sediment flux into the sea from the three largest rivers in China. J. Asian Earth Sci. 2014, 87, 102–115. [Google Scholar] [CrossRef]
- Gorelick, N.; Hancher, M.; Dixon, M.; Ilyushchenko, S.; Thau, D.; Moore, R. Google Earth Engine: Planetary-scale geospatial analysis for everyone. Remote Sens. Environ. 2017, 202, 18–27. [Google Scholar] [CrossRef]
- Nijland, W.; Reshitnyk, L.; Rubidge, E. Satellite remote sensing of canopy-forming kelp on a complex coastline: A novel procedure using the Landsat image archive. Remote Sens. Environ. 2019, 220, 41–50. [Google Scholar] [CrossRef]
- U.S. Geological Survey (USGS) EarthExplorer. Available online: http://earthexplorer.usgs.gov/ (accessed on 23 October 2020).
- Gitelson, A.; Merzlyak, M.N. Quantitative estimation of chlorophyll-a using reflectance spectra: Experiments with autumn chestnut and maple leaves. J. Photochem. Photobiol. B Biol. 1994, 22, 247–252. [Google Scholar] [CrossRef]
- McFeeters, S.K. The use of the Normalized Difference Water Index (NDWI) in the delineation of open water features. Int. J. Remote Sens. 1996, 17, 1425–1432. [Google Scholar] [CrossRef]
- Oliphant, A.J.; Thenkabail, P.S.; Teluguntla, P.; Xiong, J.; Gumma, M.K.; Congalton, R.G.; Yadav, K. Mapping cropland extent of Southeast and Northeast Asia using multi-year time-series Landsat 30-m data using a random forest classifier on the Google Earth Engine Cloud. Int. J. Appl. Earth Obs. Geoinf. 2019, 81, 110–124. [Google Scholar] [CrossRef]
- Tian, F.; Wu, B.; Zeng, H.; Zhang, X.; Xu, J. Efficient identification of corn cultivation area with multitemporal synthetic aperture radar and optical images in the Google Earth Engine Cloud Platform. Remote Sens.-Basel. 2019, 11, 629. [Google Scholar] [CrossRef] [Green Version]
- Foga, S.; Scaramuzza, P.L.; Guo, S.; Zhu, Z.; Dilley, R.D.; Beckmann, T.; Schmidt, G.L.; Dwyer, J.L.; Hughes, M.J.; Laue, B. Cloud detection algorithm comparison and validation for operational Landsat data products. Remote Sens. Environ. 2017, 194, 379–390. [Google Scholar] [CrossRef] [Green Version]
- Viaña-Borja, S.; Ortega-Sánchez, M. Automatic methodology to detect the coastline from Landsat images with a new water index assessed on three different Spanish Mediterranean Deltas. Remote Sens.-Basel. 2019, 11, 2186. [Google Scholar] [CrossRef] [Green Version]
- Voller, V.R.; Swenson, J.B.; Paola, C. The thin blue line: A review of shoreline dynamics across time scales and environments. Earth Surf. Process. Landf. 2019, 45, 96–108. [Google Scholar] [CrossRef] [Green Version]
- Alicandro, M.; Baiocchi, V.; Brigante, R.; Radicioni, F. Automatic shoreline detection from eight-band VHR satellite imagery. J. Mar. Sci. Eng. 2019, 7, 459. [Google Scholar] [CrossRef] [Green Version]
- Breiman, L. Random Forests. Mach. Learn. 2001, 45, 5–32. [Google Scholar] [CrossRef] [Green Version]
- Huang, C.; Zhang, C.; He, Y.; Liu, Q.; Li, H.; Su, F.; Liu, G.; Bridhikitti, A. Land Cover Mapping in Cloud-Prone Tropical Areas Using Sentinel-2 Data: Integrating Spectral Features with Ndvi Temporal Dynamics. Remote Sens. Basel. 2020, 12, 1163. [Google Scholar] [CrossRef] [Green Version]
- Hu, T.; Huang, X.; Li, J.; Zhang, L. A novel co-training approach for urban land cover mapping with unclear Landsat time series imagery. Remote Sens. Environ. 2018, 217, 144–157. [Google Scholar] [CrossRef]
- Zhong, L.; Hu, L.; Zhou, H. Deep learning based multi-temporal crop classification. Remote Sens. Environ. 2019, 221, 430–443. [Google Scholar] [CrossRef]
- Xu, J. Response of land accretion of the Yellow River delta to global climate change and human activity. Quat. Int. 2008, 186, 4–11. [Google Scholar] [CrossRef]
- Gao, W.; Li, G.; Wang, X.; Sun, T.; Liu, Y.; Cao, L. Sedimentary characteristics of the hyperpycnal flow in the modem Yellow River Delta. Indian J. Geo Mar. Sci. 2014, 43, 1438–1448. [Google Scholar]
Figure 1.
Location of the Yellow River and its basin (a), the Yellow River Delta in Shandong Province, China (b), and the study area (c). The background of (c) is a standard false color image of Landsat 8 Operational Land Imager (OLI) taken on 19 October 2018. Coordinates in Universal Transverse Mercator projection (UTM), Zone 50 North, WGS84.

Figure 2.
Available numbers of temporal Landsat time series images used in this study.

Figure 3.
Workflow of coastal accretion–erosion dynamics and the relationship with runoff and sediment based on Landsat time series and runoff and sediment data in this study. GEE: Google Earth Engine.
Figure 3.
Workflow of coastal accretion–erosion dynamics and the relationship with runoff and sediment based on Landsat time series and runoff and sediment data in this study. GEE: Google Earth Engine.

Figure 4.
Changes in the coastline length of the Yellow River Delta from 1976 to 2018.

Figure 5.
Changes in the land area and accretion–erosion area of the Yellow River Delta (YRD), Yellow River Estuary (YRE), abandoned Qingshuigou estuary, and the northern coast during the different periods. (a,b) for the YRD from 1976 to 2018; (c,d) for the Yellow River Estuary during the period of the Qingshuigou course from 1976 to 1996; (e,f), (g,h), and (i,j) for the Yellow River Estuary, Qing 8 estuary, and abandoned Qingshuigou estuary during the period of the Qing 8 course from 1997 to 2018, respectively; (k,l) for the northern coast from 1976 to 2018.

Figure 6.
Variations in annual runoff (a) and sediment discharge (b) at the Lijin station during 1976–2018.
Figure 6.
Variations in annual runoff (a) and sediment discharge (b) at the Lijin station during 1976–2018.

Figure 7.
The relationship between the cumulative annual sediment discharge and runoff before and after water-sediment regulation.
Figure 7.
The relationship between the cumulative annual sediment discharge and runoff before and after water-sediment regulation.

Figure 8.
Monthly average runoff (a) and sediment (b) at the Linjin hydrometric station from 1976 to 2018.
Figure 8.
Monthly average runoff (a) and sediment (b) at the Linjin hydrometric station from 1976 to 2018.

Figure 9.
Relationship between the cumulative accretion–erosion area of the estuary and the cumulative annual runoff and sediment from 1976 to 2018. (a) for the Yellow River Estuary and the cumulative annual runoff; (b) for the Yellow River Estuary and the cumulative annual sediment; (c) for the Qing 8 estuary and the cumulative annual runoff; (d) for the Qing 8 estuary and the cumulative annual sediment.


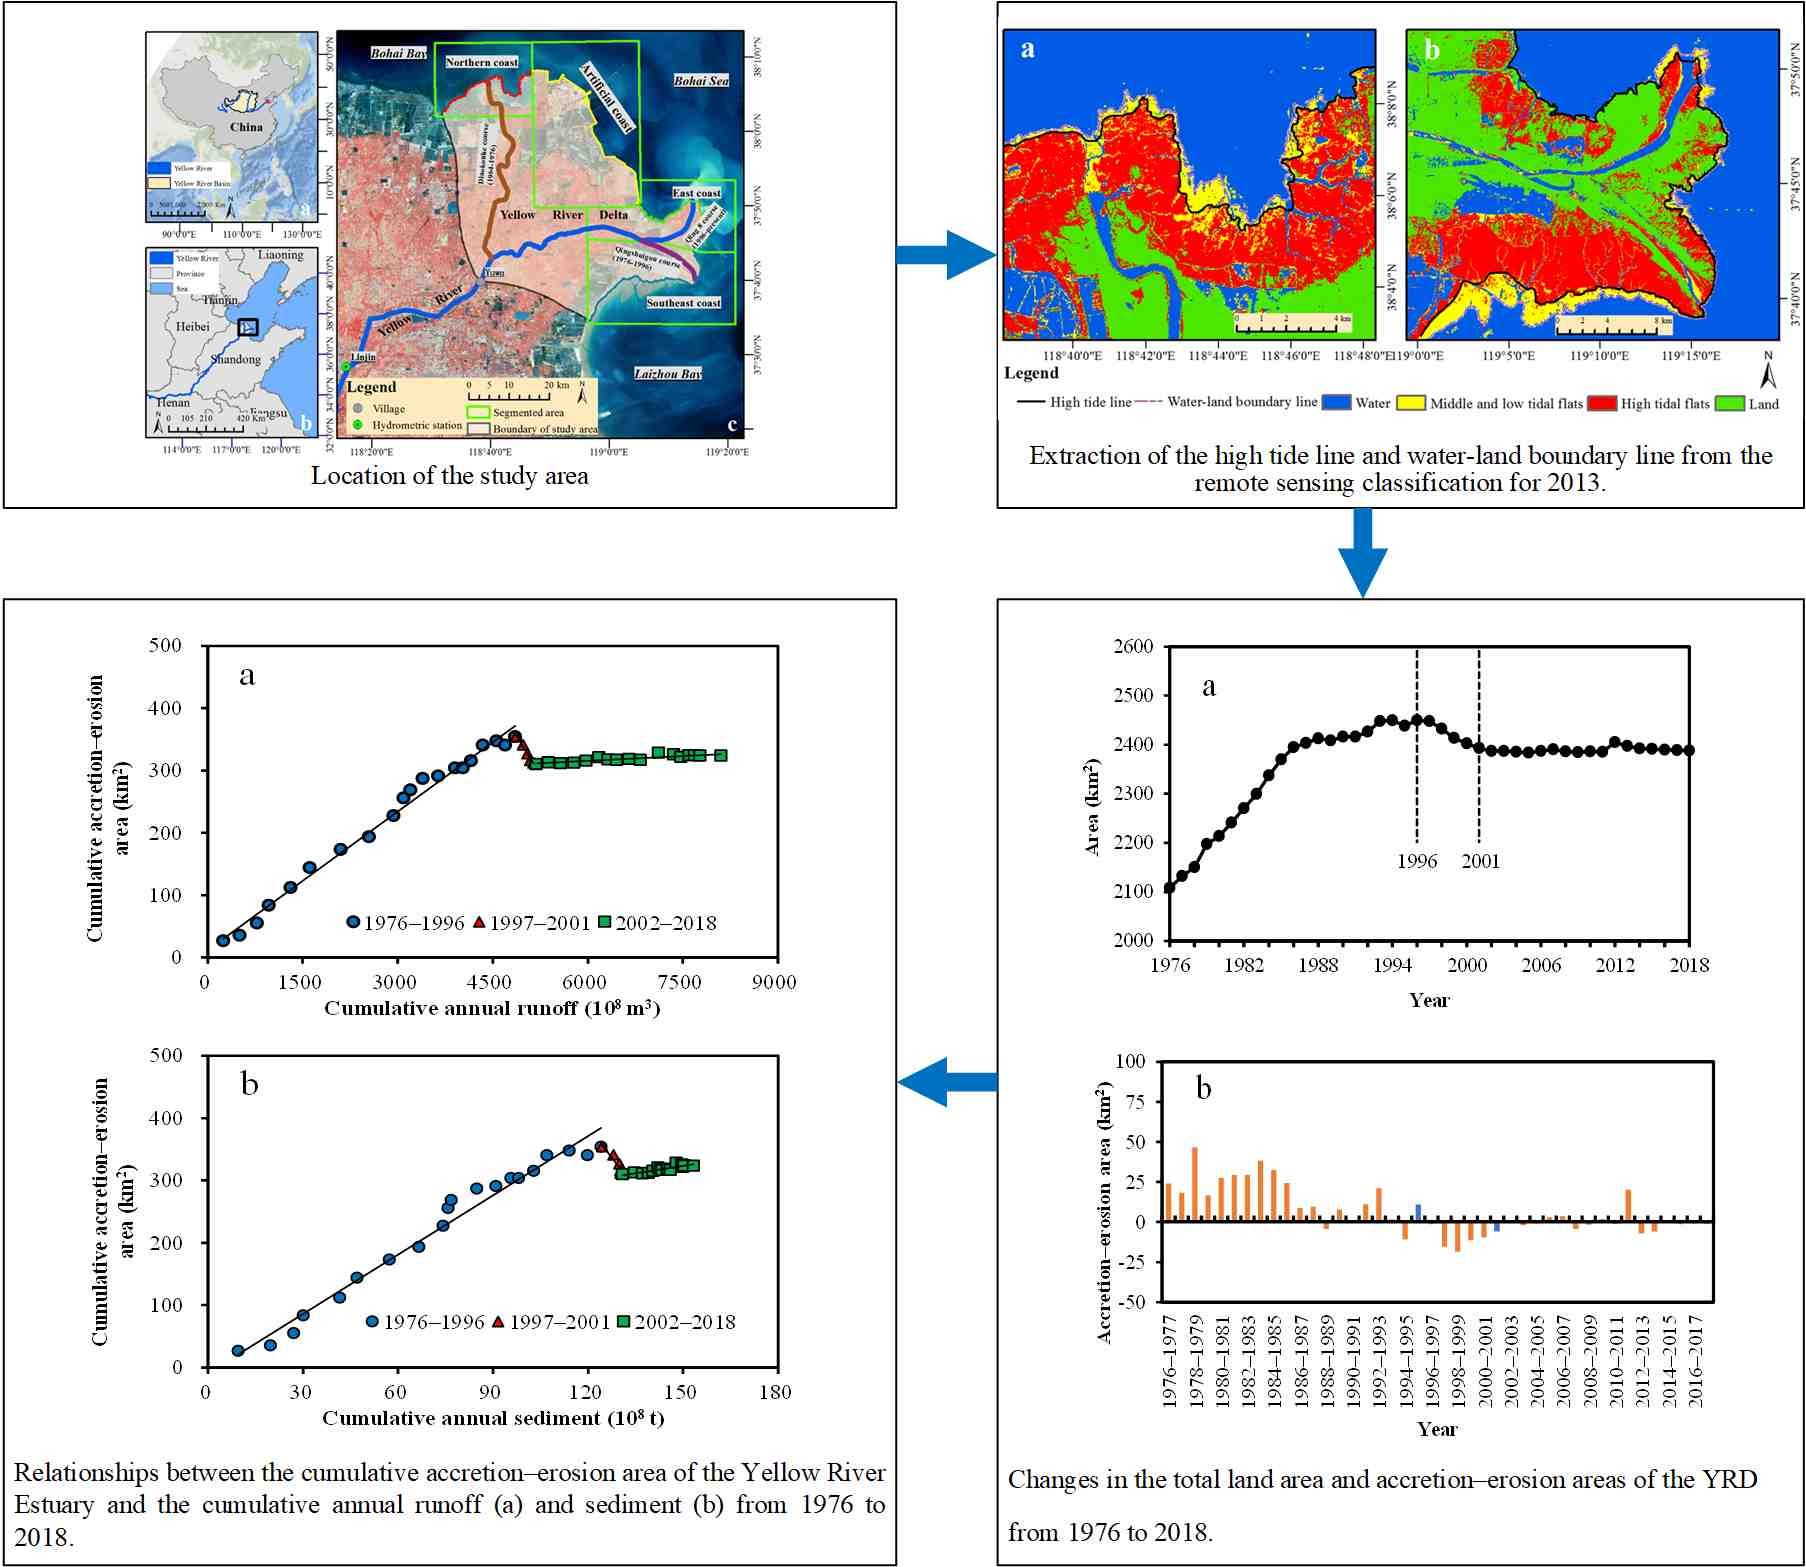
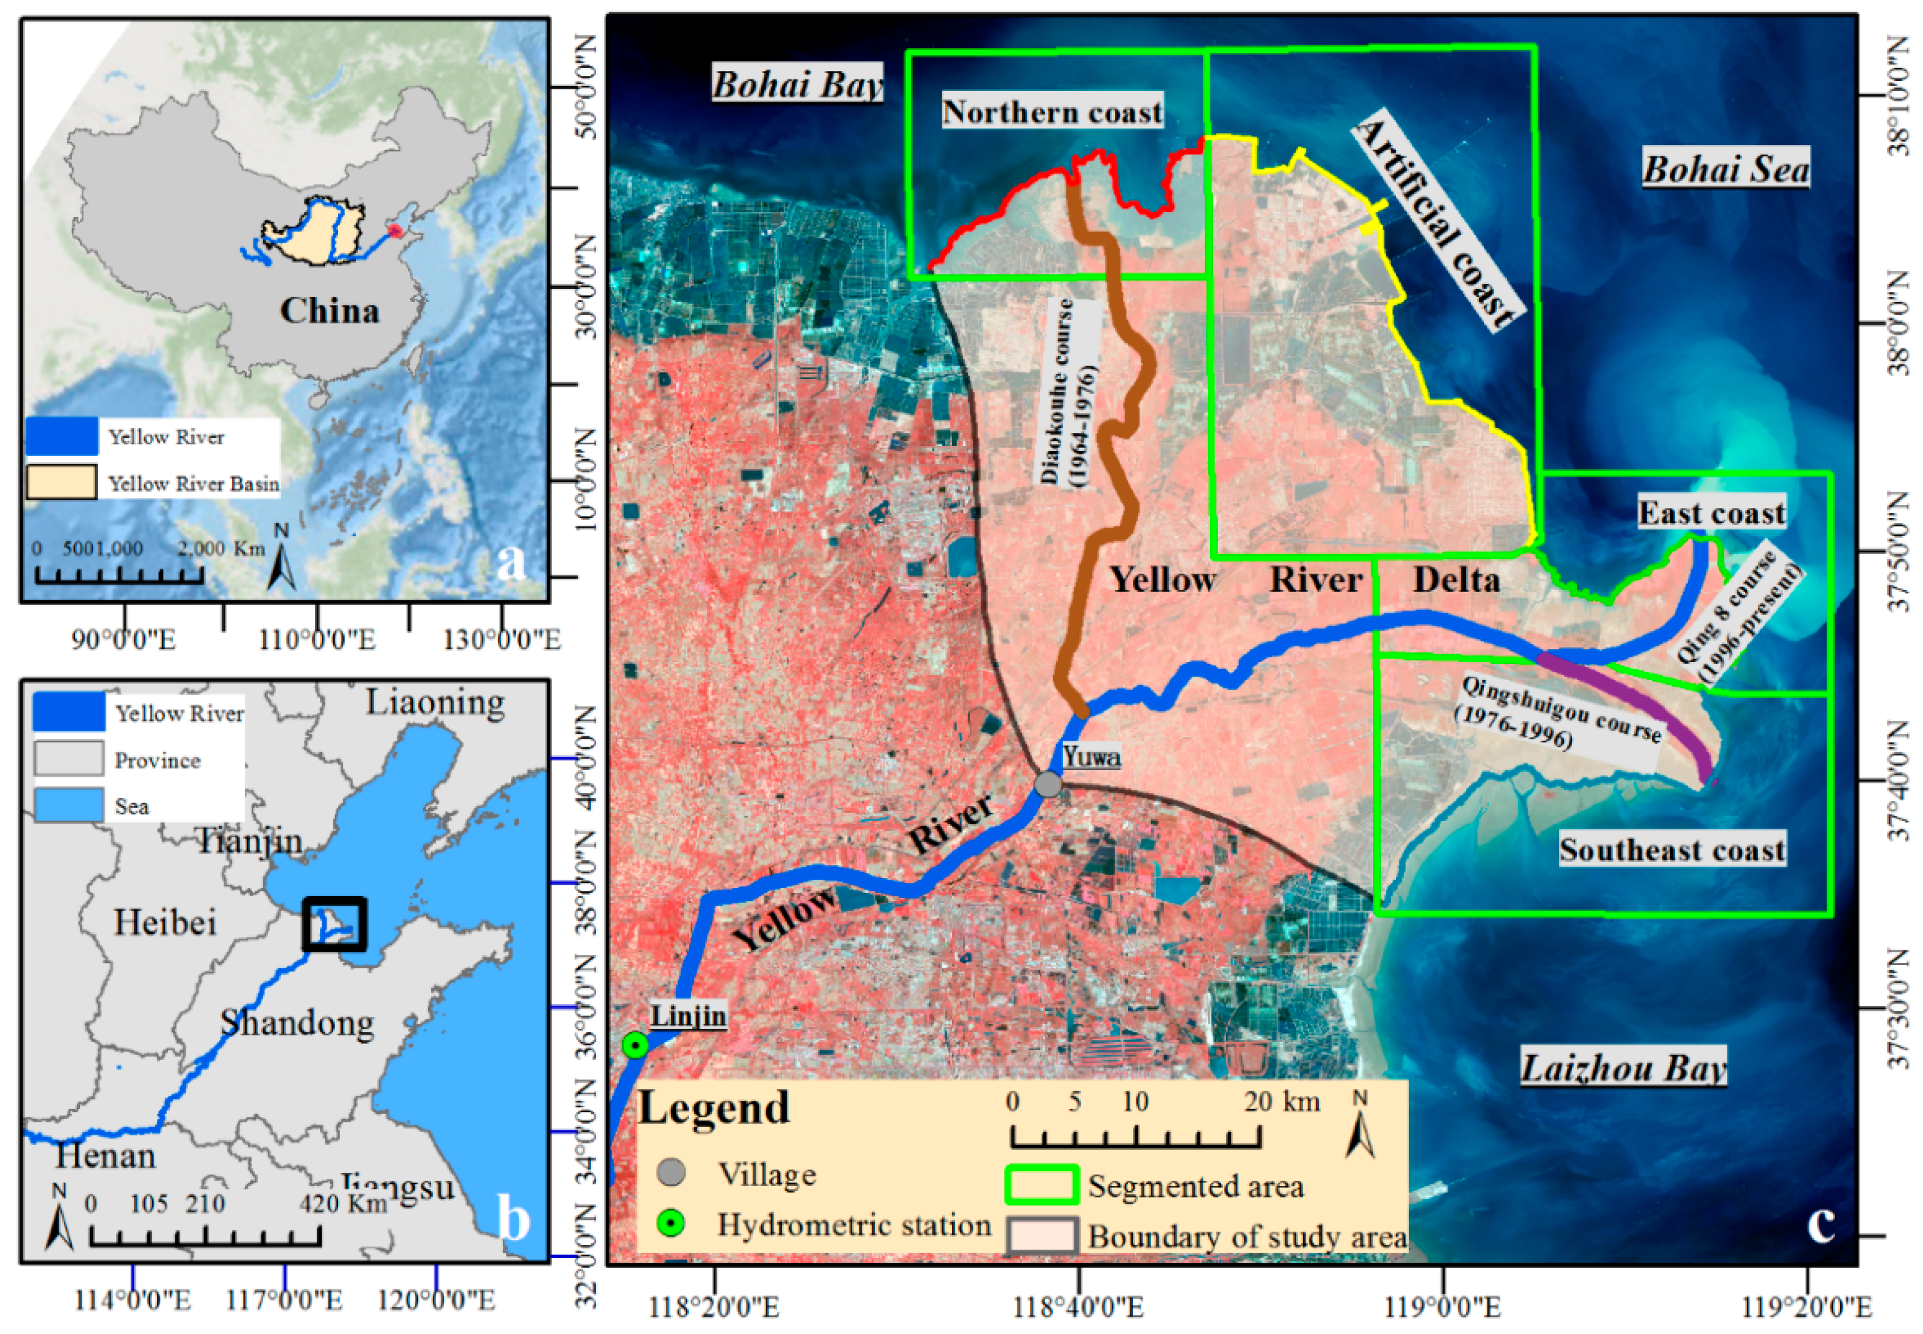
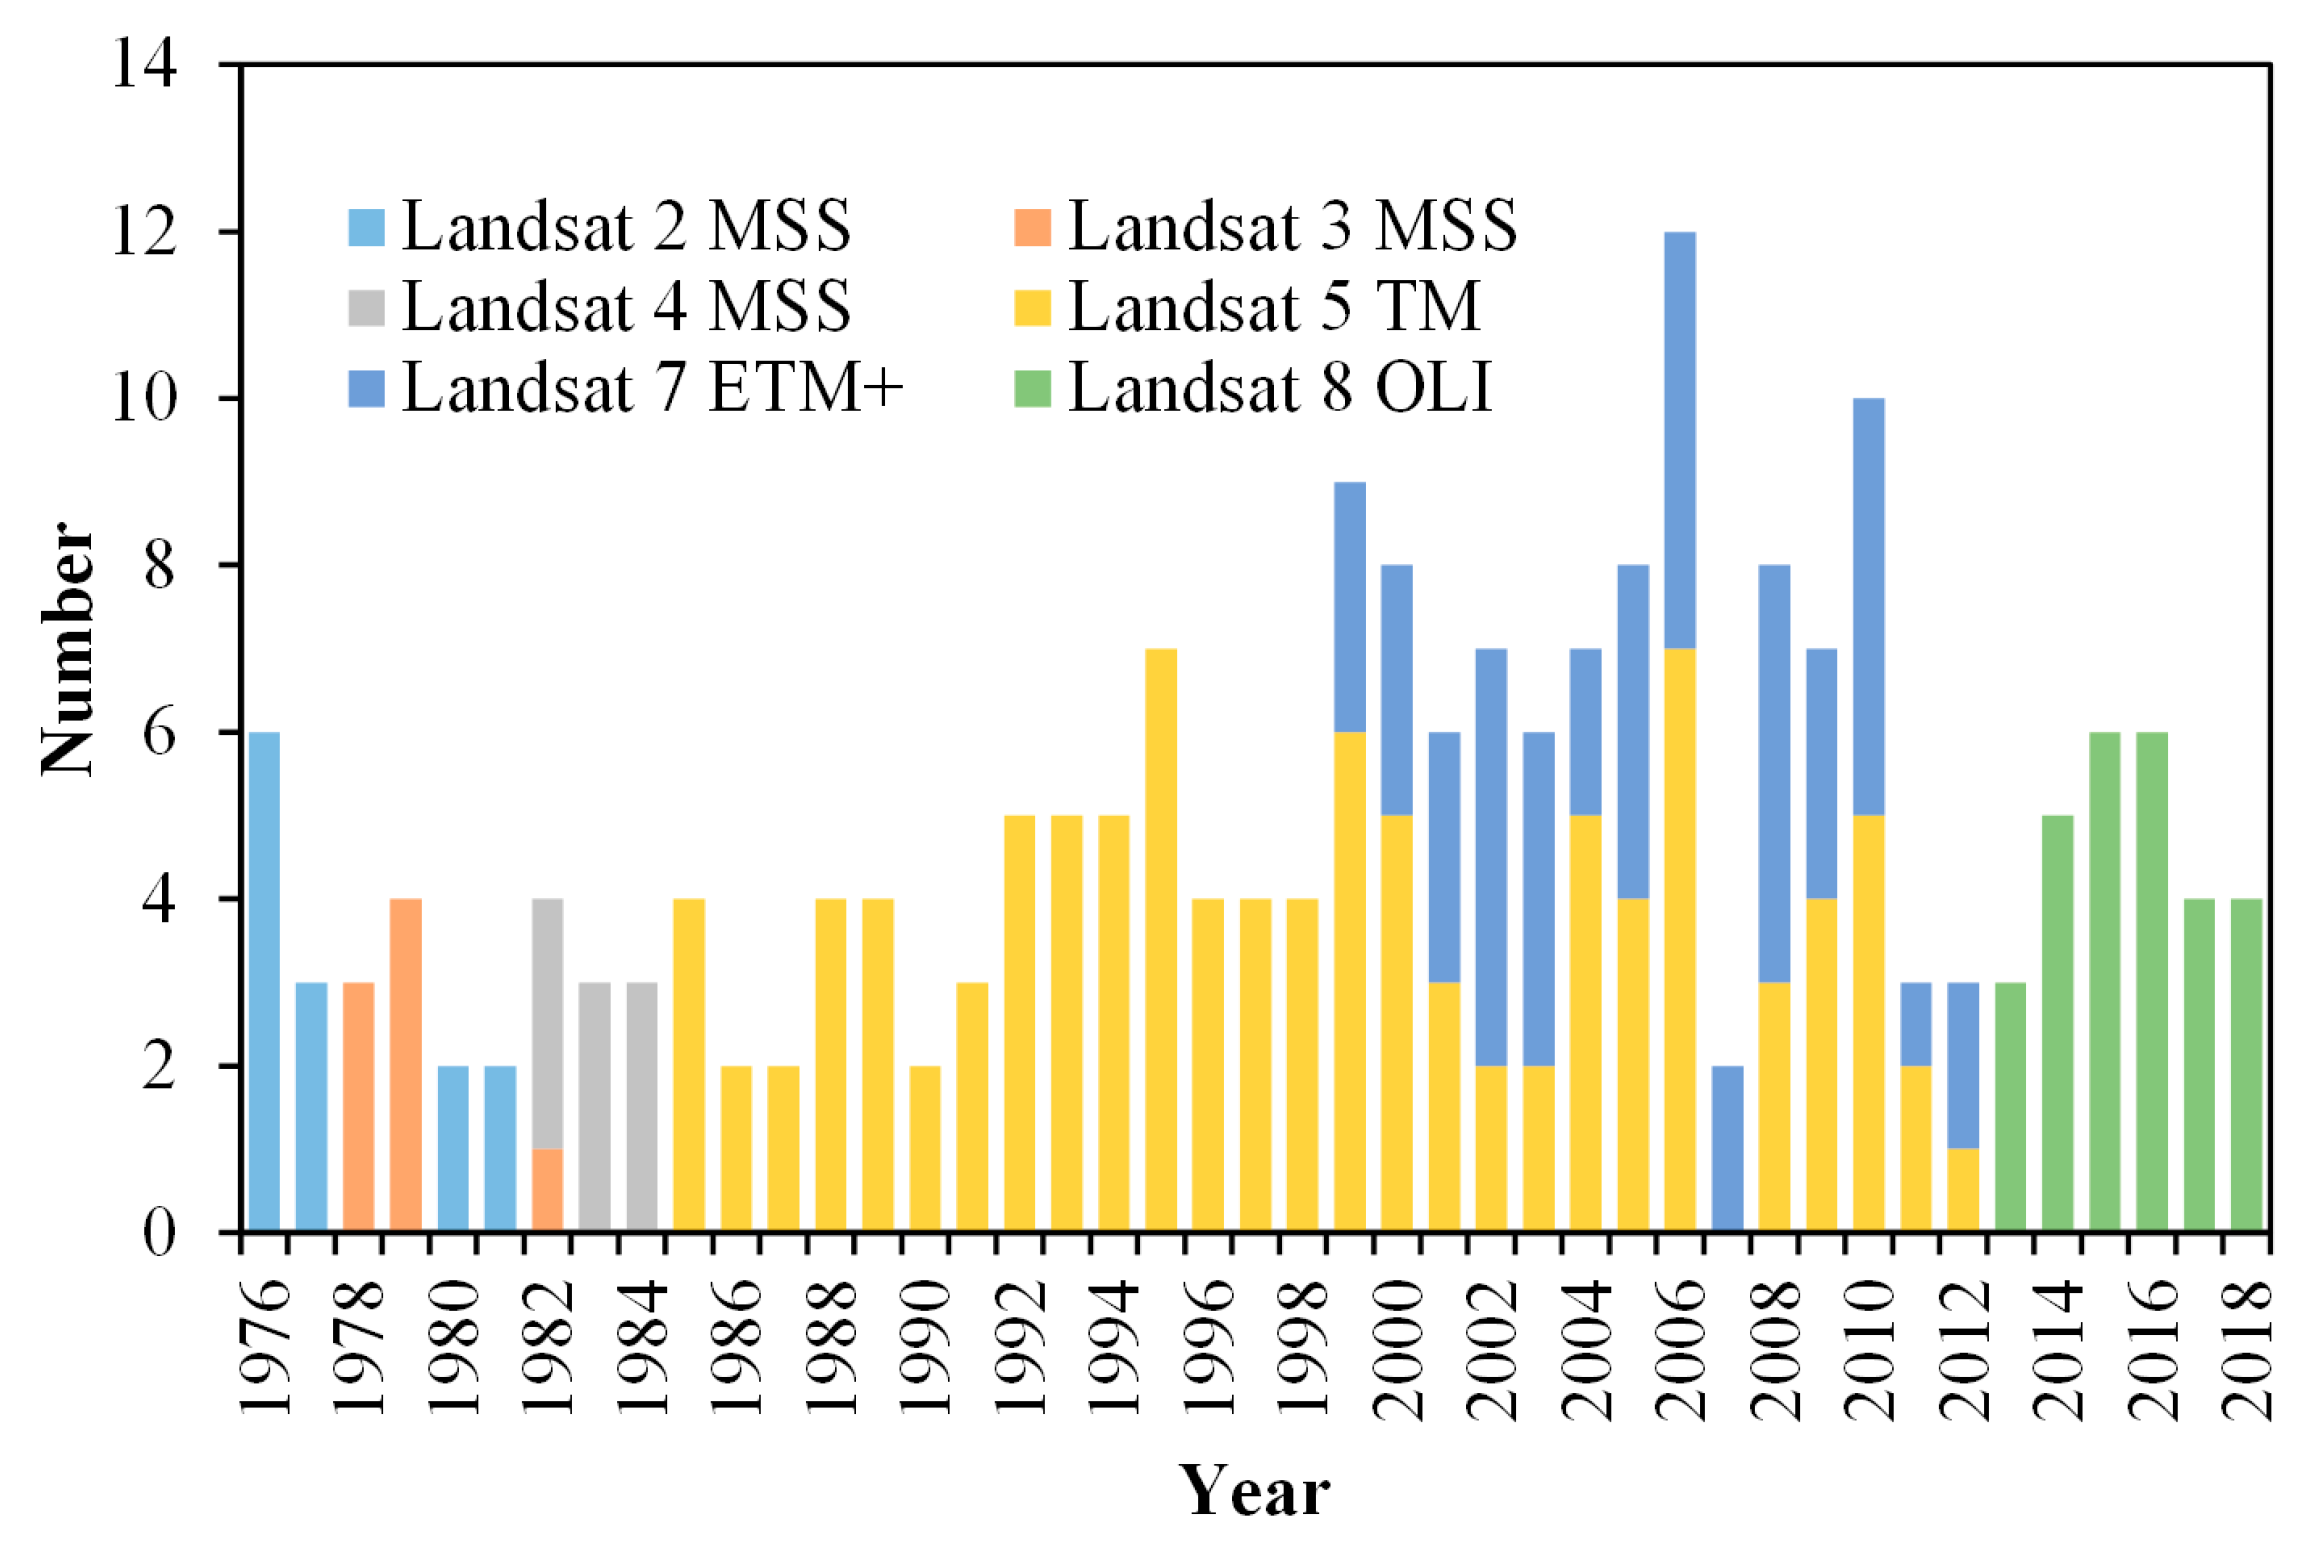
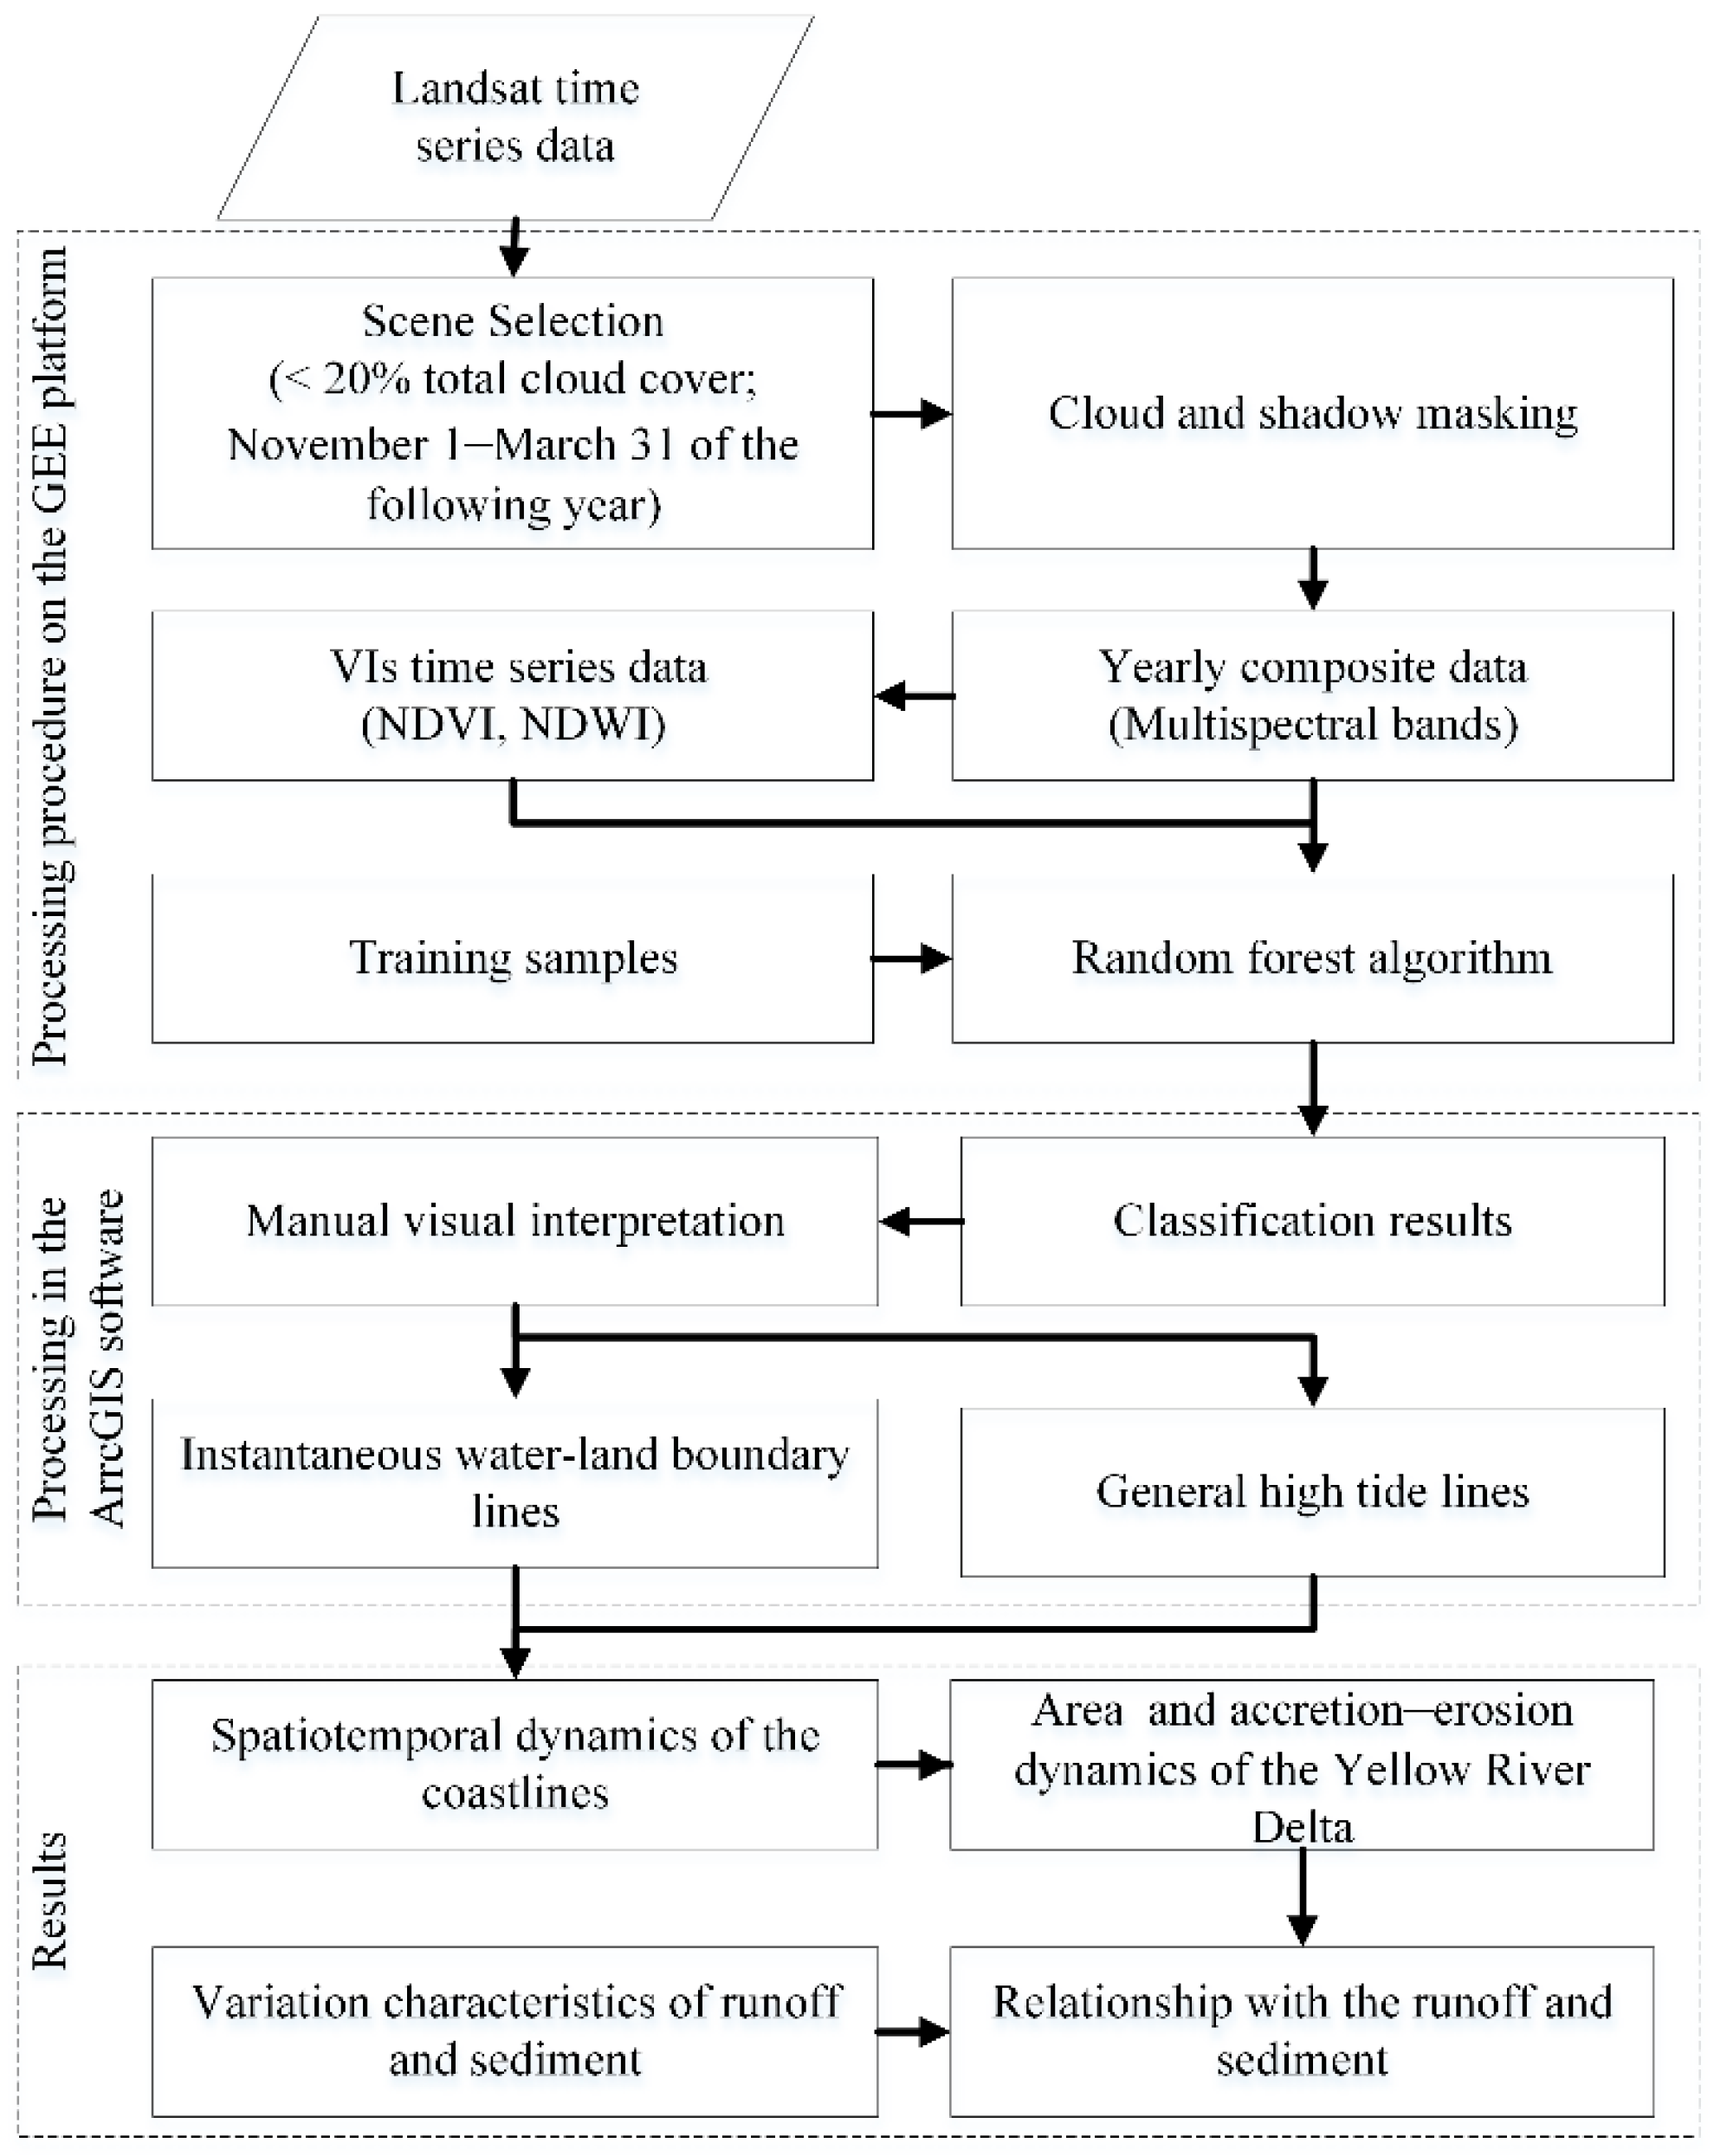
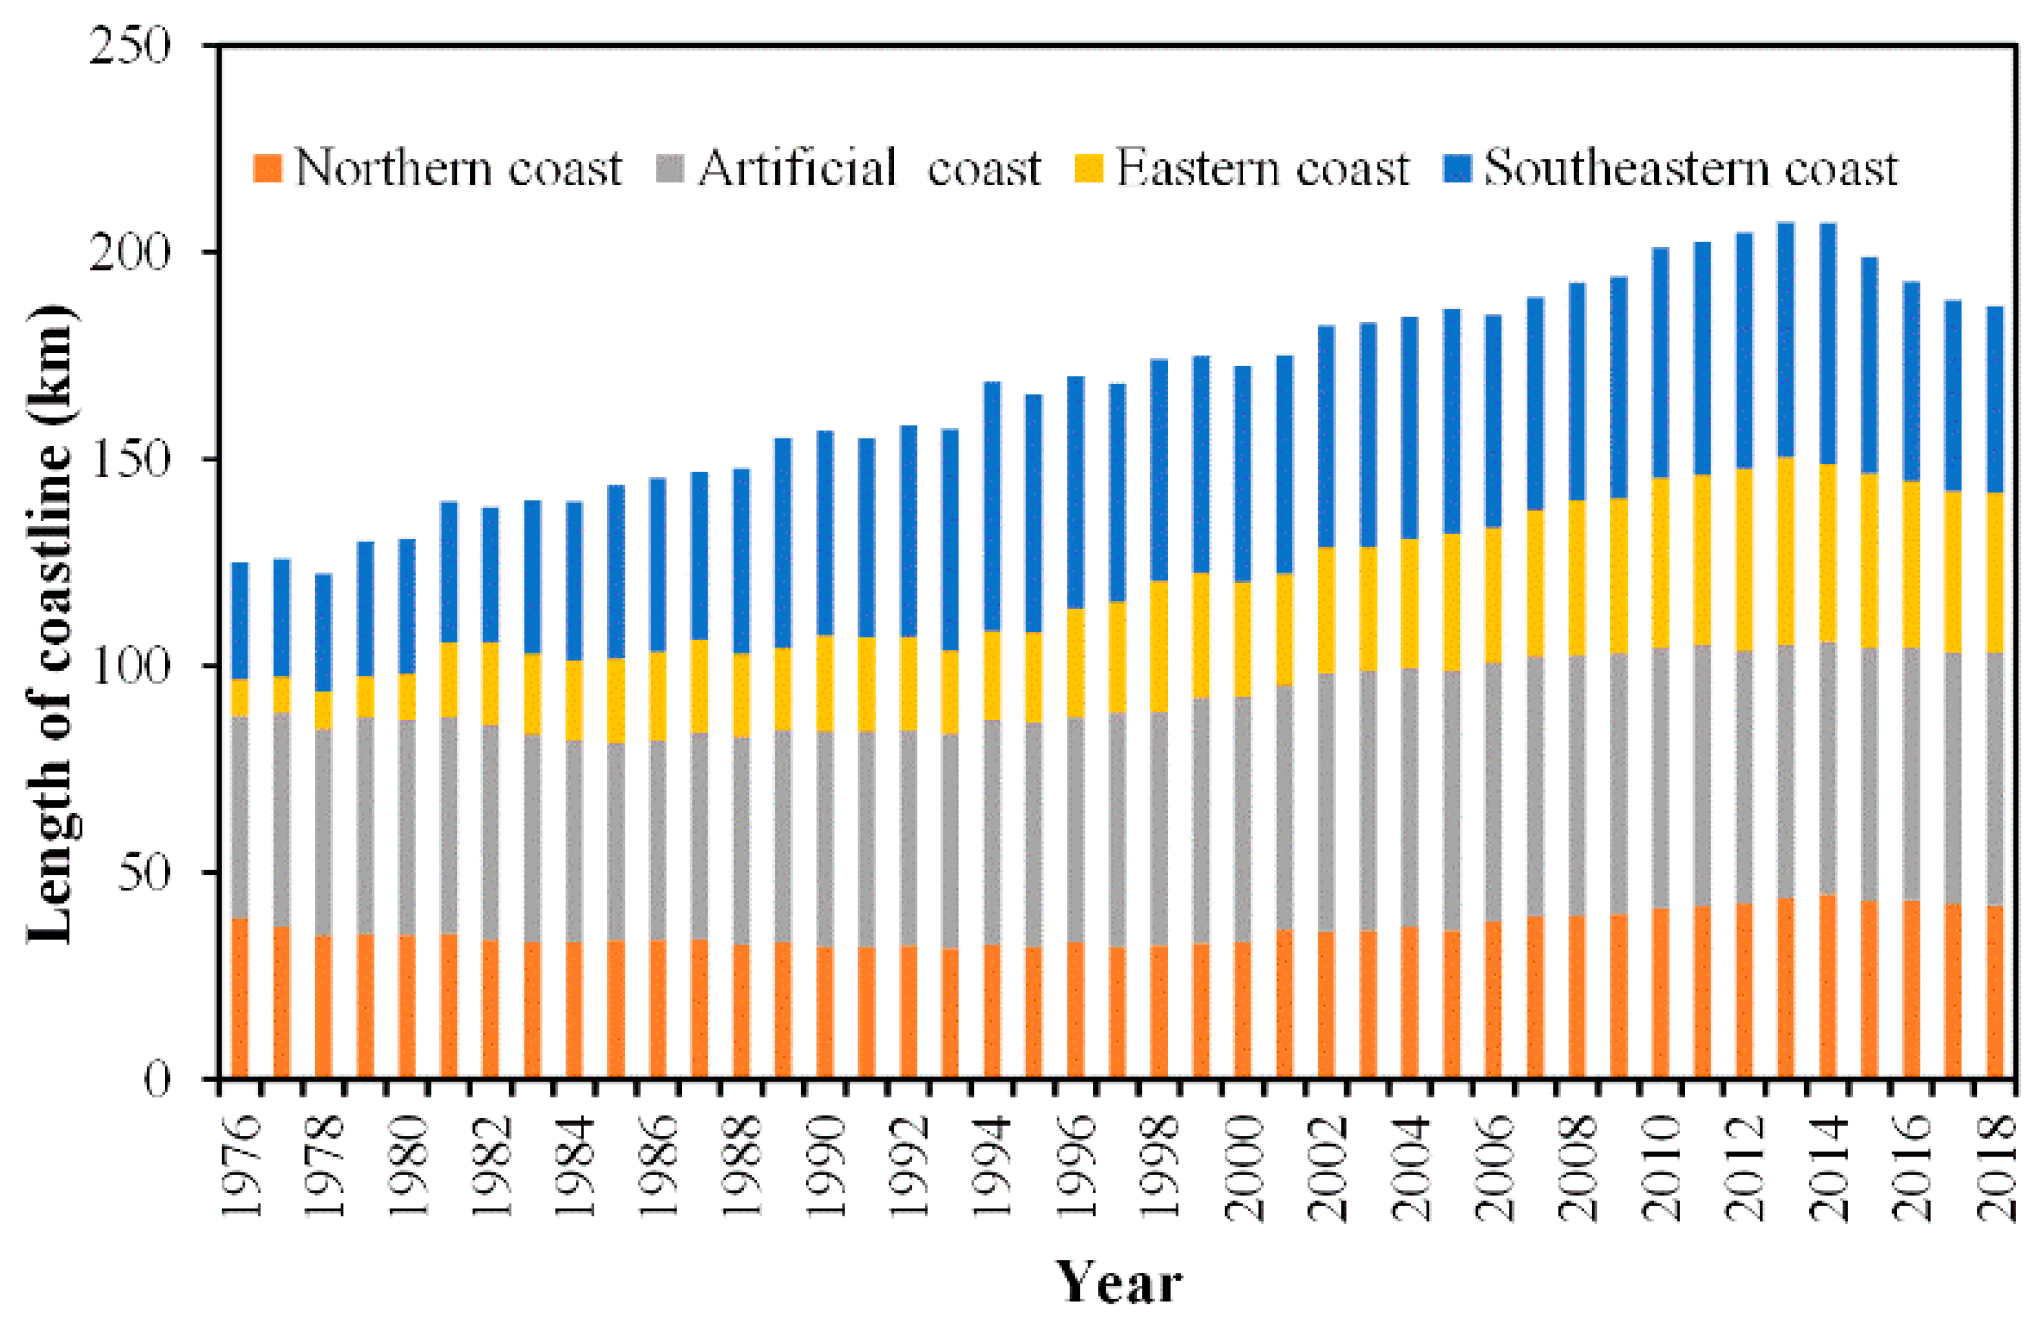
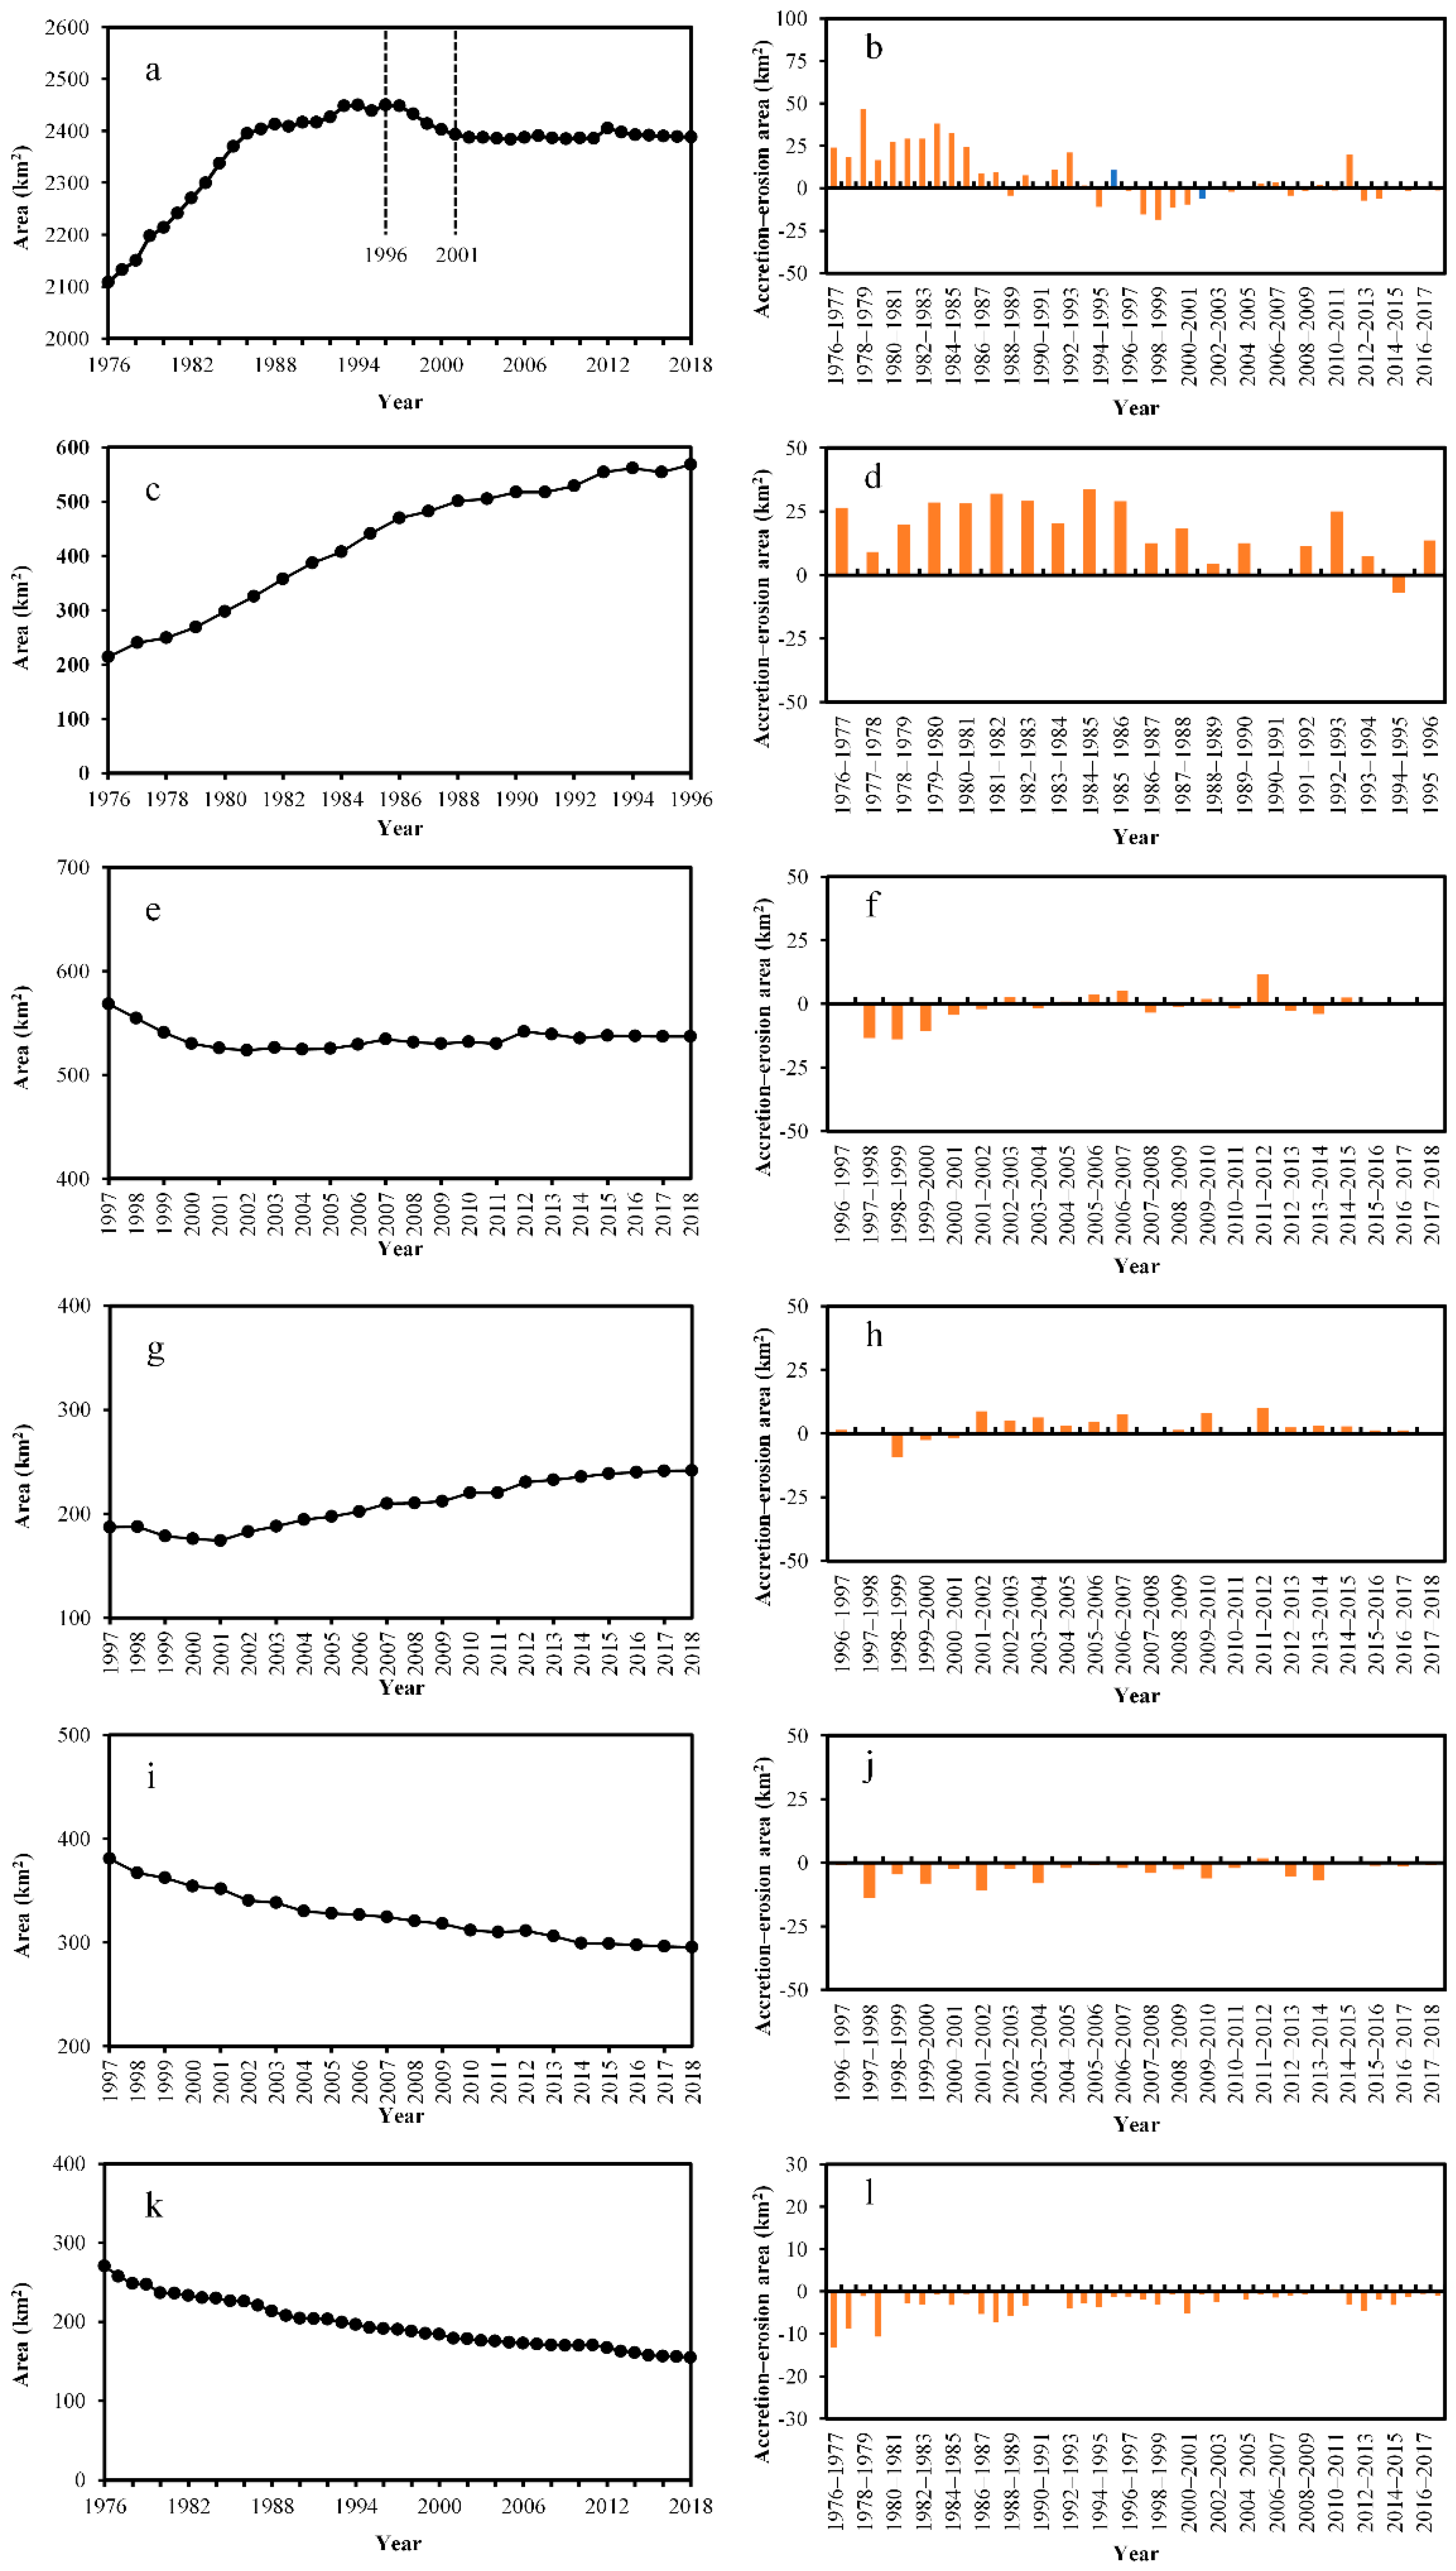
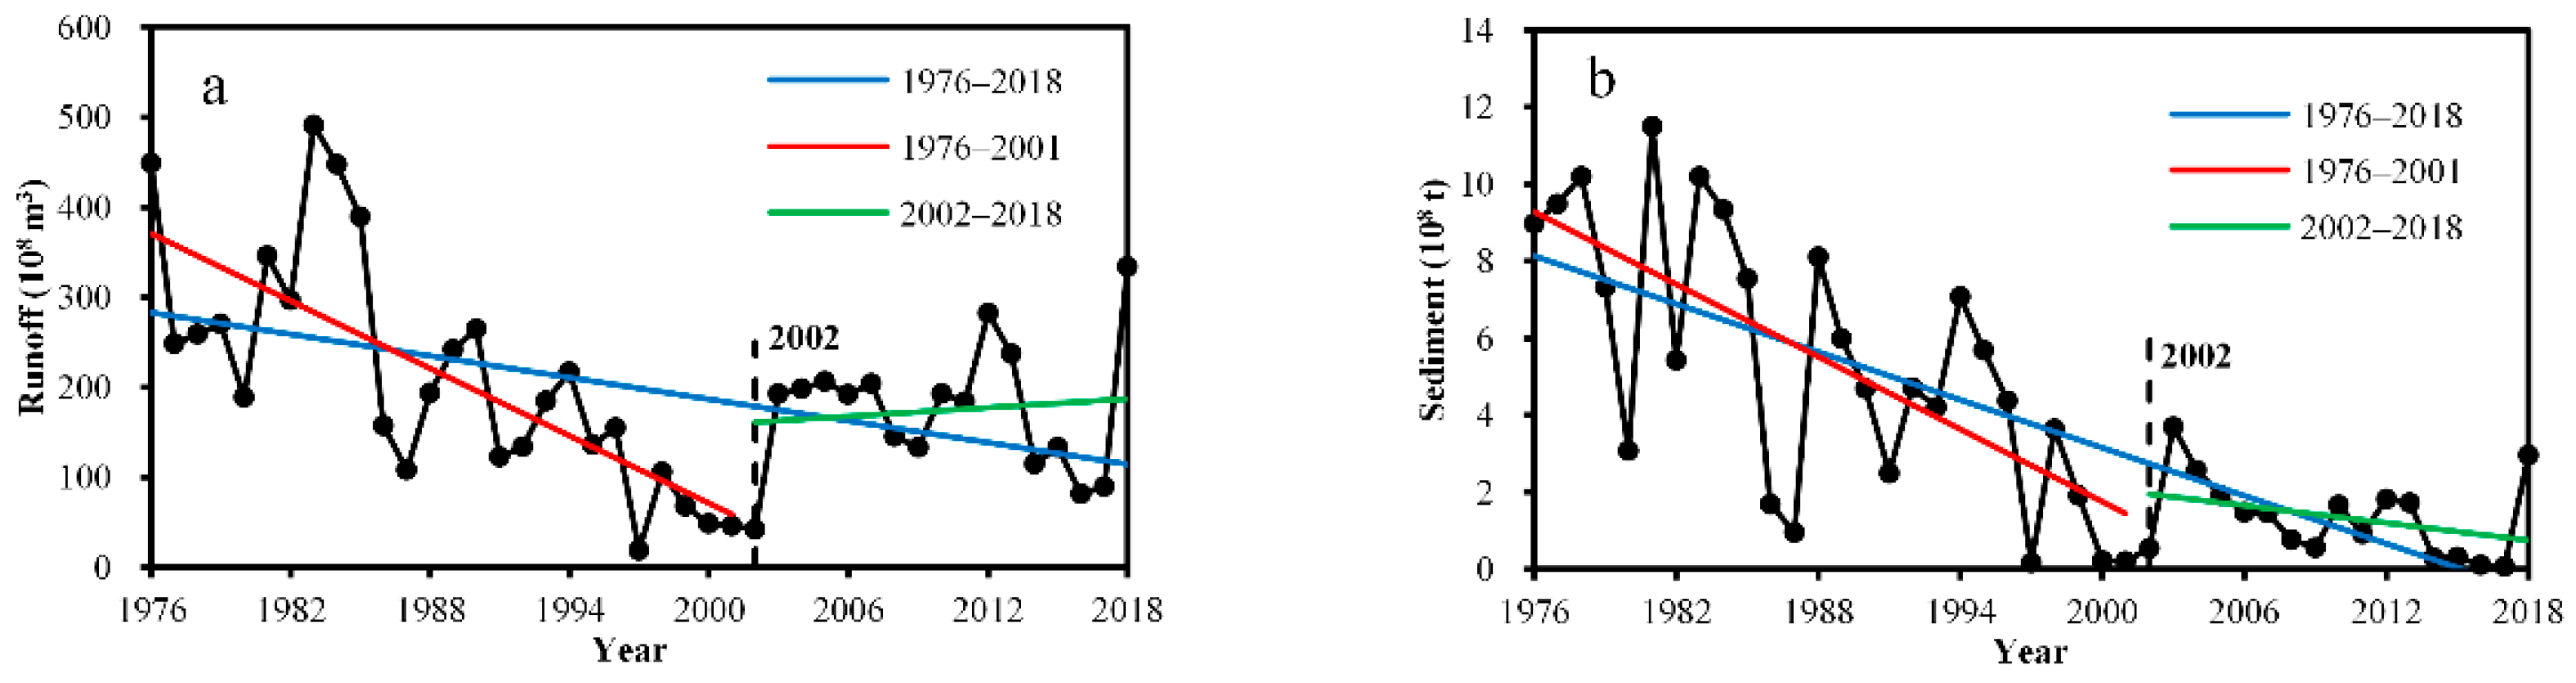
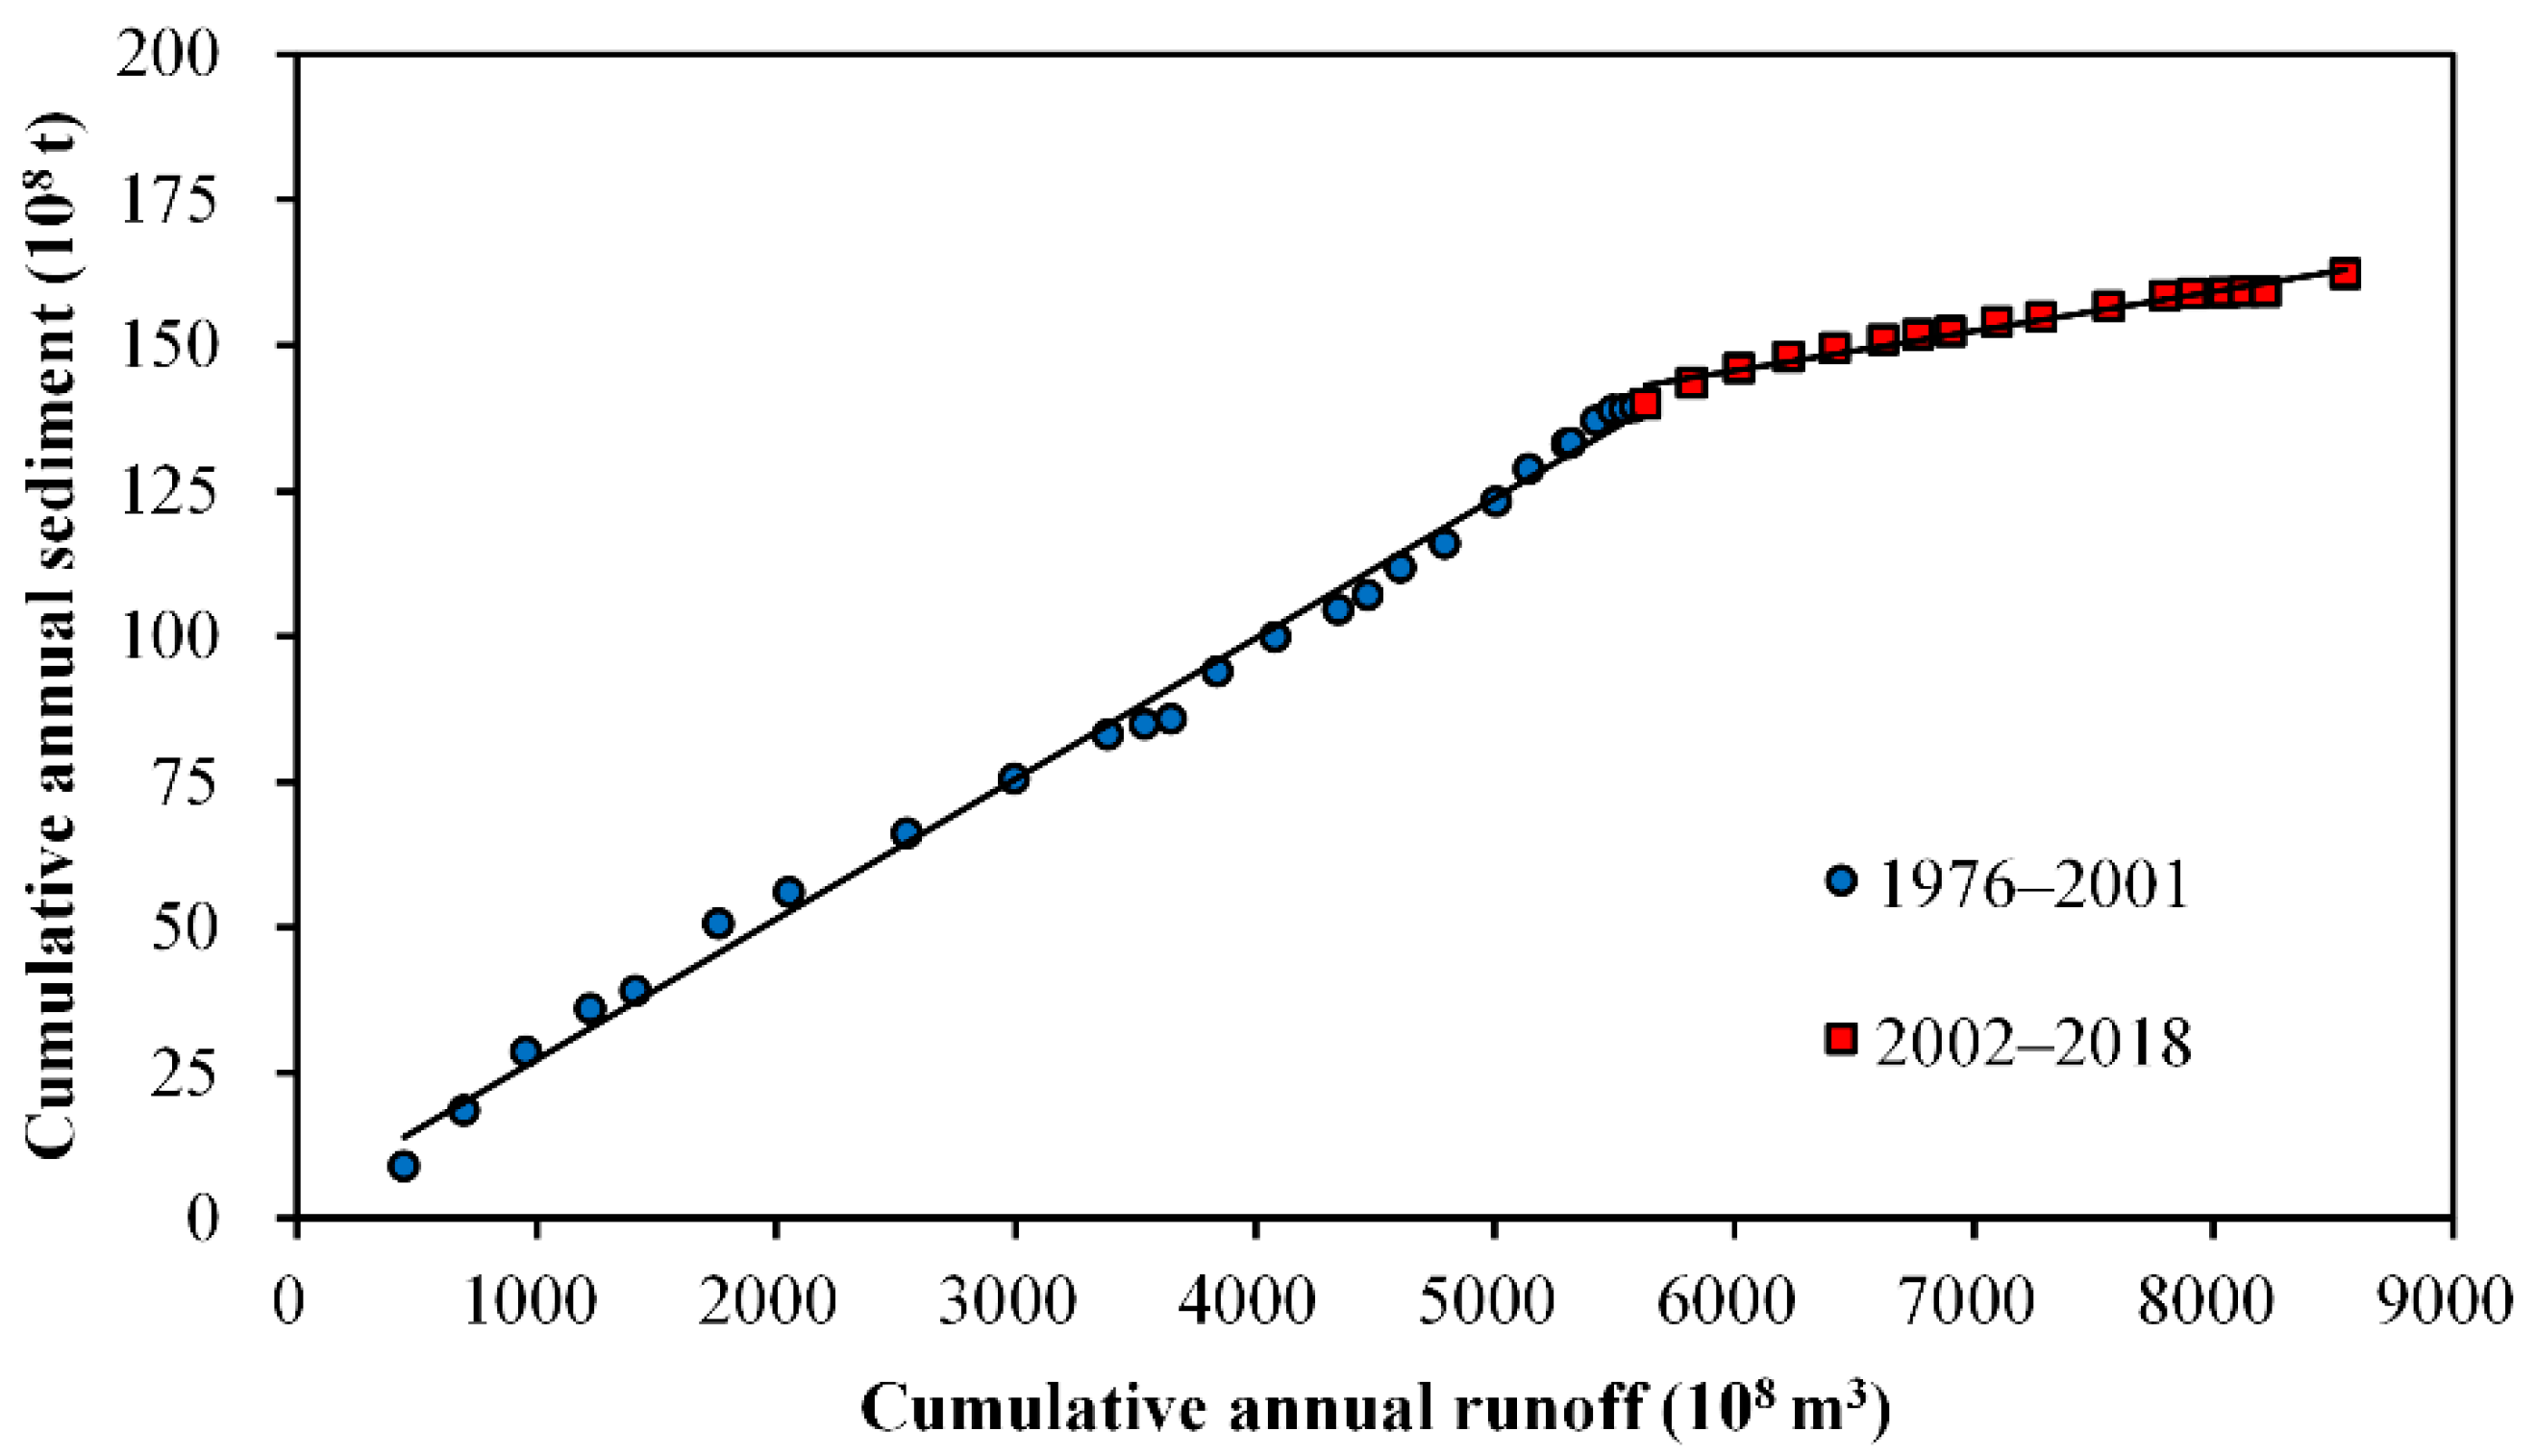
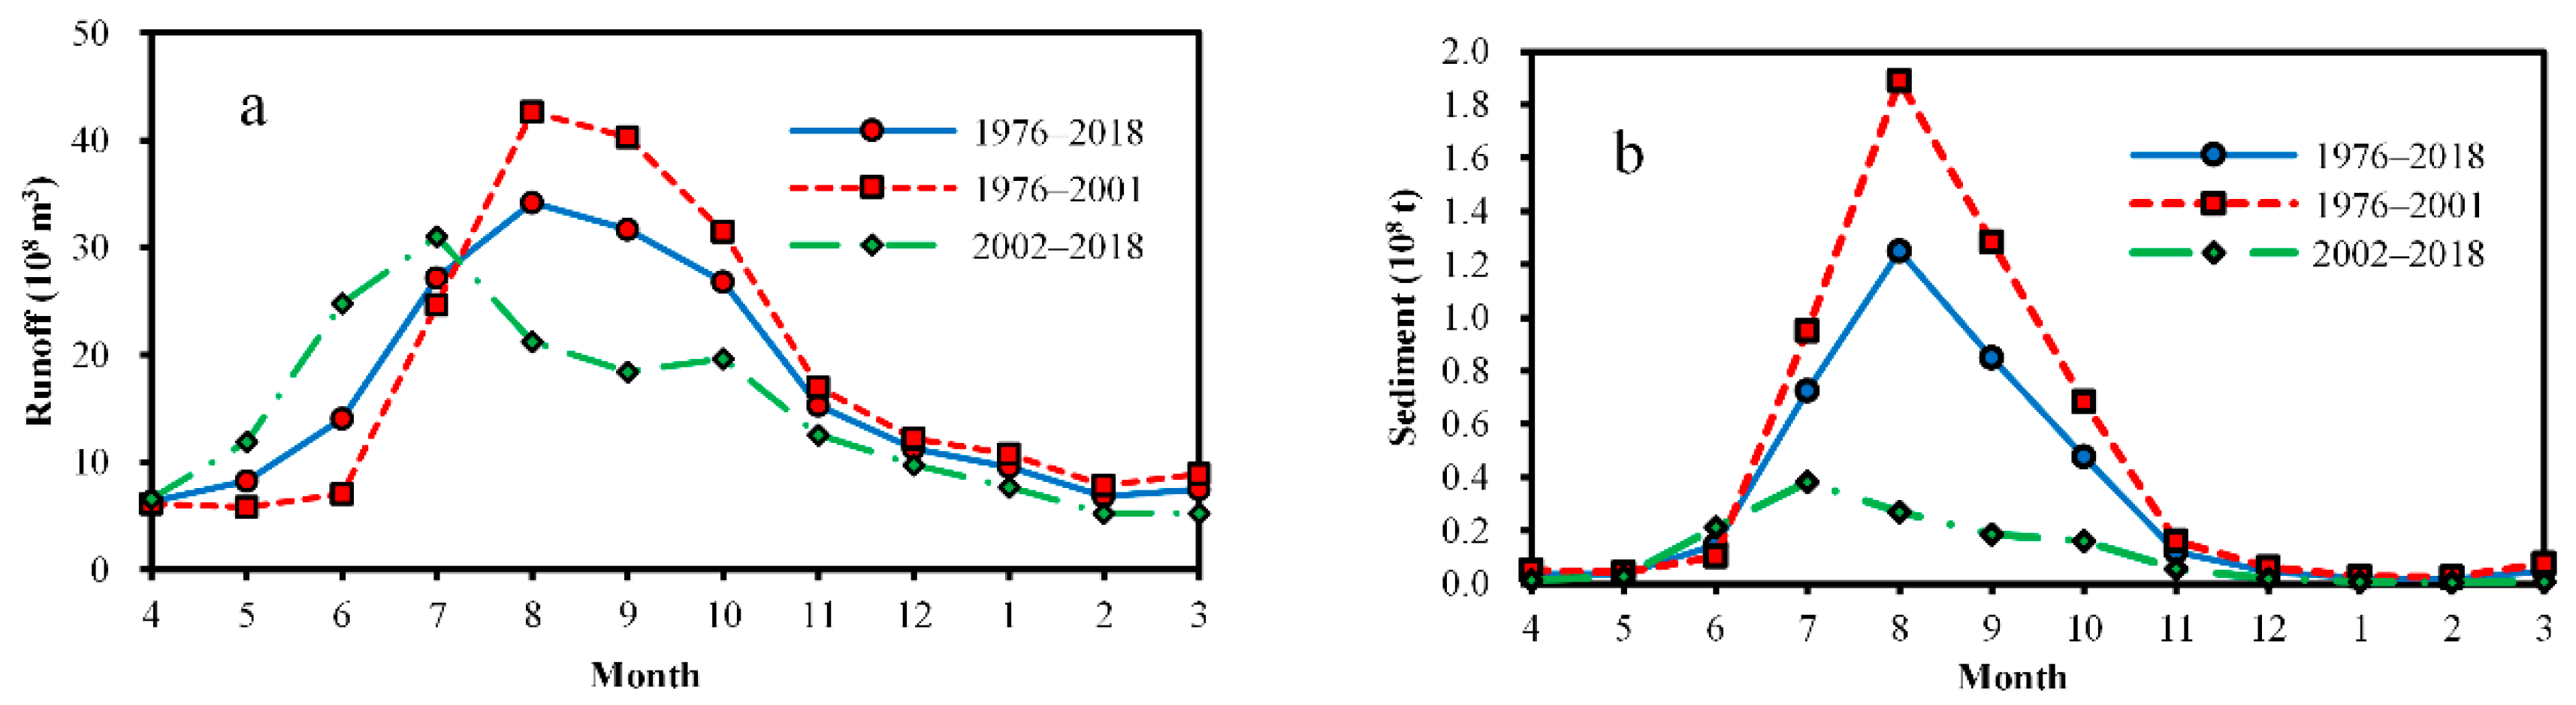
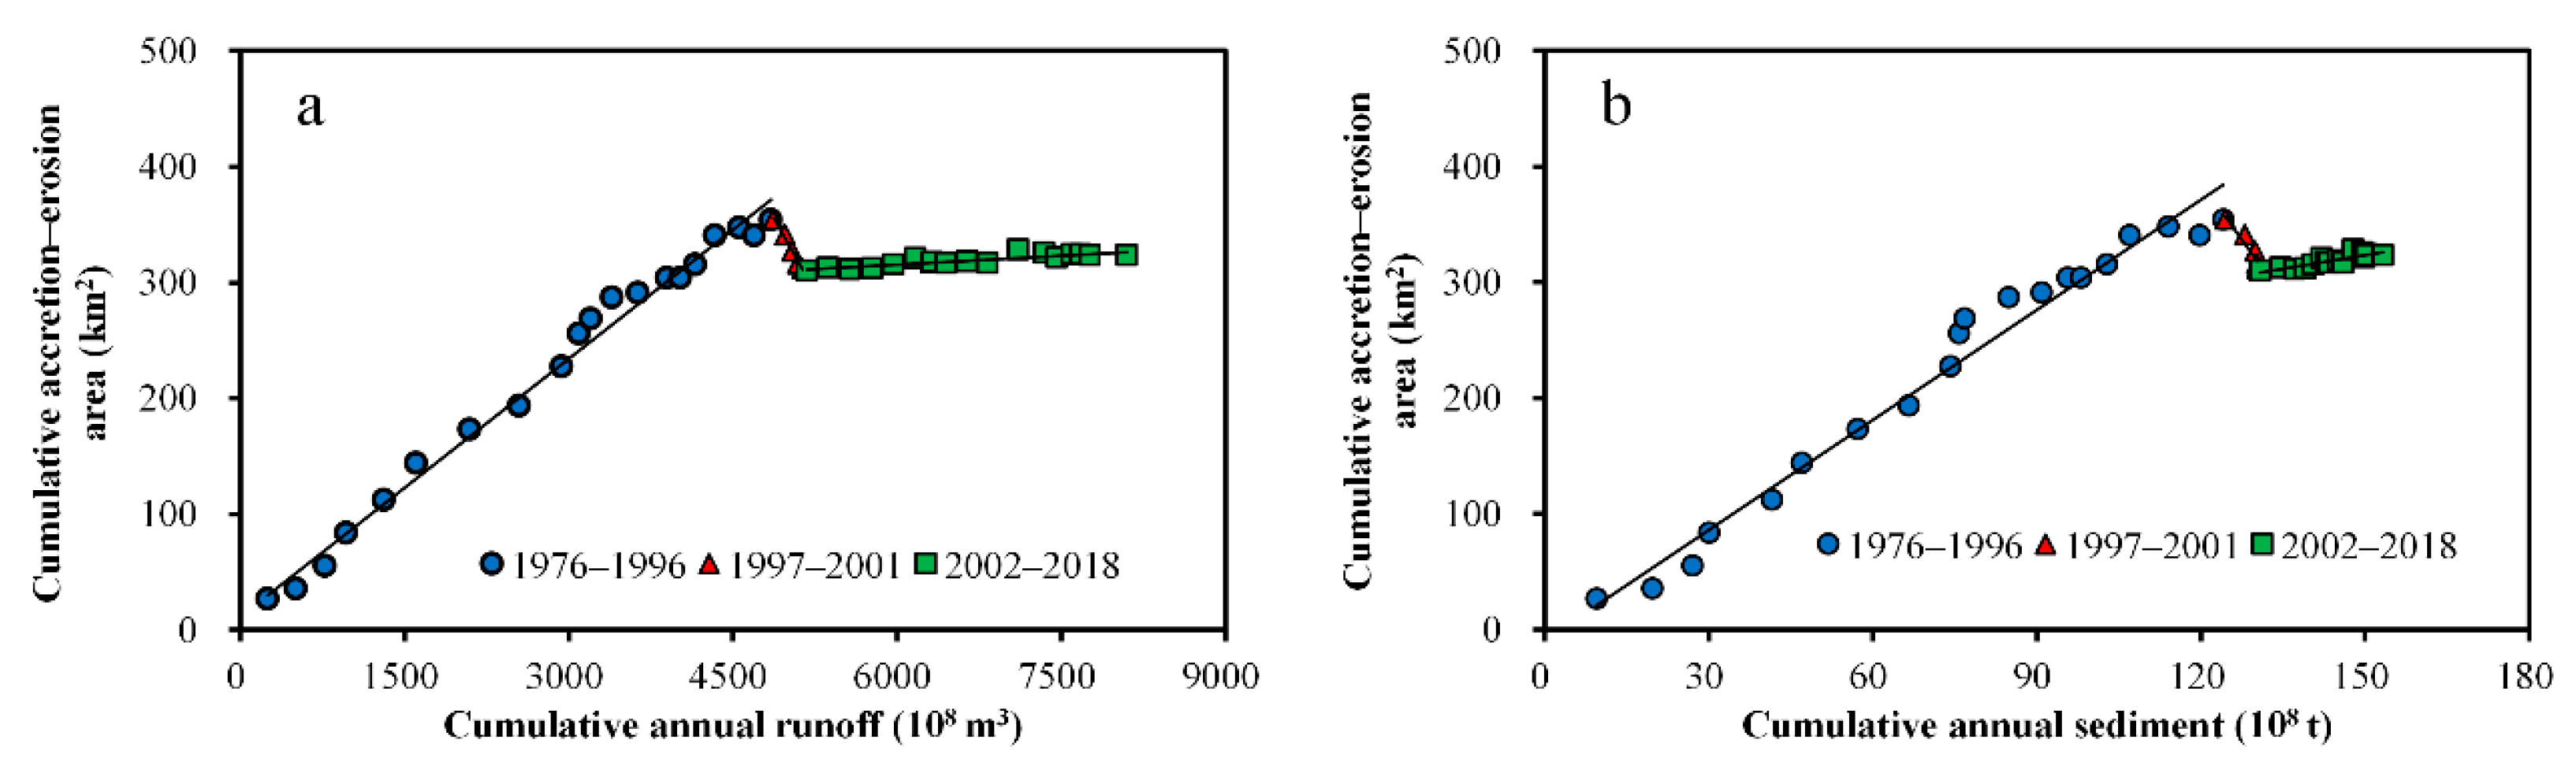
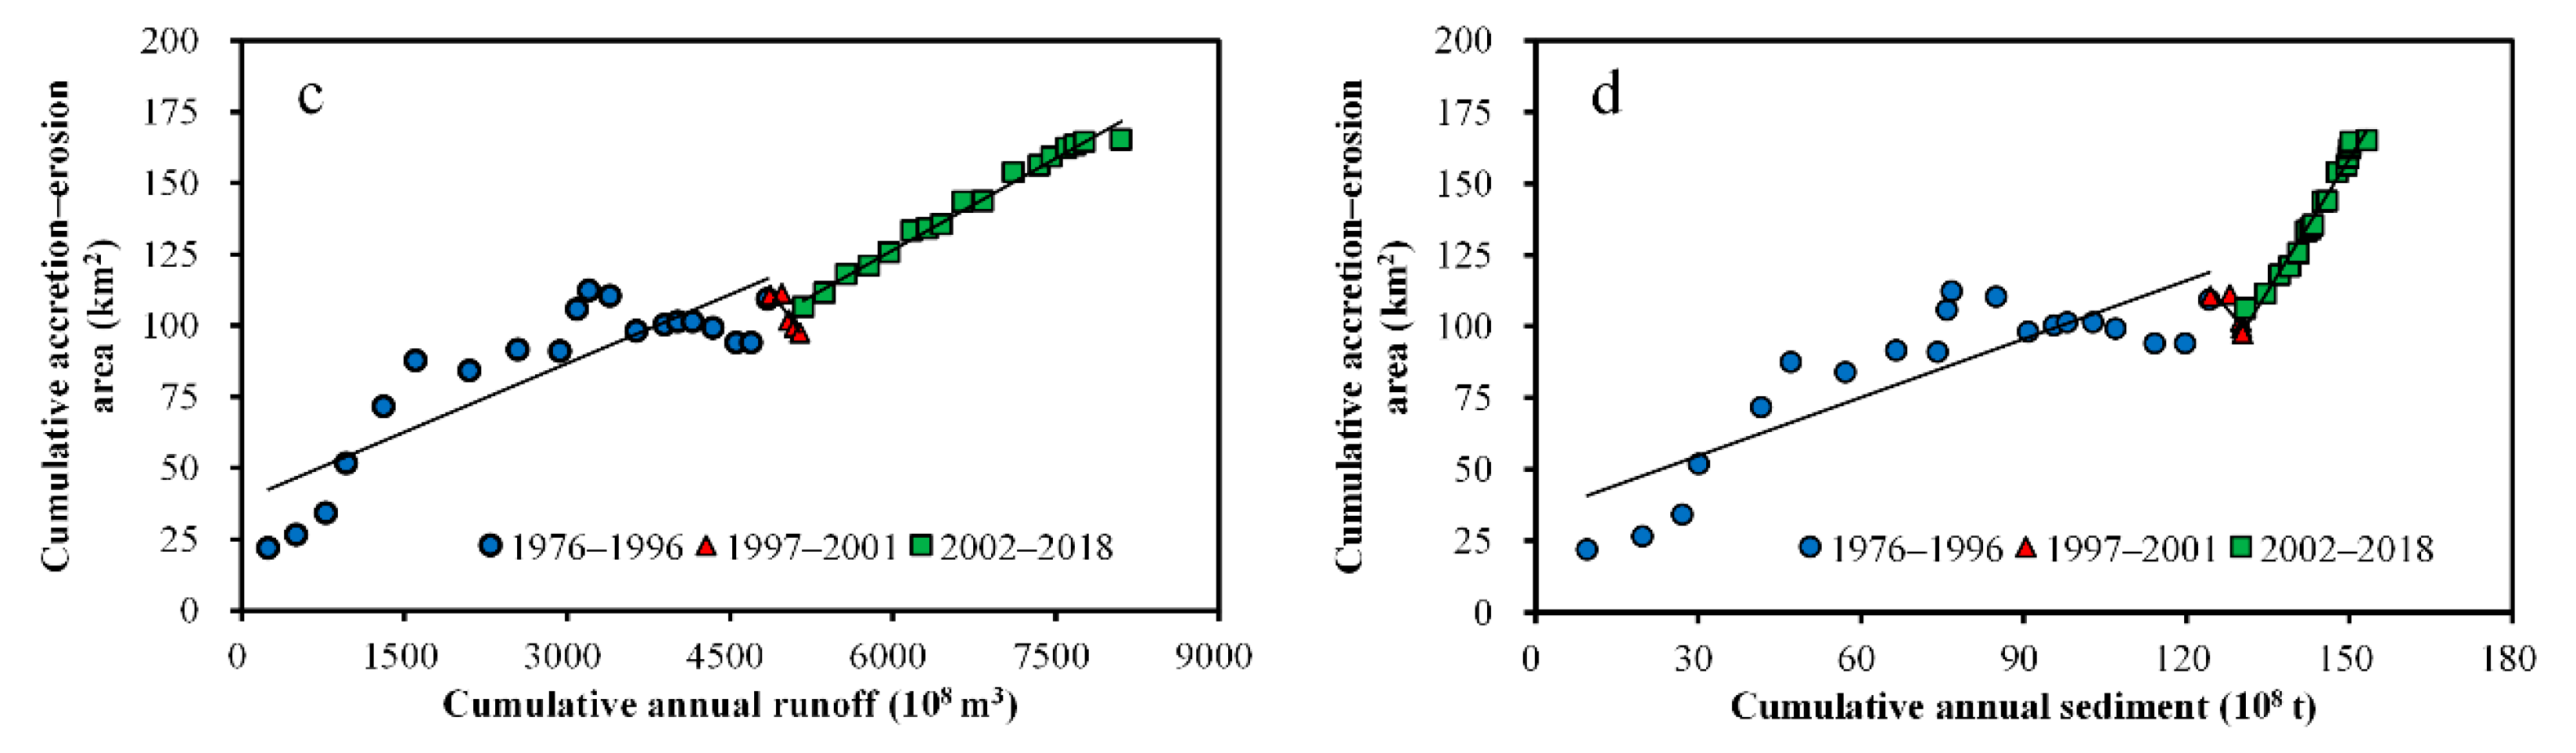
Table 1.
Characteristics of multitemporal Landsat series data used in the study.
| Band Name | Spectral Range/μm | Vegetation Index (VI) | Equation | ||||
|---|---|---|---|---|---|---|---|
| Landsat 8 OLI | Landsat 7 ETM+ | Landsat 5 TM | Landsat 2, 3 and 4 MSS | ||||
| Blue | 0.452–0.512 | 0.441–0.514 | 0.45–0.52 | NDVI | (NIR−Red)/(NIR+Red) | ||
| Green | 0.533–0.590 | 0.519–0.601 | 0.52–0.60 | 0.5–0.6 | |||
| Red | 0.636–0.673 | 0.631–0.692 | 0.63–0.69 | 0.6–0.7 | NDWI | (NIR−Green)/(NIR+Green) | |
| NIR 1 | 0.851–0.879 | 0.772–0.898 | 0.77–0.90 | 0.7–0.8 | |||
| NIR 2 | 0.8–1.1 | ||||||
| SWIR 1 | 1.566–1.651 | 1.547–1.749 | 1.55–1.75 | ||||
| SWIR 2 | 2.107–2.294 | 2.064–2.345 | 2.08–2.35 | ||||
Note: NIR is near-infrared, SWIR is shortwave infrared. MSS is Multispectral Scanner, TM is Thematic Mapper, ETM+ is Enhanced Thematic Mapper plus, and OLI is Operational Land Imager. NDVI is the normalized difference vegetation index, and NDWI is the normalized difference water index.
Publisher’s Note: MDPI stays neutral with regard to jurisdictional claims in published maps and institutional affiliations. |
© 2020 by the authors. Licensee MDPI, Basel, Switzerland. This article is an open access article distributed under the terms and conditions of the Creative Commons Attribution (CC BY) license (http://creativecommons.org/licenses/by/4.0/).
Share and Cite
MDPI and ACS Style
Li, H.; Huang, C.; Liu, Q.; Liu, G. Accretion–Erosion Dynamics of the Yellow River Delta and the Relationships with Runoff and Sediment from 1976 to 2018. Water 2020, 12, 2992. https://doi.org/10.3390/w12112992
AMA Style
Li H, Huang C, Liu Q, Liu G. Accretion–Erosion Dynamics of the Yellow River Delta and the Relationships with Runoff and Sediment from 1976 to 2018. Water. 2020; 12(11):2992. https://doi.org/10.3390/w12112992
Chicago/Turabian StyleLi, He, Chong Huang, Qingsheng Liu, and Gaohuan Liu. 2020. "Accretion–Erosion Dynamics of the Yellow River Delta and the Relationships with Runoff and Sediment from 1976 to 2018" Water 12, no. 11: 2992. https://doi.org/10.3390/w12112992
Note that from the first issue of 2016, this journal uses article numbers instead of page numbers. See further details here.