Optimum Design of High-Strength Concrete Mix Proportion for Crack Resistance Using Artificial Neural Networks and Genetic Algorithm
 Li Yue
 Li Hongwen1
  Li Yinuo
 Jin Caiyun
- 1Key Laboratory of Urban Security and Disaster Engineering of Ministry of Education, Beijing Key Laboratory of Earthquake Engineering and Structural Retrofit, Beijing University of Technology, Beijing, China
- 2Materials Engineering CO-OP, McGill University, Montreal, Canada
- 3College of Applied Sciences, Beijing University of Technology, Beijing, China
The fact that high-strength concrete is easily to crack has a significant negative impact on its durability and strength. This paper gives an optimum design method of high-strength concrete for improving crack resistance based on orthogonal test artificial neural networks (ANN) and genetic algorithm. First, orthogonal test is operated to determine the influence of the concrete mix proportion to the slump, compressive strength, tensile strength, and elastic modulus, followed by calculating and predicting the concrete performance using ANN. Based on results from orthogonal test and ANN, a functional relationship among slump, compressive strength, tensile strength, elastic modulus, and mix proportion has been built. On this basis, using the widely used shrinkage and creep models, the functional relationship between the concrete cracking risk coefficient and the mix proportion is derived, and finally genetic algorithm is used to optimize the concrete mix proportion to improve its crack resistance. The research results showed that, compared with the control concrete, the cracking risk coefficient of the optimized concrete was reduced by 25%, and its crack resistance was significantly improved.
Introduction
The characteristics of high-strength concrete are the low water-binder ratio and the extensive use of mineral admixtures. Therefore, compared with ordinary concrete, high-strength concrete has the properties of rapid early hydration, rapid internal temperature rise, rapid reduction of internal humidity, and large shrinkage, which leads to very prominent early cracking phenomenon (Yun-sheng et al., 2002). The early cracking of concrete seriously reduces its durability and safety, so it is of great significance to prevent early cracking of concrete (Bentz et al., 1999; Wittmann, 2002; Liu et al., 2012).
There are many factors that may affect the cracking of concrete, such as its compressive and tensile strength, elastic modulus, shrinkage, and creep (Zhang et al., 2012; Huang et al., 2020; Li et al., 2020; Xin et al., 2020). Bruce Menu studied the effect of shrinkage of concrete on cracking. He found that when the water-to-binder ratio decreases, the shrinkage of concrete increases as well as the risk of cracking (Menu et al., 2020). Inamullah Khan found that the creep coefficient has a significant impact on the cracking risk of concrete. The higher the creep coefficient, the lower the cracking risk of concrete (Khan et al., 2019). Bendimerad et al. (2020) have observed the same phenomenon. The concrete mix proportion determines its performance (Li et al., 2019). In order to reduce the cracking risk of concrete, it is an effective method to directly optimize the mix proportion. However, the current methods to improve the crack resistance of concrete are mainly use of internal curing and incorporation of fibers (Schroefl et al., 2012; Feng et al., 2019). The research on the optimization of concrete mix proportion is urgently needed.
Artificial neural networks (ANN) have already been applied in the field of concrete research, mainly to predict various properties of concrete (Yeh, 2007; Far et al., 2009; Mangalathu et al., 2018; Abellan Garcia et al., 2020). For example, Chithra applied regression analysis and ANN, respectively, to predict the compressive strength of concrete mixed with copper slag. The results show that results predicted by ANN were more accurate (Chithra et al., 2016). Xu et al. (2019) used ANN to predict the performance of recycled aggregate concrete under triaxial loads. Zhou et al. (2020) used ANN to predict the interface bond strength between fiber and concrete. It has been found that the prediction results of the ANN had high accuracy and good application effects. Many studies have shown that it is feasible to predict the performance of concrete through ANN.
Genetic algorithm (GA) is a parallel random search optimization that combines the principles of biological evolution and genetic mechanism. As a kind of biological modeling algorithm, GA has the advantages of global search, which consideration of whether the function is continuous, differentiable and derivable is unnecessary. Therefore, GA has been put into extensive use in various fields (Shahnewaz et al., 2016; Chowdhury and Garai, 2017). In the field of concrete, GA is often used to optimize the mix proportion of concrete. Considering the cost, strength, workability and carbonation durability of concrete, Wang (2019) used GA to optimize the content of fly ash and mineral powder, and obtained satisfactory results. Lee et al. (2009) applied GA to optimize the mix proportion of concrete, which reduced the price of unilateral concrete. Rita et al. (2018) also optimized the concrete mix proportion by GA to reduce the project cost. However, there are only few reports on the use of GA to optimize the mix proportion of concrete in order to improve crack resistance.
This paper optimizes the mix proportion of concrete based on orthogonal test, ANN and GA to improve its cracking resistance. First, orthogonal tests are used to determine the effects of concrete components on slump, compressive strength, tensile strength, and elastic modulus. Then ANN is used to predict the above properties. Based on the results of orthogonal test and ANN prediction, the functional relationship between concrete slump, compressive strength, tensile strength, and elastic modulus and the mix proportion was fitted. On this basis, shrinkage and creep models are used to derive the functional relationship between the concrete cracking risk coefficient and the mix proportion. In the end, GA is used to optimize the concrete mix ratio to proportion its crack resistance.
Materials and Methods
Material
The cement used is PO42.5 Portland cement and its compressive strength of 28 days is 47.3 MPa. The type of fly ash is Class F Class I, while the water demand ratio is 88%. The slag grade is S95 and its 7 days activity index is 78%. The pozzolanic activity index of silica fume is 120%. The chemical composition of cement, fly ash, slag, and silica fume is shown in Table 1. The fine aggregate is made of finely graded river sand with a fineness modulus of 2.65. The coarse aggregate is made of continuously graded calcareous gravel with a particle size of 5–20 mm. The type of water reducing agent is polycarboxylate superplasticizers with a water reduction rate of 33%.
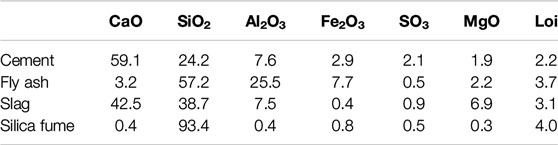
TABLE 1. The chemical components of cementitious materials (wt%).
Concrete Mix Proportion
The goal is to prepare concrete with its compressive strength above 60 MPa. In order to establish a mathematical model between the performance of concrete and its mix proportion, six factors affecting the mix proportion have been determined, expressed as x1–x6: water to binder ratio (x1), sand ratio (x2), the amount of cement per cubic meter of concrete (x3), the ratio of fly ash mass to cementitious materials mass (x4), the ratio of slag mass to cementitious materials mass (x5), and the ratio of silica fume mass to cementitious materials mass (x6). In order to effectively analyze the influence of various factors on the performance of concrete, orthogonal experiments are used. Since each factor is selected at five levels, a total of 25 sets of experiments are designed. The concrete mix proportion is shown in Table 2. The mass of polycarboxylate superplasticizers in all proportions is 2.4% of the mass of cementitious materials.
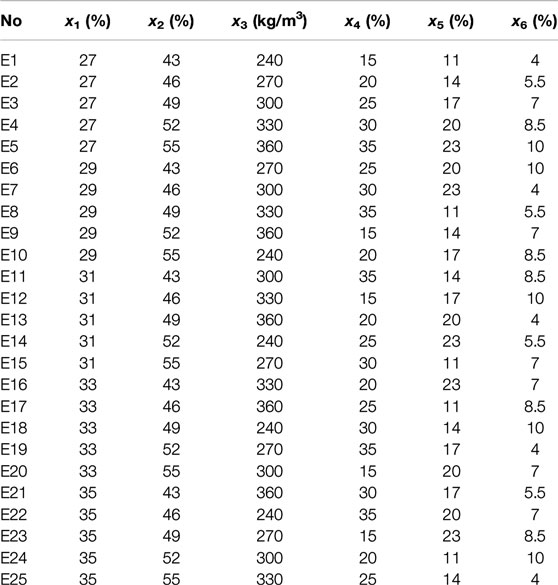
TABLE 2. Concrete mix proportion.
Method
Slump, Strength, and Elastic Modulus
The slump is measured in accordance with the test method in “Standard for test method of performance on ordinary fresh concrete” (GB/T 50080-2016). Compressive strength, tensile strength, and modulus of elasticity are determined in accordance with the test methods in “Standard for test methods for mechanical properties on ordinary concrete” (GB/T 50081-2016). The size of the sample used in the compressive strength test is 100 × 100 × 100 mm. The size of the sample used in the tensile strength and elastic modulus test is 100 × 100 × 300 mm. The loading rate of compressive strength test and tensile strength test is 0.8 MPa/s.
Shrinkage and Creep
The test method of shrinkage and creep refers to the “Standard for test methods of long-term performance and durability of ordinary concrete” (GB/T 50082-2009). The size of the sample for shrinkage test is 100 × 100 × 515 mm. The size of specimen for creep test is 100 × 100 × 400 mm, while the loading stress is 40% of its compressive strength. The curing temperature for shrinkage and creep is 20 ± 2°C, and the relative humidity is 65%. The drying shrinkage test and creep test were carried out when the concrete age was 1 day. The creep performance of concrete is usually expressed in terms of the creep coefficient and its calculation method is shown in Eq. 1:
where
Early Cracking Test
A slab cracking frame is used to detect the cracking of concrete, as shown in Figure 1. The size of the slab cracking frame is 800 × 600 × 100 mm. The side plates, bolts and are applied to fix the steel formwork of the cracking frame, as well as the crack inducer to induce the early concrete cracking caused by shrinkage.
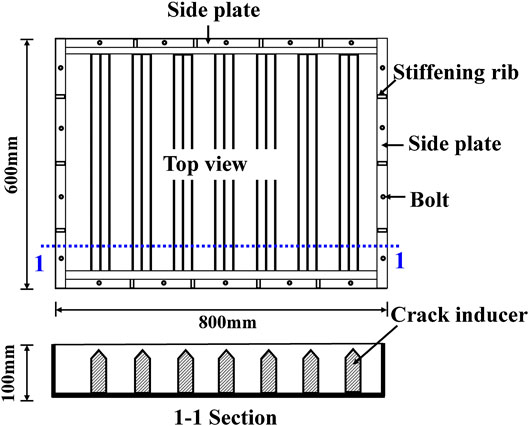
FIGURE 1. Schematic diagram of slab cracking frame test.
Prediction of Concrete Properties by Artificial Neural Networks
Artificial Neural Networks Calculation Process
The process of ANN is shown in Figure 2A. First, the system assigns weights to each group of input data. Then trains according to the set parameters to calculate the predicted value. After that, calculate the error between the predicted value and the test value. If the error meets the requirements, the predicted value is output. If the error is too large, the system resets weights and re-predict until the error meets the requirements. The simplest forward artificial neural network could be divided into three layers: input layer, hidden layer, and output layer, as shown in Figure 2B. The role of the input layer is to input data. Hidden layer is for data analysis and calculation. Output layer is to output predicted values. Calculation method of the ANN is explained in detail by following.
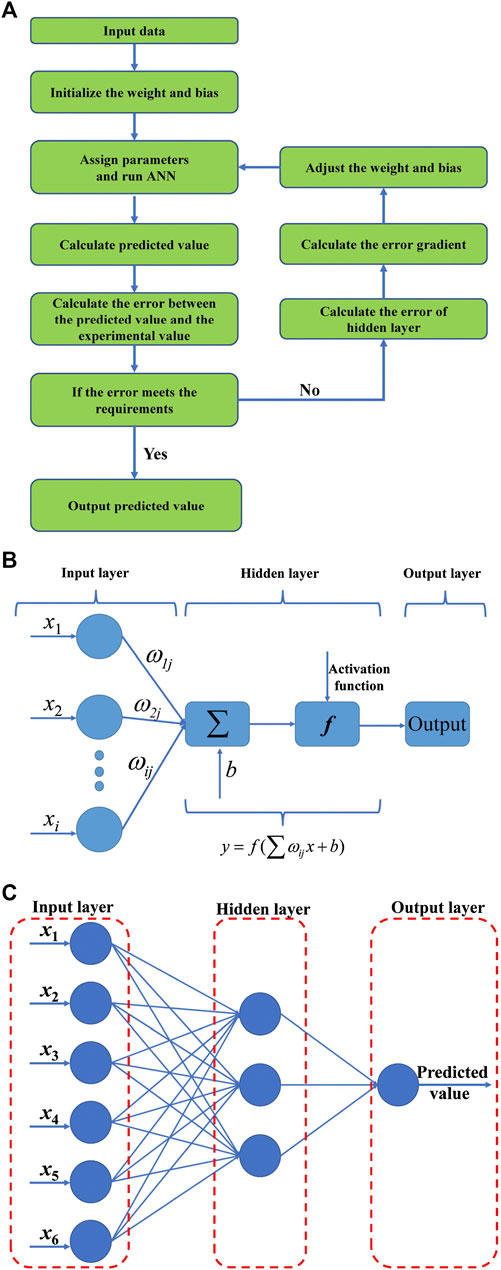
FIGURE 2. The process and models of ANN. (A) the process of ANN, (B) a typical neuron Model, (C) the ANN model used in the test.
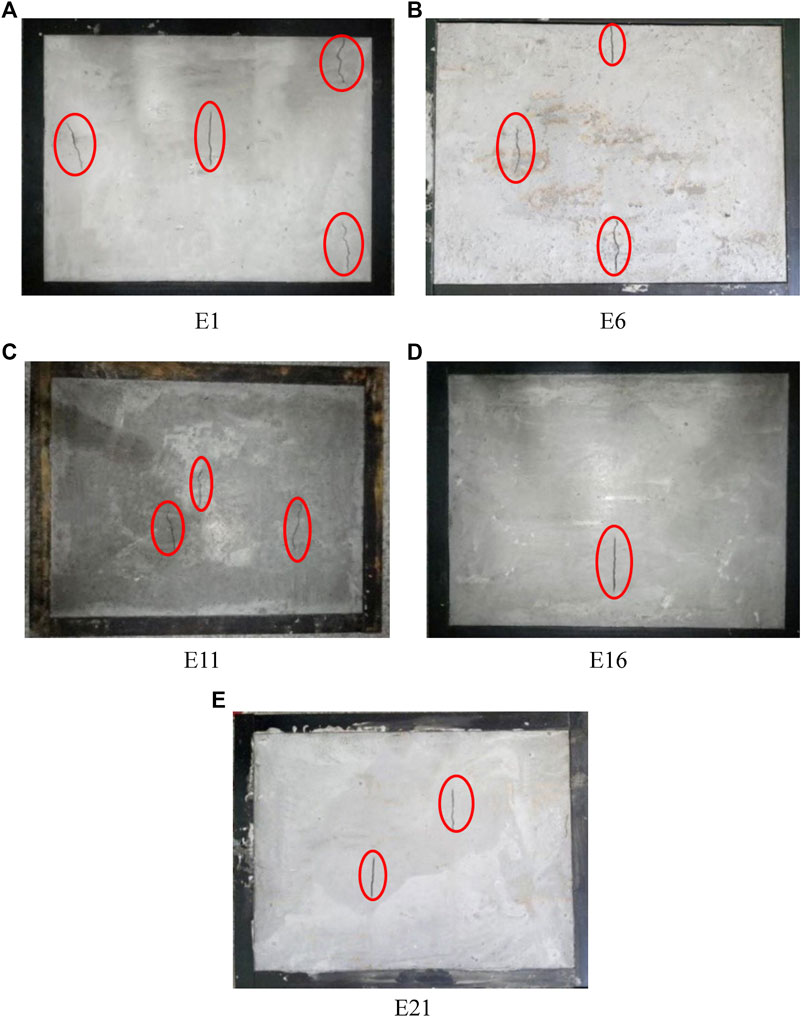
FIGURE 3. Cracking state of concrete at the age of 3 days. (A) E1, (B) E6, (C) E11, (D) E16, (E) E21.
Processing of Input Data
When the magnitude of each group of input data differs greatly, the accuracy of the system’s prediction is reduced. Therefore, in order to avoid this situation, it is necessary to normalize the input data on each neuron. The data is converted to [0,1], as shown in Eq. 2 (Yan and Lin, 2016).
where
Weights and Activation Function
Based on the characteristics of neurons, it is needed to assign weights to input data and set activation functions (also known as transfer function).
The sum of data is expressed by weight and input data, as shown in Eq. 3.
where
After the neuron receives the information, data needs to be processed and transmitted. At this time, an activation function needs to be set to output data. The general form of the activation function is shown in Eq. 4.
where
Commonly used activation functions are Purelin function (Eq. 5), Sigmoid function (Eq. 6), Tansigmoid (Eq. 7) function, and Relu function (Eq. 8).
Training: When the predicted value calculated by the system is not equal to the expected value, an error Eerror occurs. The weight between the input layer and the hidden layer is
According to Eq. 9, the error is determined by the weight of each layer. Therefore, training is a process which continuously adjusts the weight of each layer to make the error meet the requirements. The principle of weight adjustment is to reduce the error. Therefore, the adjustment of the weight is proportional to the gradient of the error, see Eqs 10 and 11.
where
Artificial Neural Networks Model Establishment
It can be seen from Artificial Neural Networks Calculation Process that the model first requires the ANN structure, which is the number of nodes in each layer (the number of neurons) and the number of hidden layers. For the prediction of concrete performance, a simple ANN structure of three layers can meet the requirements (Ji et al., 2006). The experiment set six variables, so the number of nodes in the input layer is 6. Although it is necessary to predict multiple properties of concrete, only one type is predicted at a time. Therefore, the number of nodes in the output layer is 1. The number of nodes in the hidden layer can be determined by Eq. 12 (Peng and Gao, 2018). In this case, the number of nodes in the hidden layer is 3. The ANN model used in the test is shown in Figure 2C, where x1–x6 represent the water to binder ratio, sand ratio, the amount of cement per cubic meter of concrete, the ratio of fly ash mass to cementitious materials mass, the ratio of slag mass to cementitious materials mass and the ratio of silica fume mass to cementitious materials mass, respectively.
Where m is the number of hidden layer nodes, and n is the number of input layer nodes.
The weight is set to a value between [−1,1]. For the prediction of concrete performance, many studies have shown that the Tansigmoid function has good applicability (Yan et al., 2017). Therefore, this paper chooses the Tansigmoid function as the activation function. The learning efficiency is an empirical value, which is 0.1 in this paper (Yan and Lin, 2016).
Performance Assessment Indices
The performances of ANN prediction are usually evaluated by Mean Absolute Error (MAE), Mean Square Error (MSE), Root Mean Square Error (RMSE), and Correlation Coefficient (R2), which is shown in Eqs 13–16. MAE demonstrates the residual error between the target values and predicted values for each data set. MSE demonstrates the mean of the sum of squares of the errors of the target values and predicted values. RMSE demonstrates the square root of average residual error between the target values and predicted values for each data set. The smaller the MAE, MSE, and RMSE, the larger R2, the better the prediction performance of ANN.
where
Artificial Neural Networks Prediction Results
Table 3 shows the test results and ANN prediction results of all the 25 groups of concrete properties in Concrete Mix Proportion. In the table, Exp represents the test results and Pre represents the ANN prediction results. Table 4 shows the MAE, MSE, RMSE, and R2 values of slump, compressive strength, tensile strength, elastic modulus, and shrinkage. For each performance, the error between the predicted value and the test value was very small and R2 was above 0.94, which shows that ANN has very high accuracy in predicting concrete performance.
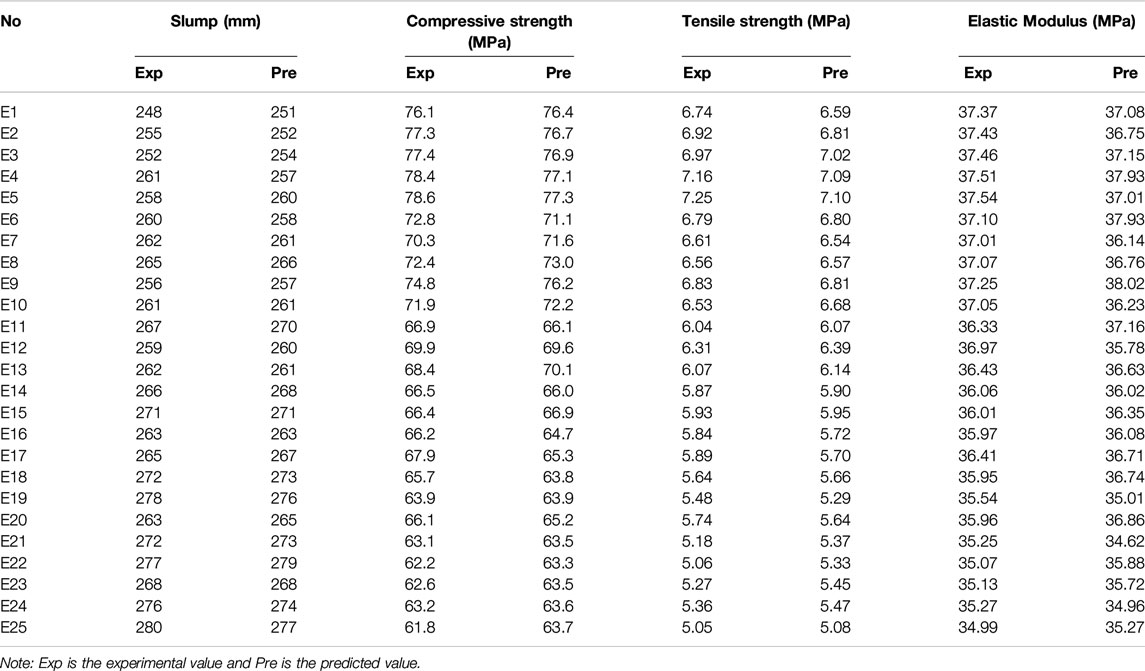
TABLE 3. Concrete performance test results and ANN prediction results.
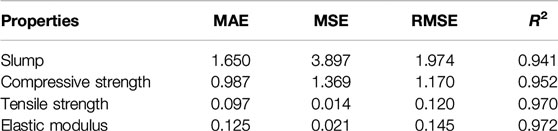
TABLE 4. Assessment indices for prediction.
Optimization Concrete for Crack Resistance by Genetic Algorithm
Mathematical Model Between Concrete Performance and Mix Proportion
The objection of this paper was to improve crack resistance of concrete, thus we should find a criterion to evaluate it firstly. According to the concrete cracking criterion (Bendimerad et al., 2016), the cracking risk coefficient η is used to evaluate the early anti-cracking performance of concrete, as shown in Eq. 17:
where
Studies have shown (Andrade et al., 1999; Gao et al., 2013) that the effective shrinkage strain is the result of the combined effect of concrete shrinkage strain and creep strain (the strain produced by concrete creep), as shown in Eq. 18:
where
Bentz (2008) believes that the relationship between creep strain and effective shrinkage strain can be expressed by the creep coefficient, as shown in Eq. 19:
where
Therefore, the relationship between the effective shrinkage strain
Substituting Eq. 20 into Eq. 17, the concrete early cracking risk prediction model shown in Eq. 21 is obtained.
Therefore, η is affected by elastic modulus, tensile strength shrinkage and creep coefficient s.
To apply GA to optimize concrete mix, a mathematical model between concrete performance and mix proportion is required. The result of GA optimization is highly dependent on the accuracy of the mathematical model. Therefore, a large amount of data is required for fitting to ensure the accuracy of the model. Many studies use literature data for fitting. However, since the composition of concrete and the performance of materials varies greatly, using other research's data may result in large errors. In Prediction of Concrete Properties by ANN, we showed that ANN has a very high accuracy in predicting concrete performance. Therefore, 81 sets of experiments based on the principle of orthogonal experiment were designed. ANN is applied to predict the slump and compressive strength, tensile strength and elastic modulus. The concrete mix proportion and ANN prediction results are shown in Supplementary Material.
Based on the test and ANN prediction results, the mathematical model between slump, compressive strength, tensile strength, elastic modulus and mix ratio parameters is obtained by multiple linear fitting method. Many factors affect shrinkage and creep. There are many factors affecting shrinkage and creep, and the fitting is difficult. Therefore, the functional relationship between shrinkage and creep and concrete mix proportion is derived based on the existing formula. Thus, the functional relationship between cracking risk coefficient and concrete mix proportion is obtained according to Eq. 21.
Mathematical Models of Slump, Compressive Strength, Tensile Strength and Elastic Modulus
Studies have shown that the slump, compressive strength, tensile strength and elastic modulus of concrete have a linear relationship with the mix proportion, as it is shown in Eq. 22. a0–an are the coefficients to be fitted, and x represents the concrete mix proportion (Lim et al., 2004).
Therefore, based on the results from experiments and ANN predictions, a multiple linear fit is performed on Eq. 17. The fit results and R2 are shown in Table 5. The R2 of all fitting results is greater than 0.950, indicating that the fitted formula has very high accuracy.
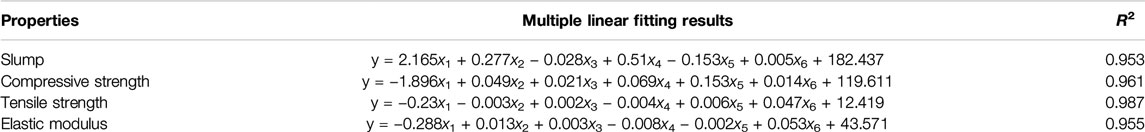
TABLE 5. Multiple linear fitting results between concrete properties and mix proportion.
Mathematical Model of Shrinkage
Shrinkage is affected by many factors. It is nearly impossible to use multiple linear fitting to obtain the relationship between shrinkage and mix proportion. At present, there are many widely used shrinkage models, such as EN 1992-2-2:2005 model, CEB-FIP (MC 2010) model, Bazant-Panula model and Dilger model. Among them, Dilger model is suitable for high performance concrete with water to cement ratio ranging from 0.15 to 0.40 and using superplasticizer and silica fume, which is consistent with the type of concrete studied in this paper. Therefore, Dilger model is used in this paper (Gilliland and Andrew, 2000).
The Dilger model divides the total shrinkage into two parts: basic shrinkage and drying shrinkage, as shown in Eqs 23–25.
where
RH is the relative humidity, which 60% has been applied, therefore
Mathematical Model of Creep
Creep is also affected by many factors (Geng et al., 2018). There are many creep models such as CEB-FIP (1990) model, EN 1992-1-1:2004, ACI-209R model, etc. The CEB-FIP (1990) model contains many parameters with a wide range of applications. Therefore, it is applied in this paper (Betonbau, 2013) as shown in Eq. 27.
where
RH is relative humidity, which in this article is 65%; A is the cross-sectional area of the member; u is the perimeter of the member exposed to the air; Based on the equations above, the relationship between concrete creep coefficient and mix proportion can be derived (Eq. 28):
Mathematical Model of Cracking Risk Coefficient
The calculation of cracking risk coefficient is shown in Eq. 21.
where
Therefore, the cracking risk coefficient can be expressed as a function of concrete mix proportion and age:
Model Validation
The relationship between tensile strength, elastic modulus, shrinkage, creep coefficient, cracking risk coefficient and concrete mix ratio and age are all derived from existing models. In order to verify the accuracy of the model, select E1, E6, E11, E16, E21 five groups of mix proportion from Table 2 to test. The performance of each group of 3 and 7 days are measured and compared with the predicted value of the model. Results were shown in Table 6. When the concrete age is 3 days, the maximum errors between the experimental and predicted values of the tensile strength, elastic modulus, shrinkage, creep coefficient, and cracking risk coefficient of the five groups are 4.7, 3.8,4.4, 4.5, and 4.9%, respectively. When the concrete age is 7 days, the maximum errors between the experimental and predicted values of the tensile strength, elastic modulus, shrinkage, creep coefficient and cracking risk coefficient of the five groups are respectively 3.7, 4.4, 3.3, 3.8, and 3.8%. The errors between the experimental values and predicted values of various properties at different ages are all less than 5%, which indicates that the model established in this paper is accurate.
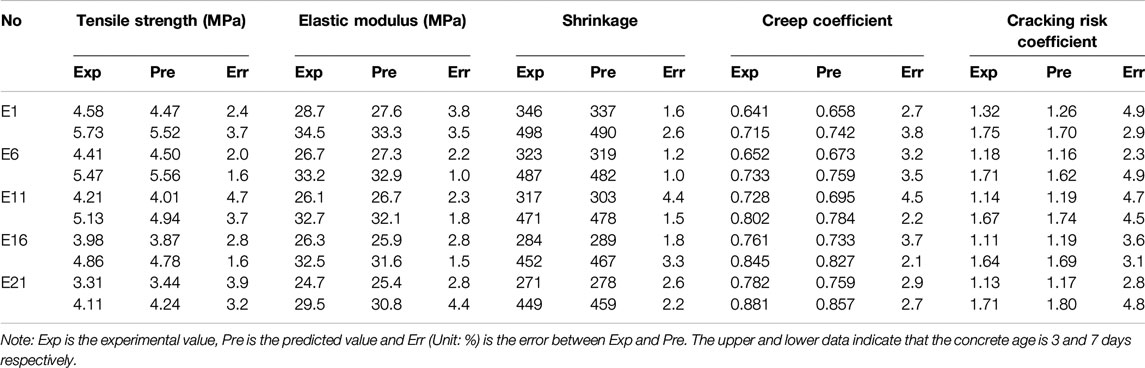
TABLE 6. Experimental value and predicted value of concrete properties at the age of 3 and 7 days.
The cracking risk factor was calculated by Eq. 28 from the tensile strength, elastic modulus, shrinkage rate, and creep coefficient, and the Results was shown in Figure 4. It is obvious that the cracking risk coefficient of the five groups of concrete with 3-day age is already greater than 1, Which means that the concrete cracks. Therefore, in order to verify the accuracy of the calculation results, the five groups were tested with a slab-plate cracking frame to observe the cracking situation when the concrete reached an age of 3 days, and the results were shown in Table 6. There were cracks circled with red ellipse in the five groups of concrete, indicating that the calculation results of the cracking risk coefficient were accurate.
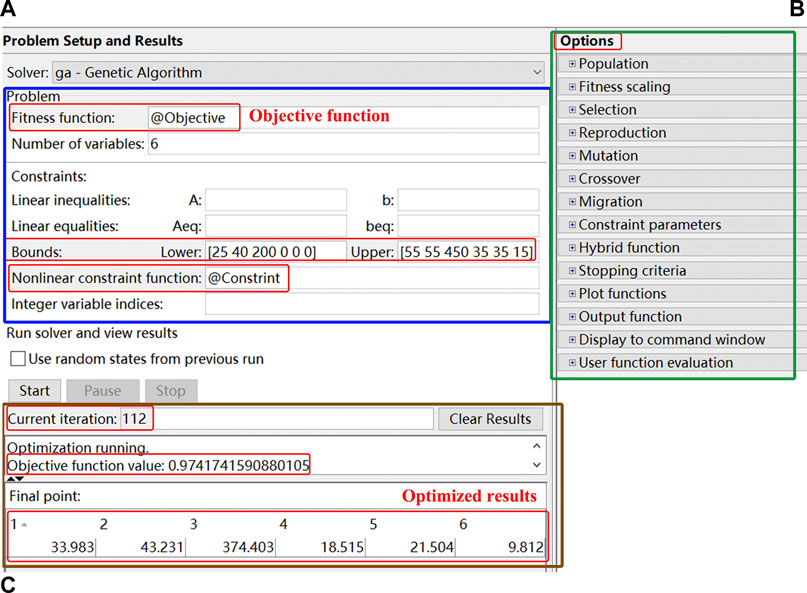
FIGURE 4. Application of genetic algorithm toolbox.
Model Establishment of Genetic Algorithm
After building the mathematical model between concrete performance and mix proportion, the objective function and constraint function are further determined, after which GA can be used to optimize concrete mix proportion. The process of GA is shown as following. First create a population, then calculate the fitness of each individual. Continue to evolve through selection, crossover and mutation, which finally leads to the optimal solution.
The purpose of this paper is to improve the anti-cracking performance of high-strength concrete. In this case, the cracking risk coefficient is taken as the objective function. It can be seen from Mathematical Model Between Concrete Performance and Mix Proportion that the concrete has cracked at the age of 3 days, thus the crack resistance performance of the concrete with the age of 3 days is optimized. It is necessary to meet the requirements of slump and strength while improving the crack resistance. Therefore, the slump and strength are taken as the constraint function. The design slump is greater than 260 mm and the strength is greater than 60 MPa. The independent variable is x1-x6, and their range of values is shown in Table 7.
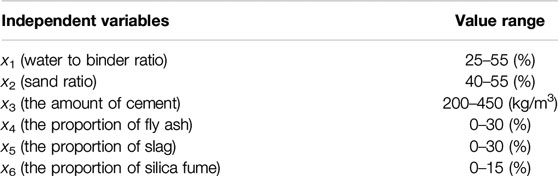
TABLE 7. Range of independent variables.
GA toolbox is used to optimize concrete mix proportion, as shown in Figure 4. The objective function, constraint function, number of variables, and variable value range are set in the A area. The selection method, crossover probability, and mutation probability are set in the B area, and in the calculation process, keep the default settings for the parameters in Options. The selection function is uniform, and the method of crossover and mutation is constraint dependent. The number of iterations and optimization results are displayed in the C area.
Genetic Algorithm Optimization Results
When applying genetic algorithm to optimize the mix proportion, the variation of the cracking risk coefficient with the number of evolutions is shown in Figure 5. The cracking risk coefficient dropped sharply in the first few generations, while basically stabilized after 50 generations of evolution, and stopped when the final number of evolutions was 121. The minimum value of the cracking risk coefficient was 0.974.
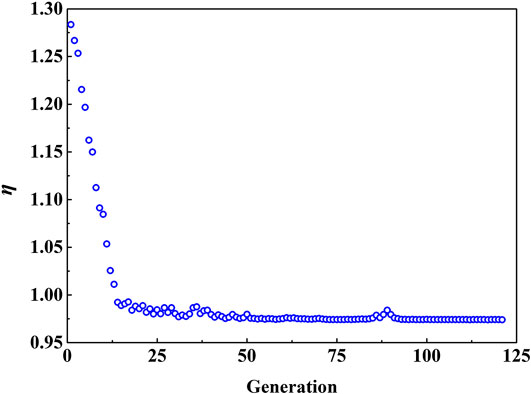
FIGURE 5. Changes of cracking risk coefficient with evolution times.
In order to compare the change of concrete performance after optimization, a group of concrete proportion commonly used in engineering is used as the control. Table 8 shows the mix proportion of engineering concrete (named Control) and optimized concrete (named Optimal). Through experiments, the mechanical properties such as the compressive strength and elastic modulus of the two groups of concrete were determined, the cracking risk coefficient was calculated and their results are shown in Table 9. The test result showed that the slump and strength of the optimized concrete are 262 mm and 71 MPa respectively, which meet the constraint conditions. The cracking risk coefficient of Control is 1.276, while that of Optimal is 0.951. The cracking risk coefficient of Optimal was reduced by 25% to less than 1 compared with that of Control, indicating that the concrete with an age of 3 days switched from the inevitable cracking state to the state that may not crack. The optimization effect is obvious. Figure 6 shows the slab-plate cracking frame test of Control and Optimal. There were many cracks in the Control, while Optimal had not cracked, indicating that the crack resistance of the optimized concrete was significantly improved and the optimization goal were achieved.
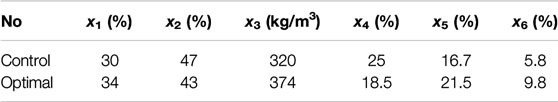
TABLE 8. Mix proportion of Control and Optimal.

TABLE 9. Performance comparison between control and optimal.
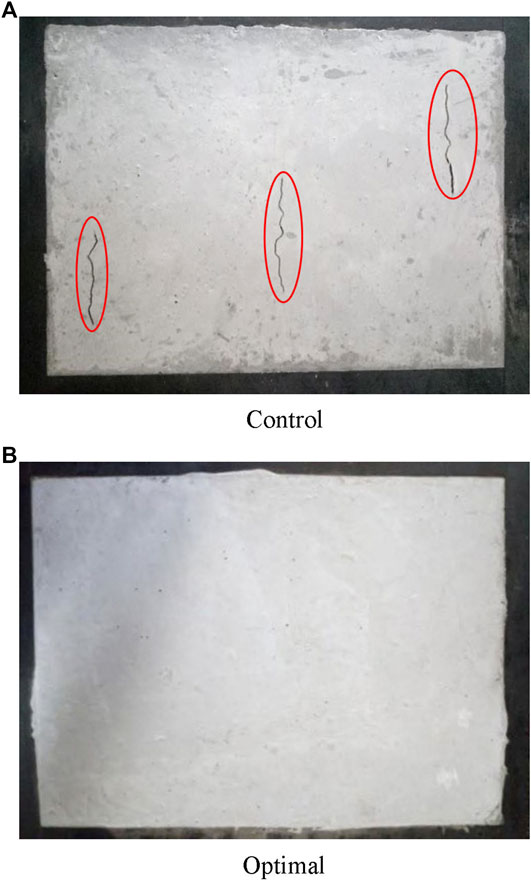
FIGURE 6. Cracking states of control and optimal at the age of 3 days. (A) Control; (B) Optimal.
Conclusion
(1) ANN is applied to predict concrete slump, compressive strength, tensile strength and elastic modulus. Errors between the predicted value and the test value were very small and R2 was above 0.94, indicating that ANN is very accurate in concrete performance prediction.
(2) Based on the test results and ANN prediction results, the functional relationship between slump, compressive strength, tensile strength and elastic modulus and concrete mix proportion was established. Based on the existing shrinkage and creep models, the functional relationship between the shrinkage, creep coefficient and cracking risk coefficient and the concrete mix proportion was derived. The error between the test value and the model prediction value is within 5%, indicating the accuracy of the model.
(3) GA is used to optimize the concrete mix proportion to improve its crack resistance. The research results show that the cracking risk coefficient of the optimized concrete is significantly reduced compared with the that of commonly used engineering concrete. The established GA optimized concrete mix design method has a good applicability.
Data Availability Statement
The raw data supporting the conclusions of this article will be made available by the authors, without undue reservation, to any qualified researcher.
Author Contributions
YL contributed conception and research method of the study. HL was responsible for testing and organizing the database. NL performed the statistical analysis. CJ wrote the first draft of the manuscript. All authors contributed to manuscript revision, read and approved the submitted version.
Funding
We declare all sources of funding received for the research being submitted. National Natural Science Foundation of China (51808015); National Key R&D Program of China–Key Materials and Preparation Technology of high crack resistant ready-mixed concrete (2017YFB0310100).
Conflict of Interest
The authors declare that the research was conducted in the absence of any commercial or financial relationships that could be construed as a potential conflict of interest.
Supplementary Material
The Supplementary Material for this article can be found online at: https://www.frontiersin.org/articles/10.3389/fmats.2020.590661/full#supplementary-material
References
Abellán García, J., Fernández Gómez, J., and Torres Castellanos, N. (2020). Properties prediction of environmentally friendly ultra-high-performance concrete using artificial neural networks. Eur. J. Environ. Civ. En. 26, 1–25. doi:10.1080/19648189.2020.1762749
Andrade, C., Sarrı́a, J., and Alonso, C. (1999). Relative humidity in the interior of concrete exposed to natural and artificial weathering. Cement Concr. Res. 29 (8), 1249–1259. doi:10.1016/s0008-8846(99)00123-4
Bendimerad, A. Z., Delsaute, B., Rozière, E., Staquet, S., and Loukili, A. (2020). Advanced techniques for the study of shrinkage-induced cracking of concrete with recycled aggregates at early age. Construct. Build. Mater. 233, 117340–117415. doi:10.1016/j.conbuildmat.2019.117340
Bendimerad, A. Z., Rozière, E., and Loukili, A. (2016). Plastic shrinkage and cracking risk of recycled aggregates concrete. Construct. Build. Mater. 121, 733–745. doi:10.1016/j.conbuildmat.2016.06.056
Bentz, D. P. (2008). A review of early-age properties of cement-based materials. Cement Concr. Res. 38 (2), 196–204. doi:10.1016/j.cemconres.2007.09.005
Bentz, D. P., Garboczi, E. J., Haecker, C. J., and Jensen, O. M. (1999). Effects of cement particle size distribution on performance properties of Portland cement-based materials. Cement Concr. Res. 29 (10), 1663–1671. doi:10.1016/S0008-8846(99)00163-5
Betonbau (2013). Fib model code for concrete structures Lausanne: Shanghai, China: International Federation for Structural Concrete.
Chithra, S., Kumar, S. R. R. S., Chinnaraju, K., and Alfin Ashmita, F. (2016). A comparative study on the compressive strength prediction models for High Performance Concrete containing nano silica and copper slag using regression analysis and Artificial Neural Networks. Construct. Build. Mater. 114, 528–535. doi:10.1016/j.conbuildmat.2016.03.214
Chowdhury, B., and Garai, G. (2017). A review on multiple sequence alignment from the perspective of genetic algorithm. Genomics 109 (5–6), 419–431. doi:10.1016/j.ygeno.2017.06.007
Far, M. S. S., Underwood, B. S., Ranjithan, S. R., Kim, Y. R., and Jackson, N. (2009). Application of artificial neural networks for estimating dynamic modulus of asphalt concrete. Transport. Res. Rec. 2127, 173–186. doi:10.3141/2127-20
Feng, J., Su, Y., and Qian, C. (2019). Coupled effect of PP fiber, PVA fiber and bacteria on self-healing efficiency of early-age cracks in concrete. Construct. Build. Mater. 228, 116810–116819. doi:10.1016/j.conbuildmat.2019.116810
Gao, Y., Zhang, J., and Han, P. (2013). Determination of stress relaxation parameters of concrete in tension at early-age by ring test. Construct. Build. Mater. 41, 152–164. doi:10.1016/j.conbuildmat.2012.12.004
Geng, G., Vasin, R. N., Li, J., Qomi, M. J. A., Yan, J., Wenk, H.-R., et al. (2018). Preferred orientation of calcium aluminosilicate hydrate induced by confined compression. Cement Concr. Res. 113, 186–196. doi:10.1016/j.cemconres.2018.09.002
Gilliland and Andrew, J. (2000). Thermal and shrinkage effects in high performance concrete structures during construction. Dissertation/Master’s thesis. Calgary (AB): University of Calgary.
Huang, L., Chen, Z., and Ye, H. (2020). A mechanistic model for the time-dependent autogenous shrinkage of high performance concrete. Construct. Build. Mater. 255, 119335–119410. doi:10.1016/j.conbuildmat.2020.119335
Ji, T., Lin, T., and Lin, X. (2006). A concrete mix proportion design algorithm based on artificial neural networks. Cement Concr. Res. 36 (7), 1399–1408. doi:10.1016/j.cemconres.2006.01.009
Khan, I., Xu, T., Castel, A., Gilbert, R. I., and Babaee, M. (2019). Risk of early age cracking in geopolymer concrete due to restrained shrinkage. Construct. Build. Mater. 229, 116840. doi:10.1016/j.conbuildmat.2019.116840
Lee, B. Y., Kim, J. H., and Kim, J.-K. (2009). Optimum concrete mixture proportion based on a database considering regional characteristics. J. Comput. Civ. Eng. 23 (5), 258–265. doi:10.1061/(asce)0887-3801(2009)23:5(258)
Li, J., Zhang, W., Li, C., and Monteiro, P. J. M. (2019). Green concrete containing diatomaceous earth and limestone: workability, mechanical properties, and life-cycle assessment. J. Clean. Prod. 223, 662–679. doi:10.1016/j.jclepro.2019.03.077
Li, J., Zhang, W., Li, C., and Monteiro, P. J. M. (2020). Eco-friendly mortar with high-volume diatomite and fly ash: performance and life-cycle assessment with regional variability. J. Clean. Prod. 261, 121224. doi:10.1016/j.jclepro.2020.121224
Lim, C.-H., Yoon, Y.-S., and Kim, J.-H. (2004). Genetic algorithm in mix proportioning of high-performance concrete. Cement Concr. Res. 34 (3), 409–420. doi:10.1016/j.cemconres.2003.08.018
Liu, J.-p., Tian, Q., and Miao, C.-w. (2012). Investigation on the plastic shrinkage of cementitious materials under drying conditions: mechanism and theoretical model. Mag. Concr. Res. 64 (6), 551–561. doi:10.1680/macr.11.00037
Mangalathu, S., Heo, G., and Jeon, J.-S. (2018). Artificial neural network based multi-dimensional fragility development of skewed concrete bridge classes. Eng. Struct. 162, 166–176. doi:10.1016/j.engstruct.2018.01.053
Menu, B., Jolin, M., and Bissonnette, B. (2020). Assessing the shrinkage cracking potential of concrete using ring specimens with different boundary conditions. Adv. Mater. Sci. Eng. 2020, 1–13. doi:10.1155/2020/4842369
Peng, Z., and Gao, Y. (2018). Application of BP neural network in elevation fitting of underwater terrain. J. Chongqing Jianzhu Univ. 37 (11), 64–68. doi:10.3969/j.issn.1674-0696.2018.11.11
Rita, M., Fairbairn, E., Ribeiro, F., Andrade, H., and Barbosa, H. (2018). Optimization of mass concrete construction using a twofold parallel genetic algorithm. Appl. Sci. 8 (3), 399–418. doi:10.3390/app8030399
Schroefl, C., Mechtcherine, V., and Gorges, M. (2012). Relation between the molecular structure and the efficiency of superabsorbent polymers (SAP) as concrete admixture to mitigate autogenous shrinkage. Cement Concr. Res. 42 (6), 865–873. doi:10.1016/j.cemconres.2012.03.011
Shahnewaz, M., Machial, R., Alam, M. S., and Rteil, A. (2016). Optimized shear design equation for slender concrete beams reinforced with FRP bars and stirrups using Genetic Algorithm and reliability analysis. Eng. Struct. 107, 151–165. doi:10.1016/j.engstruct.2015.10.049
Wang, X.-Y. (2019). Optimal design of the cement, fly ash, and slag mixture in ternary blended concrete based on gene expression programming and the genetic algorithm. Materials 12 (15), 2448. doi:10.3390/ma12152448
Wittmann, F. H. (2002). Crack formation and fracture energy of normal and high strength concrete. Sadhana 27 (4), 413–423. doi:10.1007/BF02706991
Xin, J., Zhang, G., Liu, Y., Wang, Z., and Wu, Z. (2020). Evaluation of behavior and cracking potential of early-age cementitious systems using uniaxial restraint tests: a review. Construct. Build. Mater. 231, 117146. doi:10.1016/j.conbuildmat.2019.117146
Xu, J., Chen, Y., Xie, T., Zhao, X., Xiong, B., and Chen, Z. (2019). Prediction of triaxial behavior of recycled aggregate concrete using multivariable regression and artificial neural network techniques. Construct. Build. Mater. 226, 534–554. doi:10.1016/j.conbuildmat.2019.07.155
Yan, F., and Lin, Z. (2016). New strategy for anchorage reliability assessment of GFRP bars to concrete using hybrid artificial neural network with genetic algorithm. Compos. B Eng. 92, 420–433. doi:10.1016/j.compositesb.2016.02.008
Yan, F., Lin, Z., Wang, X., Azarmi, F., and Sobolev, K. (2017). Evaluation and prediction of bond strength of GFRP-bar reinforced concrete using artificial neural network optimized with genetic algorithm. Compos. Struct. 161, 441–452. doi:10.1016/j.compstruct.2016.11.068
Yeh, I.-C. (2007). Modeling slump flow of concrete using second-order regressions and artificial neural networks. Cem. Concr. Compos. 29 (6), 474–480. doi:10.1016/j.cemconcomp.2007.02.001
Yun-sheng, Z., Wei, S., Shu-guang, H., and Qing-jun, D. (2002). Performances of the high strength low heat pump concrete (HLPC). J. Wuhan Univ. Technol.-Mater. Sci. Ed. 17 (3), 56–59. doi:10.1007/BF02838541
Zhang, Y., Zhang, W., She, W., Ma, L., and Zhu, W. (2012). Ultrasound monitoring of setting and hardening process of ultra-high performance cementitious materials. NDT E Int. 47, 177–184. doi:10.1016/j.ndteint.2009.10.006
Keywords: optimum design, concrete mix proportion, crack resistance, artificial neural networks, genetic algorithm
Citation: Yue L, Hongwen L, Yinuo L and Caiyun J (2020) Optimum Design of High-Strength Concrete Mix Proportion for Crack Resistance Using Artificial Neural Networks and Genetic Algorithm. Front. Mater. 7:590661. doi: 10.3389/fmats.2020.590661
Received: 02 August 2020; Accepted: 03 September 2020;
Published: 05 October 2020.
Edited by:
Dongshuai Hou, Qingdao University of Technology, ChinaReviewed by:
Bing Chen, Shanghai Jiao Tong University, ChinaJiaqi Li, University of California, Berkeley, United States
Copyright © 2020 Yue, Hongwen, Yinuo and Caiyun. This is an open-access article distributed under the terms of the Creative Commons Attribution License (CC BY). The use, distribution or reproduction in other forums is permitted, provided the original author(s) and the copyright owner(s) are credited and that the original publication in this journal is cited, in accordance with accepted academic practice. No use, distribution or reproduction is permitted which does not comply with these terms.
*Correspondence: Jin Caiyun, jincaiyun@bjut.edu.cn