Influences of Global and Local Features on Eye-Movement Patterns in Visual-Similarity Perception of Synthesized Texture Images


1
Institute of Big Data Science and Industry, School of Automation and Software Engineering, Shanxi University, Taiyuan 030006, China
2
College of Information Science and Engineering, Ritsumeikan University, Kusatsu 525-8577, Japan
3
Faculty of Informatics, Kansai University, Takatsuki 569-1095, Japan
4
Faculty of Education, Hokkaido University of Education, Sapporo 002-8502, Japan
*
Author to whom correspondence should be addressed.
Appl. Sci. 2020, 10(16), 5552; https://doi.org/10.3390/app10165552
Submission received: 8 June 2020
/
Revised: 23 July 2020
/
Accepted: 6 August 2020
/
Published: 11 August 2020
(This article belongs to the Section Electrical, Electronics and Communications Engineering)
Abstract
:Global and local features are essential for visual-similarity texture perception. Therefore, understanding how people allocate their visual attention when viewing textures with global or local similarity is important. In this work, we investigate the influences of global and local features of a texture on eye-movement patterns and analyze the relationship between eye-movement patterns and visual-similarity selection. First, we synthesized textures by separately controlling global and local textural features through the primitive, grain, and point configuration (PGPC) texture model, a mathematical morphology-based texture model. Second, we conducted an experiment to acquire eye-movement data where participants identified the texture that was highly similar to the standard texture. Experiment data were obtained through an eye-tracker from 60 participants. The collected eye-tracking data were analyzed in terms of three metrics, including total fixation duration in each region of interest (ROI), fixation-point variance in each ROI, and fixation-transfer counts between different ROIs. Analysis results indicated the following. (1) The global and local features of a texture influenced eye-movement patterns. In particular, the texture image that was globally similar to the standard texture contained dispersed fixation points. By contrast, the texture image that was locally similar to the standard texture contained concentrated fixation points. The domination of global and local features influenced the viewers’ similarity choice. (2) The final visual-similarity selection was related to the fixation-transfer count between different ROIs, but not to the fixation time in each ROI. This research also extends the applicability of the mathematical morphology-based texture model to human visual perception.
1. Introduction
Whether human visual processing is dominated by holistic or analytic processing is a hot issue in the field of human cognition. Many researchers have investigated the influences of global and local features on visual perception. According to the hypothesis advocated by Navon [1], people perceive a forest before seeing its trees; this assertion emphasizes the precedence of the global features. Navon defined these effects as the “global precedence effect” (GPE) [2]. The GPE can be reduced or even reversed by factors such as task variables [3,4], sparsity between local features [5], the position of local elements, and the saliency of the global form [6] and the visual angle [7], and the meaningfulness of the stimuli [8,9]. Another remarkable aspect of global features is that human beings can understand the meaning of a complex novel scene very quickly, even when the image is blurred [10]. This quick recognition in a glance (about 200 ms) refers to the gist of the scene [11,12]. Although local features in the blurred image are missing, observers can identify the semantic category of each image, inferred from the spatial relationships between regions or blobs of a particular size and aspect ratio [13]. This emphasizes that global features (the spatial arrangement of regions) precede the analysis of local details for scene and object recognition, particularly in images constituted by many element patterns [14,15]. Other studies suggested that global and local processing can be influenced by several factors, such as training and viewing distance and prior knowledge. Dulaney and Marks [16] reported that global interference decreases with training, whereas local interference develops with training. Li et al. [17] noted that prior knowledge and viewing distance also affect global precedence in humans in tasks involving similarity selection.
At any given moment, we can selectively attend to our environment at the component level through local processing or at the holistic level through global processing. During the process of visual perception, global and local features differently influence our attention and then affect our visual perception patterns and manners, for example searching and detecting eye-movements in scenes [18]. Torralba et al. [19] proposed a computational instantiation of a Bayesian model of attention, demonstrating the mandatory role of scene context for search tasks in real-world images. They suggested that searching eye-movements are influenced by local image features (saliency) and global context features. Additionally, Najemnik and Geisler [20] compared the eye-movements of humans, maximum a posteriori (MAP), and idea searchers in tasks of visual search. Results demonstrated how humans actually select fixation locations in visual search. They also pointed out that eye-movements are directed toward locations with features similar to those of the target. Furthermore, Cheng et al. [21] investigated two kinds of eye-movement patterns in face recognition, holistic and analytic patterns. They also examined the link between eye-movement patterns and the engagement of global/local attention. Apparently, eye-movements are influenced by global and local features in visual perception.
Similarity perception, as a very important aspect of visual perception, plays an essential role in scene and object recognition [22,23]. It is regarded as one of the variables that affects global and local processing [24]. Therefore, visual perception manners and results are likely to be affected by global and local similarity. However, how global and local similarity affect human eye-movements when perceiving remains unknown and lacks intuitive data (i.e., eye-movement data) and corresponding quantitative analysis. Therefore, this paper seeks to answer two questions: (1) How do global and local features influence eye-movement patterns under similarity perception? (2) Are visual-similarity perception manners and results related to eye-movement patterns?
To address these questions, we utilized synthesized texture images as research stimuli. We generated synthesized textures through the primitive, grain, and point configuration (PGPC) texture model, a mathematical morphology-based method [25,26]. This model enables the independent characterization of global and local features. We synthesized textures by separately controlling global and local textural features. We then employed an eye-tracker to acquire eye-movement data when the subjects were viewing the synthesized texture scenes with the task of selecting textures similar to a standard texture (the texture being compared).
We statistically analyzed the eye-movement data in terms of three eye-fixation metrics: total fixation duration (TFD) in each region of interest (ROI), fixation-point variance (FPV) in each ROI, and fixation-transfer counts (FTCs) between different ROIs. We assumed that global and local features affected eye-movement patterns. We hypothesized that, if the global features of a texture were similar to those of the standard texture, then the fixation points in the texture would be highly dispersed. By contrast, if the local features of a texture were similar to those of the standard texture, then fixation points in the texture would be highly concentrated. We also verified that the final similarity choice was closely related to FTCs between ROIs of different textures viewed in the experiment.
Our research differs from conventional studies on visual perception. First, instead of artificial images (e.g., patterns or fabric images), the utilized textures in the eye-tracking experiment were synthesized by a mathematical morphology-based texture model. We artificially synthesized textures with the required features instead of simply analyzing and extracting features from the existing textures. Second, it was identified that viewing distance influences the visual perception of global and local texture features. Viewers are attracted to local features when viewing images from a short distance and to global features when viewing images from a long distance. In [17], a logistic-regression model was built to construct a statistical relationship between viewing distance and visual perception of global/local features. In this research, viewing distances in the visual-similarity experiment were determined according to the distance equation proposed in [17]. We then set different viewing distances to ensure the equal probability of similarity selection in the experiment.
2. PGPC Texture Model
Mathematical morphology is a theory of describing shapes. It is used to investigate the interaction between an image and a selected structuring element through the basic operations of erosion and dilation.
The PGPC texture model is a mathematical morphology-based model. It was first proposed in [25] and subsequently improved in [26,27,28]. The PGPC texture model represents a texture as an image composed of regular or irregular arrangement of grains. The grains are considerably smaller than the image, resemble one another, and are derived from one or a few typical objects called primitives. The PGPC texture model enables the independent characterization of primitive shapes and grain configurations.
In the PGPC texture model, nonempty texture image X is represented as:
where B is a primitive and represents the grains that are derived from n-times homothetic magnifications of the primitive B, with n being zero or a positive integer. This is usually defined as follows:
where ⊕ denotes a Minkowski set addition. This definition is, however, inconvenient since the difference between and (n + 1)B is too large if the original B is large. In this experiment, we used a single-sized structuring element (n = 1) as the grain for texture synthesis. is a point configuration (skeleton) that is a set indicating the pixel positions for locating grain . These locations were randomly generated, whereas the number and directional strength of the locations could be controlled. N is the maximal size of magnification.
The PGPC model can be used to synthesize different textures by controlling different primitives and skeletons. For the synthesized textures, the primitive or grains of a texture refer to local features, whereas the skeleton of a texture and grain-size distribution refer to global features. Therefore, global and local features can be separately modified in the PGPC texture model. In contrast to existing textures (e.g., Brodatz textures), those textures that were globally and locally similar could be synthesized through the PGPC texture model.
3. Experiment on Texture Perception with an Eye-Tracker
3.1. Stimuli and Apparatus
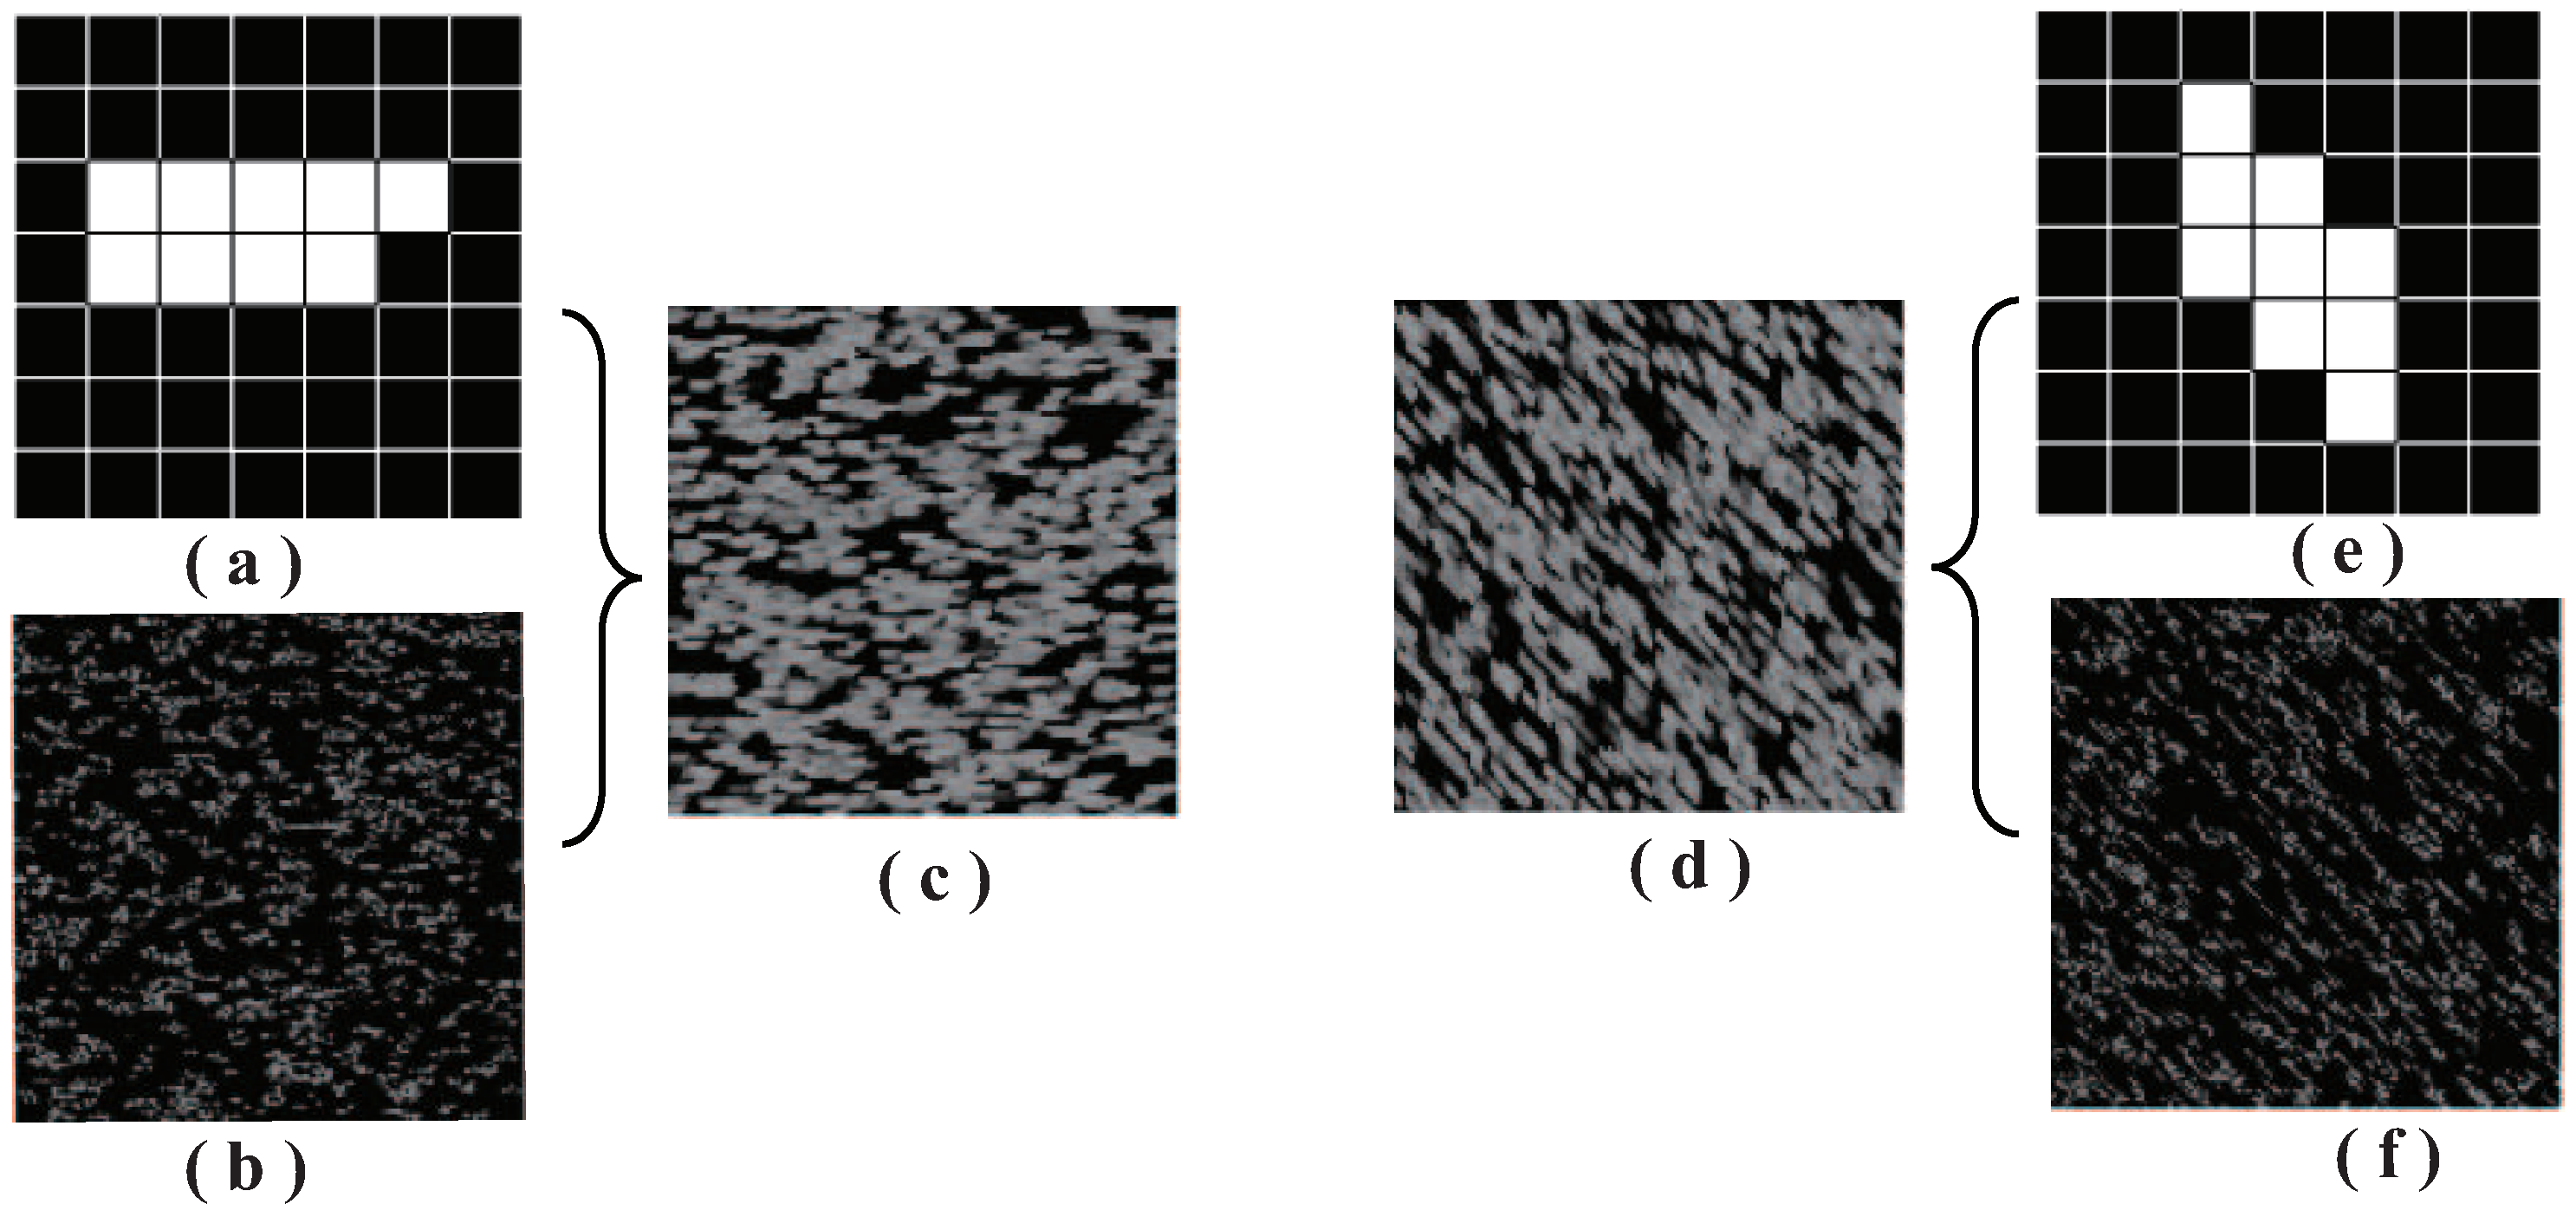
Stimuli: This research investigated the influences of global and local features on eye-movement patterns in texture visual-similarity perception. Therefore, textures that were globally and locally similar had to be synthesized for use in this research. We synthesized the textures by separately controlling local (grain) and global (skeleton) parameters using the PGPC texture model. Here, global parameters refer to the directionality and density of skeletons, and local parameters refer to the shapes of the grain. The synthesized textures, their grains, and their skeletons are shown in Figure 1. The different grains of Textures 1 (Figure 1a) and 2 (Figure 1e) generated different local features.
The skeleton of Texture 1 was created with horizontal strength (Figure 1b), and the skeleton of Texture 2 was created with diagonal strength (Figure 1f). Both skeletons had the same density, but different directionality.
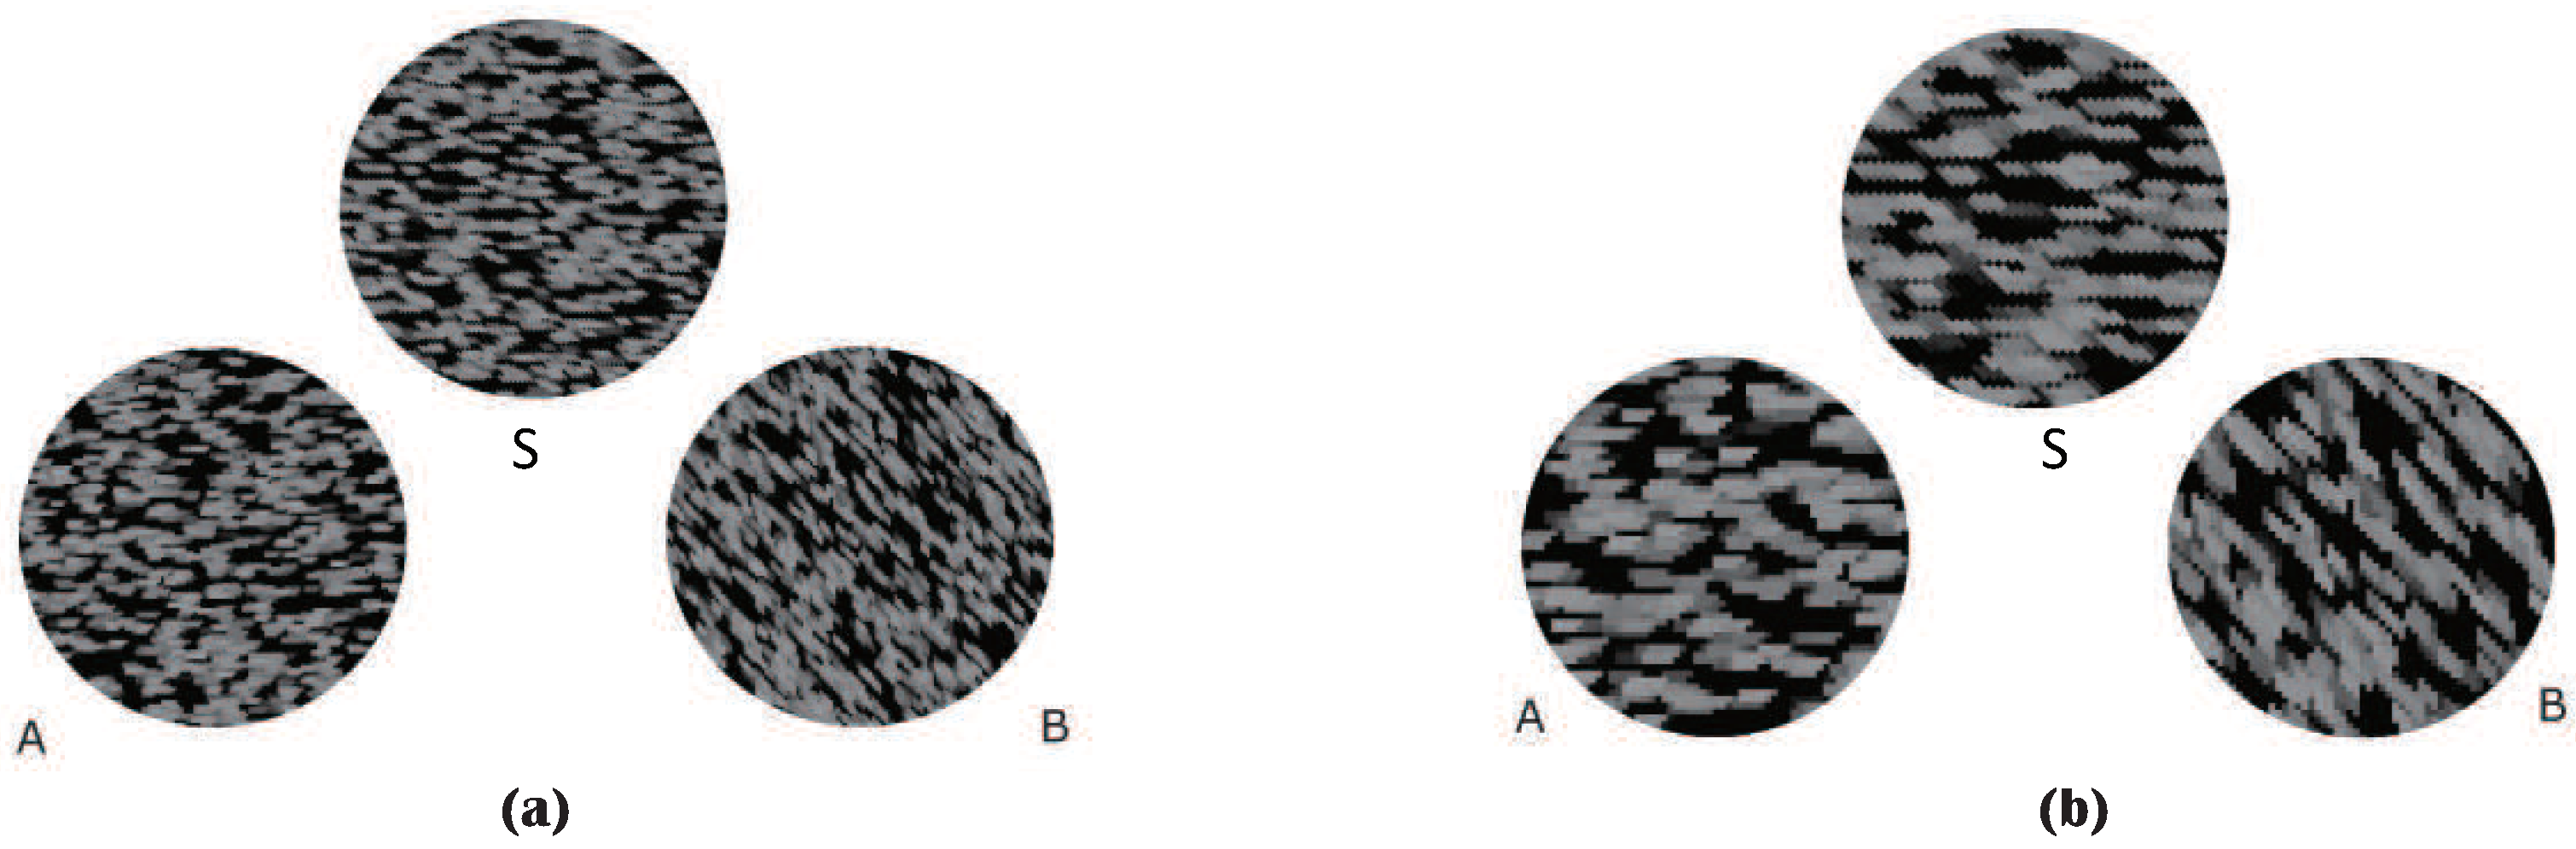
Synthesized textures (Figure 1c,d) were cropped into disks to reduce the visual effects of the horizontal and vertical borders of the texture frames. Using the two synthesized textures, we derived six texture stimuli and arranged them into two scenes, as shown in Figure 2. Synthesized Textures 1 and 2 were labeled as Textures A and B in Scene 1. Standard Texture S was derived by rotating Synthesized Texture 2 by counterclockwise (Figure 2a). Textures in Scene 2 are presented at twice the magnification (200% zoomed in view of Scene 1) of the respective textures in Scene 1 (Figure 2b). Thus, Texture S in both scenes had the same global features (directionality) as Texture A and the same local features (grains) as Texture B.
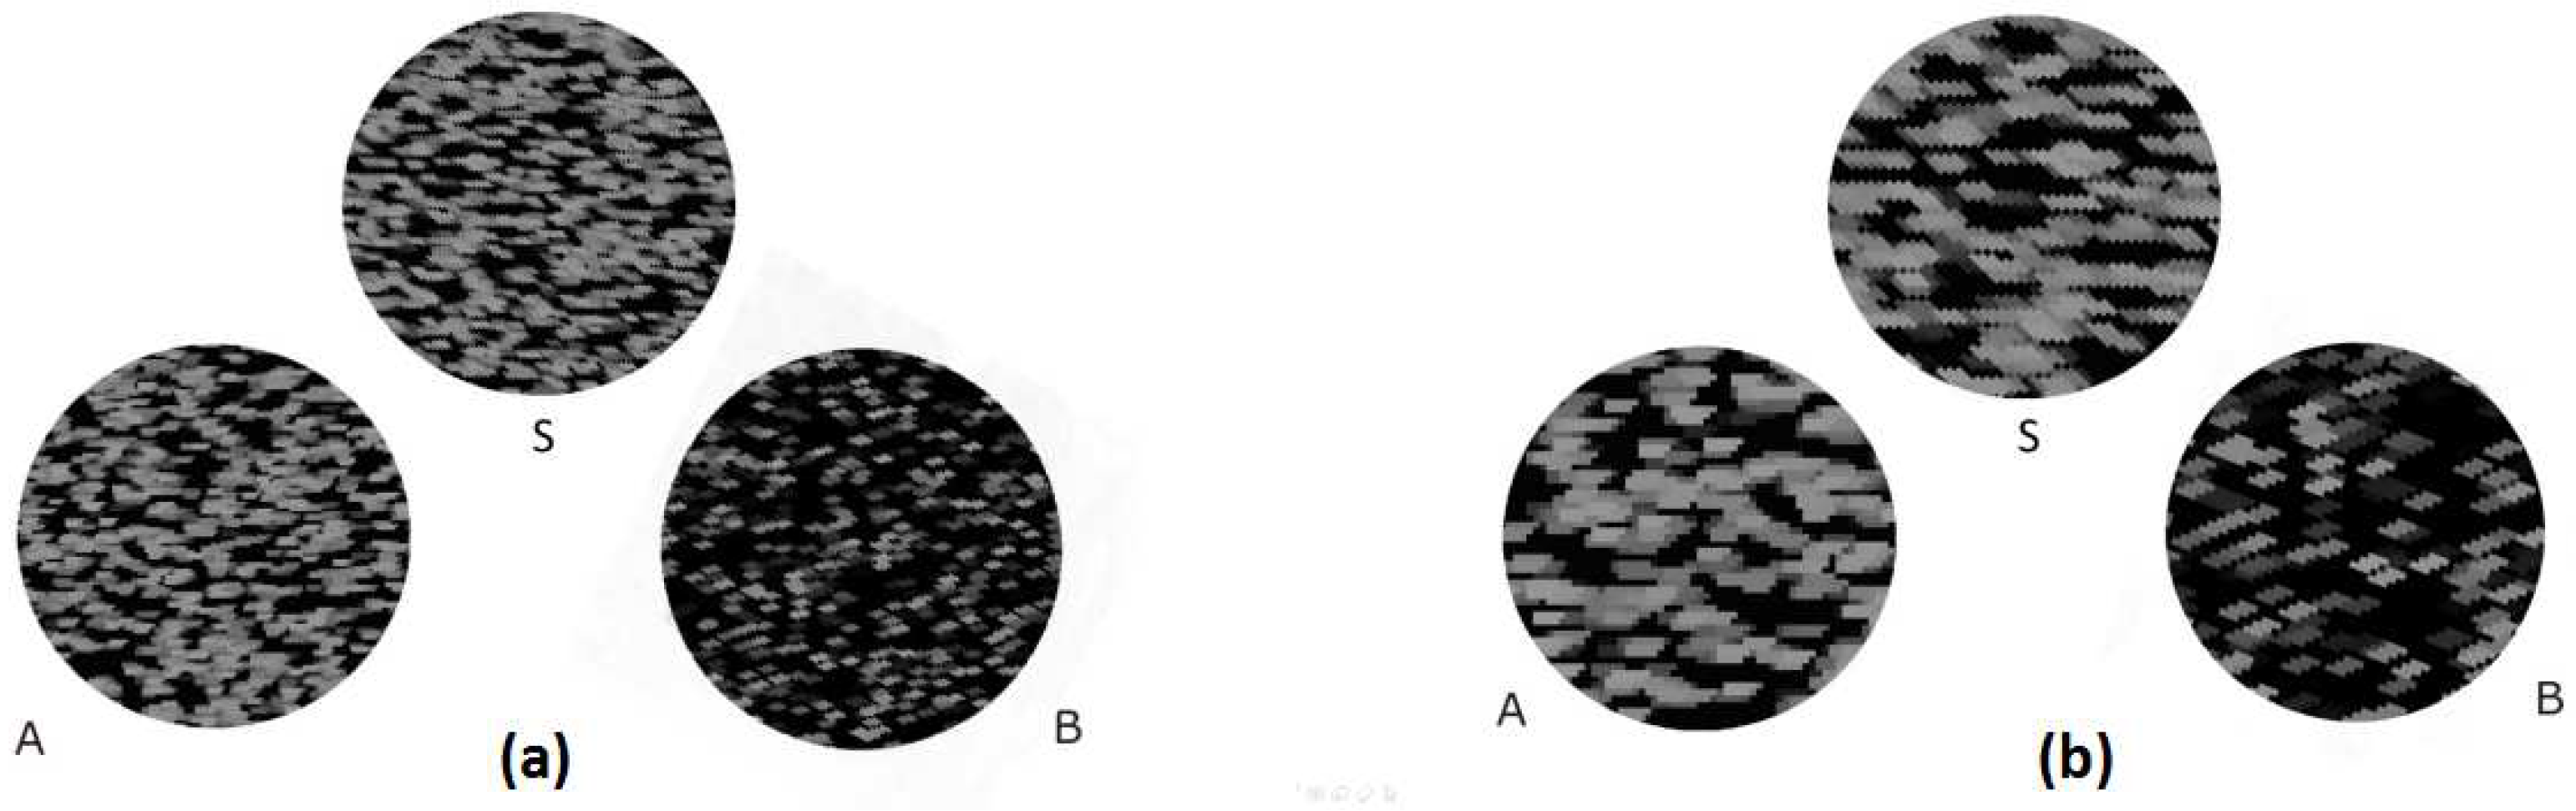
We synthesized the two other textures on the basis of the same idea as in the above synthesis procedure. The grains used for synthesis were the same as those in Figure 1a,e. However, the skeletons used for synthesizing two textures had the same directionality (with horizontal strength), but different density. The synthesized texture scenes were Scenes 3 and 4, as shown in Figure 3. The density of the skeleton was twice higher in Texture A than that in Texture B in Scenes 3 and 4. A total of four scenes were generated in this experiment (the synthesized textures are available for research upon request).
In this experiment, to counterbalance the influences from the order of trials (Scenes 1 and 3 used a similar synthesizing process, so the display of the front trial appeared to influence the subsequent trial) and the presentation in the left and right visual field (some participants may have had attention-related disorders such as spatial hemineglect, so the location of Textures A and B may influence the visual attention), we took two strategies: (1) in both tests, the display orders of two scenes were alternated, and (2) in each scene, the locations of Textures A and B were randomly on the left or right.
Apparatus: In this experiment, the participants’ visual-attention patterns were tracked and recorded with the eye-tracker Tobii T60 (Tobii Technology AB, Danderyd, Stockholm, Sweden). The eye-tracker had a 17 inch monitor and a resolution of . The sampling rate of the eye-tracking system was 60 Hz. The eye-tracker had an accuracy of and spatial resolution. Tobii studio software (Version 3.3, Tobii Technology AB, Danderyd, Stockholm, Sweden, 2016) was used in the initial processing of the eye-tracking data. Fixation was defined by a pause in eye-movements for 75 ms within a certain spatial area defined in . We found some related references on eye-movements [29,30] and arranged the experiment settings. A participant was seated in a soft chair while viewing the display of the eye-tracker. The distance from the screen was controlled by a head rack that had the same function as that of a chin rest. To avoid environmental influences, we eliminated external noise and disturbances from the experiment.
3.2. Participants
A total of 60 undergraduate students from Shanxi University participated in the experiment. The participants were comprised of 28 females and 32 males aged 19–23 years (average = 19.13, standard deviation (SD) = 1.11). They had normal or corrected-to-normal vision. Informed consent was obtained from all participants prior to the experiment.
3.3. Viewing Distance
Viewing distance is a critical factor for global/local perception [17]. In the experiment, subjects were asked to identify if candidate Texture A or B was more similar to Texture S. To ensure that the viewing distance set for the experiment yielded the same probabilities of selecting Texture A or B, we referred to the equations proposed in [17]. In [9], a logistic-regression model was built to construct a statistical relationship between the viewing distance and visual perception of global/local features. It was also identified that there was an increasing domination of global features with an increase in viewing distance. In order to evaluate the absolute position where local and global features had the same domination, two equations were proposed in [17], as follows:
where denotes the diameter of the texture in Scene 1, denotes the diameter of the texture in Scene 2, is the viewing distance at which the probability of selecting Texture A of Scene 1 was 50%, and is the viewing distance at which the probability of selecting Texture A of Scene 2 was 50%. By the above equations, we estimated the viewing distances for different visual stimuli. In the experiment, texture diameters were 10.5 cm. According to Equation (3), the viewing distances for Scenes 1 and 3 were set to 48 cm, and the viewing distances for Scenes 2 and 4 were set to 70 cm.
3.4. Procedure
Two tests were conducted in this experiment. Scenes 1 and 3 were used as visual stimuli in Test 1. Scenes 2 and 4 were used as visual stimuli in Test 2. In each test, every participant (30 participants in each test) first signed an informed consent form, and then, they were seated in a soft chair with a suitable height at which the eye-tracker could easily capture the participant’s eyes. After setting the viewing distance and chair height, a calibration test was performed in the eye-tracking system in accordance with the participant’s eye-movement and visual acuity. The participant’s eyes were calibrated to help fixate on five markers on the display area. They were asked to gaze at and visually track the movement of a red dot on the screen of the eye-tracker. If the calibration failed, then the participant was excluded from the experiment.
When calibration was successful, the participant was required to view the screen on which the instructions of the experiment were shown. The visual angle of the presented pattern was . The experiment task was asking the subjects to select if Texture A or B was more similar to Texture S. The participant was required to click the mouse to immediately change the visual stimuli when his/she made a decision. Lastly, the participants provide their answers to similarity selection.
4. Experiment Results and Data Analysis
Eye-Tracking-Data Analysis
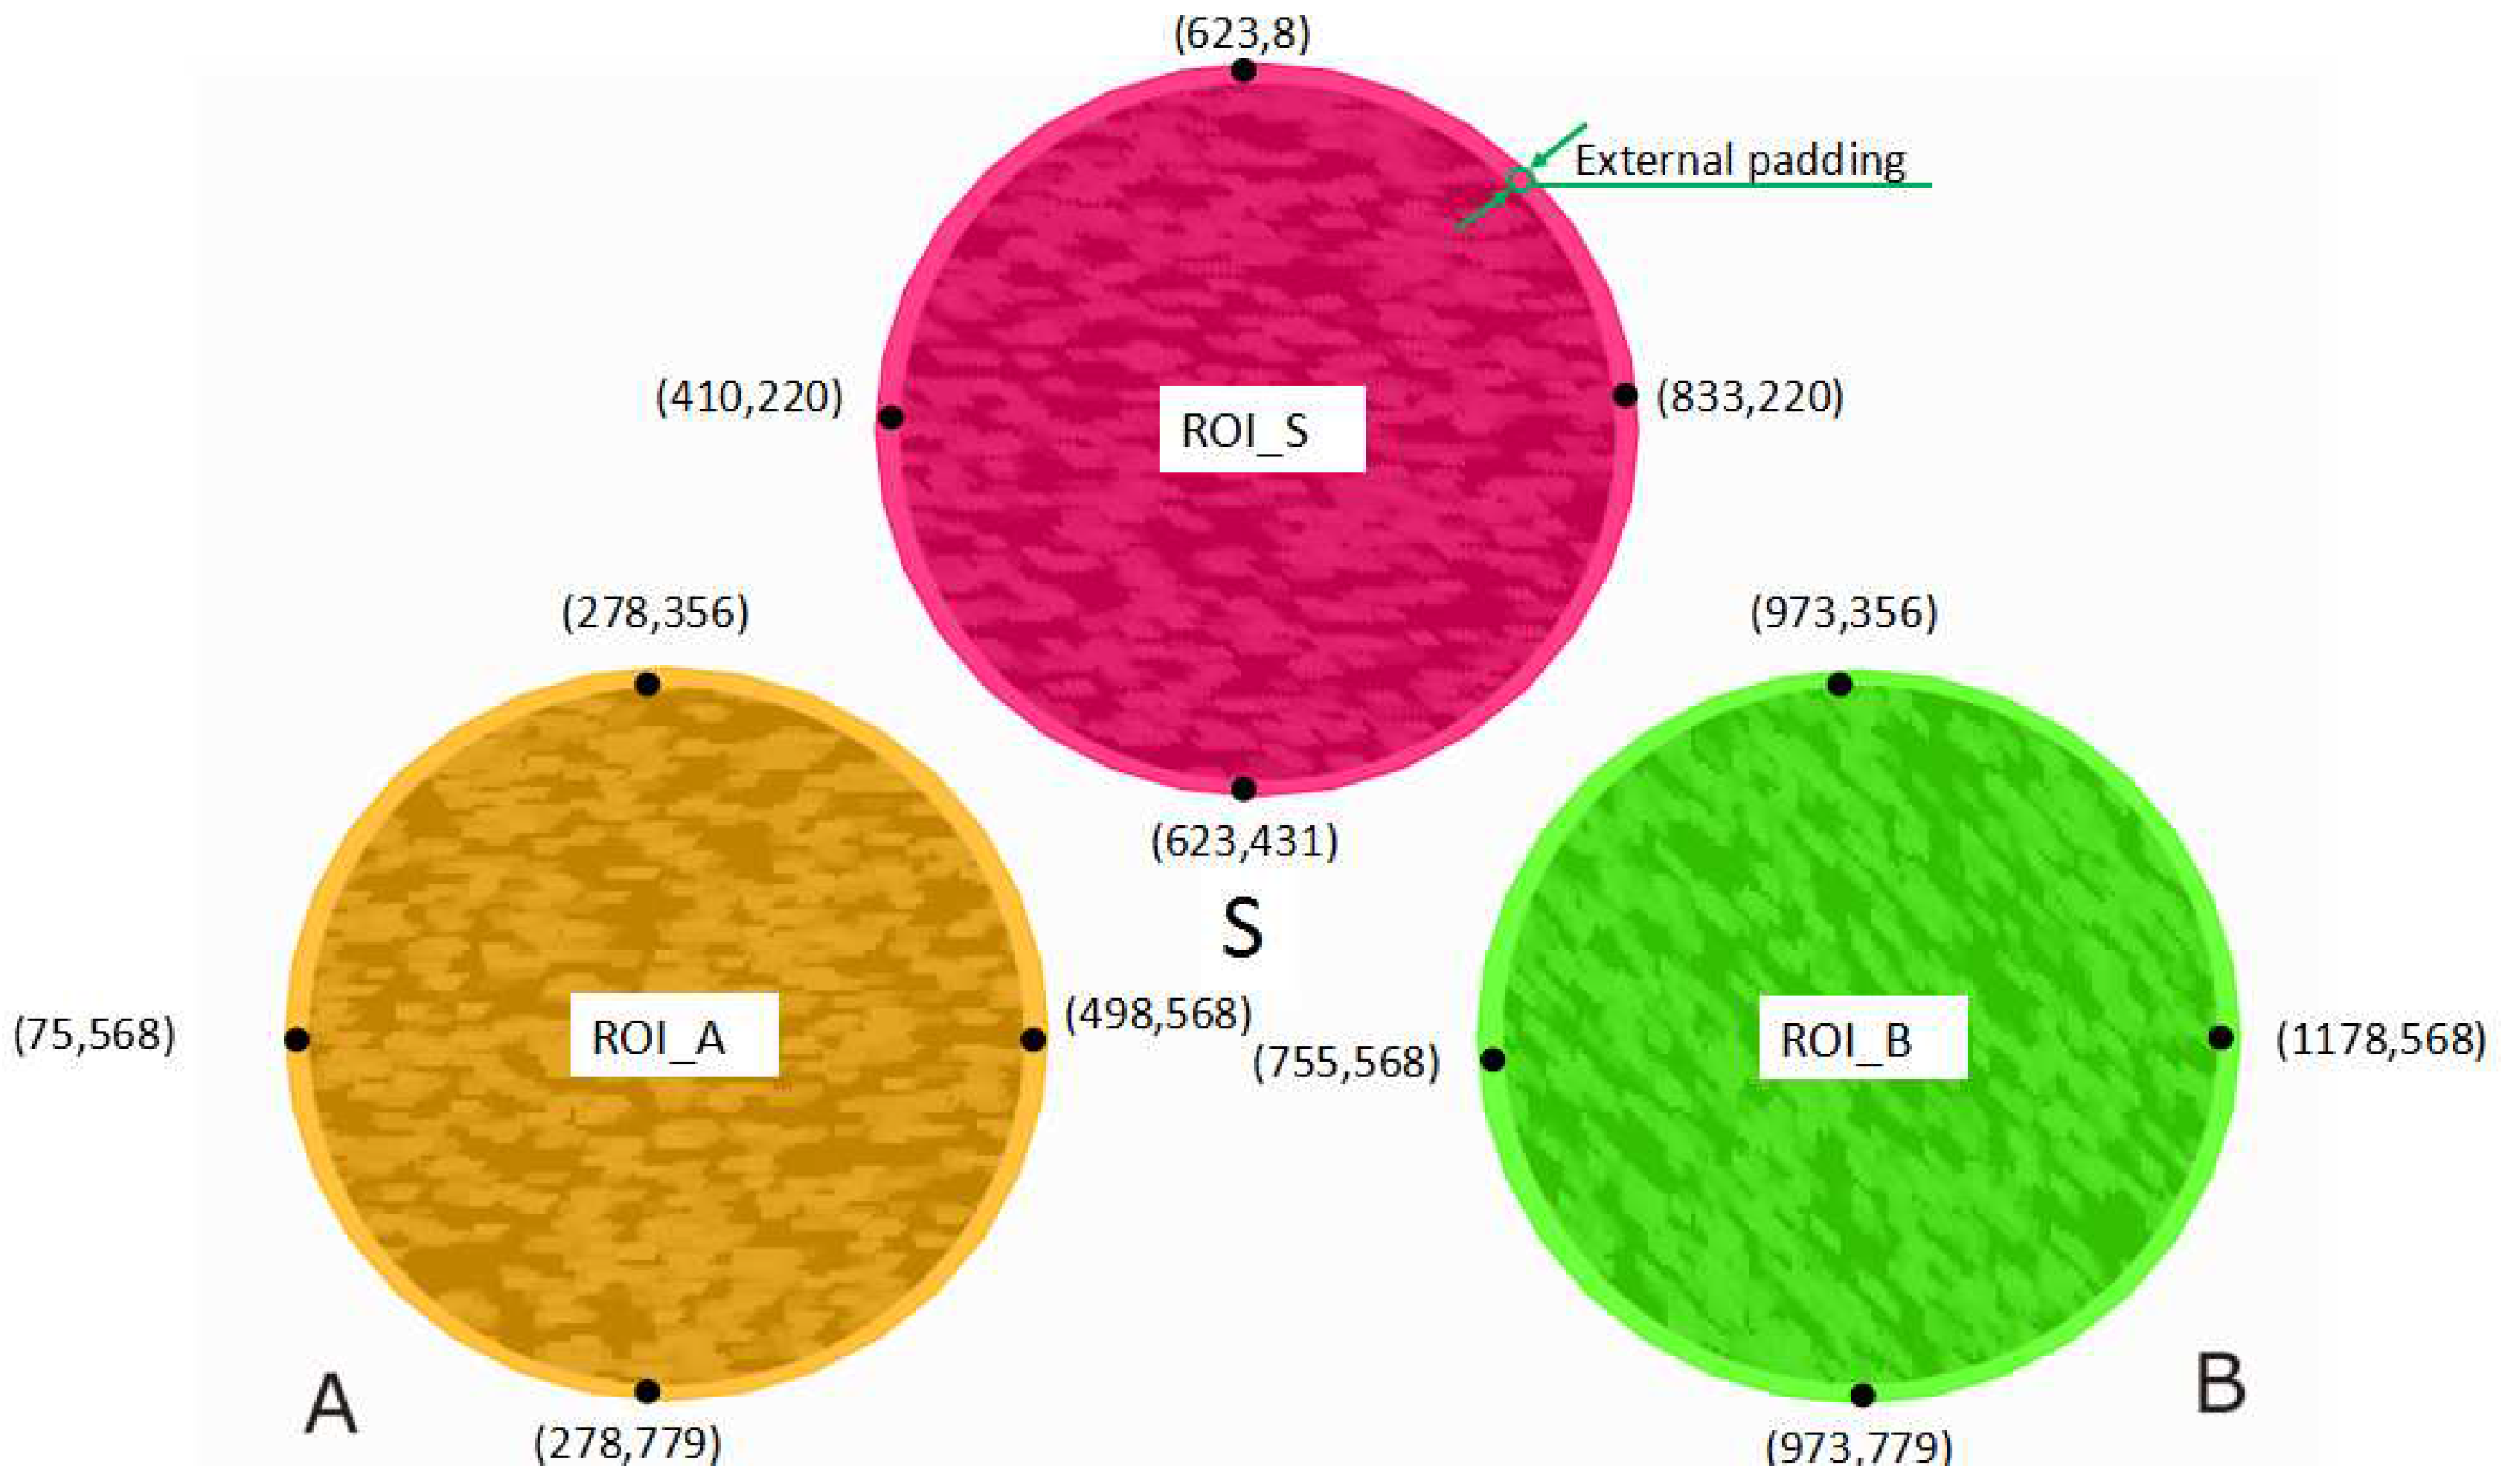
Before exporting the data from Tobii Studio [31], we divided each scene into three regions of interest (ROIs). In eye-tracking research, there is always disparity between a person’s actual gaze location and the location recorded by the eye-tracker [32,33]. The Tobii T60 eye-tracker has a reported accuracy of a 0.5 visual angle. Therefore, to eliminate the effect of systematic error, we took each texture and its external padding as one ROI. This strategy was adopted to avoid the problem of a participant viewing the edge of a texture and not being inside the ROI as a result of calibration issues.According to viewing distance, we calculated the external padding for different scenes. For Scenes 1 and 3, external padding was around 12 pixels. For Scenes 2 and 4, external padding was around 18 pixels. The size and location of the marked ROIs are shown in Figure 4.
In the Introduction, we wondered whether global/local features and final similarity selection influence eye-movement patterns in texture recognition. Therefore, we used three metrics to identify the participants’ visual behavior on the basis of the outcomes of the eye-tracking experiment: (1) total fixation duration (TFD) in each ROI, (2) fixation-point variance (FPV) in each ROI, and (3) fixation-transfer counts (FTCs) between different ROIs [34,35]. As the final selection was determined between Textures A and B, we mainly considered the eye-movement data in Textures A and B.
(1) TFD in each ROI represents the duration of fixation within an ROI. It was calculated as the average value in seconds. For Scenes 1–4, we calculated the average TFDs and the SD of TFDs in different ROIs (as shown in Table 1). The TFD in Texture B was longer than that in Texture A for the four scenes. This result was in accordance with that of Deng et al. [36], who demonstrated that horizontal displays were easier to process. Therefore, TFD in Texture A was shorter than that in Texture B. To verify whether global and local texture features influenced the average TFD in Textures A and B, we analyzed the average TFD through ANOVA (Analysis of Variance). ANOVA results (F(1,29) = 0.000, p = 0.997 for Scene 1, F(1,29) = 1.22, p = 0.273 for Scene 2, F(1,29) = 0.000, p = 0.996 for Scene 3, and F(1,29) = 0.090, p = 0.755 for Scene 4) indicated that no significant difference existed between Textures A and B under the significance level of 0.05. Furthermore, we calculated the effect size (eta-squared) for one-way ANOVA. Eta-squared values also showed that the global and local features of the synthesized textures exerted no significant effects on TFD when participants perceived the textures.
Moreover, we hypothesized that the final similarity choices and TFDs in ROIs (especially Textures A or B) were highly related. That is, if the final similarity choice was Texture A (Sele_A for short in Table 1), the participant tended to spend more time gazing at Texture A than at Texture B; by contrast, if the final similarity choice was Texture B (Sele_B for short in Table 1), the participant tended to spend more time gazing at Texture B than at Texture A. To verify this hypothesis, we conducted a paired t-test to verify differences between choices (Textures A and B) on the basis of TFDs in Textures A and B (shown in Table 1). Analysis results showed that, for Scene 1, TFD in Texture A was significantly greater (in the paired t-test, t(16) = 2.434, p = 0.027) than that for Texture B when the similarity choice was Texture A under the significance level of 0.05. TFD in Texture B, on the other hand, was not significantly greater (in the paired t-test, t(12) = −1.327, p = 0.209) than that for Texture A when the choice of similarity was Texture B. For Scene 2, TFD in Texture A was not significantly greater (in the paired t-test, t(11) = −0.327, p = 0.750) than that for Texture B when the choice of similarity was Texture A. TFD in Texture B was also not significantly greater (in the paired t-test, t(17) = −1.79, p = 0.091) than that for Texture A when the choice of similarity was Texture B. For Scene 3, TFD in Texture A was significantly greater (in the paired t-test, t(23) = 3.059, p = 0.006) than that for Texture B when the choice of similarity was Texture A. However, TFD in Texture B was not significantly greater (in the paired t-test, t(5) = −2.274, p = 0.072) than that for Texture A when the choice of similarity was Texture B. For Scene 4, TFD in Texture A was not significantly greater (in the paired t-test, t(16) = 1.674, p = 0.114) than that for Texture B when the choice of similarity was Texture A. However, TFD in Texture B was significantly greater (in the paired t-test, t(12) = −3.286, p = 0.007) than that for Texture A when the choice of similarity was Texture B. Analysis results showed that there was no significant relationship between final similarity choices and TFDs in the ROIs.
Furthermore, we added Cohen’s d (on Social Sciences Statistics website [37]) to reflect the effect size when interpreting our results. Cohen’s d is the difference between two means divided by the standard deviation. Cohen [38] gave useful rules of thumb about what to regard as a “large”, “medium”, or “small” effect. On the basis of the above analysis of the p-values and Cohen’s d-values, the relationships between final similarity choices and TFDs in ROIs were not significant.
(2) FPV in each ROI refers to the degree of fixation concentration when the participants were viewing the stimuli. In our research, this indicator was used to reflect whether a participant’s eye-movement was local attention or global scan. Since Texture S had the same global features as those of Texture A and the same local features as those of Texture B, if participants captured the global features of the visual stimuli, the fixation points were dispersed; if the participants paid more attention to the local features of the visual stimuli, the fixation points were concentrated. Therefore, we hypothesized that, during the process of visual searching, the fixation points in Texture A were more dispersed than those in Texture B. To verify this hypothesis, we calculated the FPV in each ROI.
The coordinates of all fixation points in each ROI could be accessed from Tobii Studio. We first computed the FPVs in Textures A and B through the following steps.
I. Calculate the central point of all fixations in each ROI.
where is one of the fixations in each ROI and is the central point among all fixations in each ROI.
II. Calculate the Euclidean distance between each fixation and the center point.
where is the Euclidean distance between each fixation and the center point in each ROI.
III. Calculate the variance from all distances.
where is the variance from all distances. It represents the concentration of all fixations in each ROI.
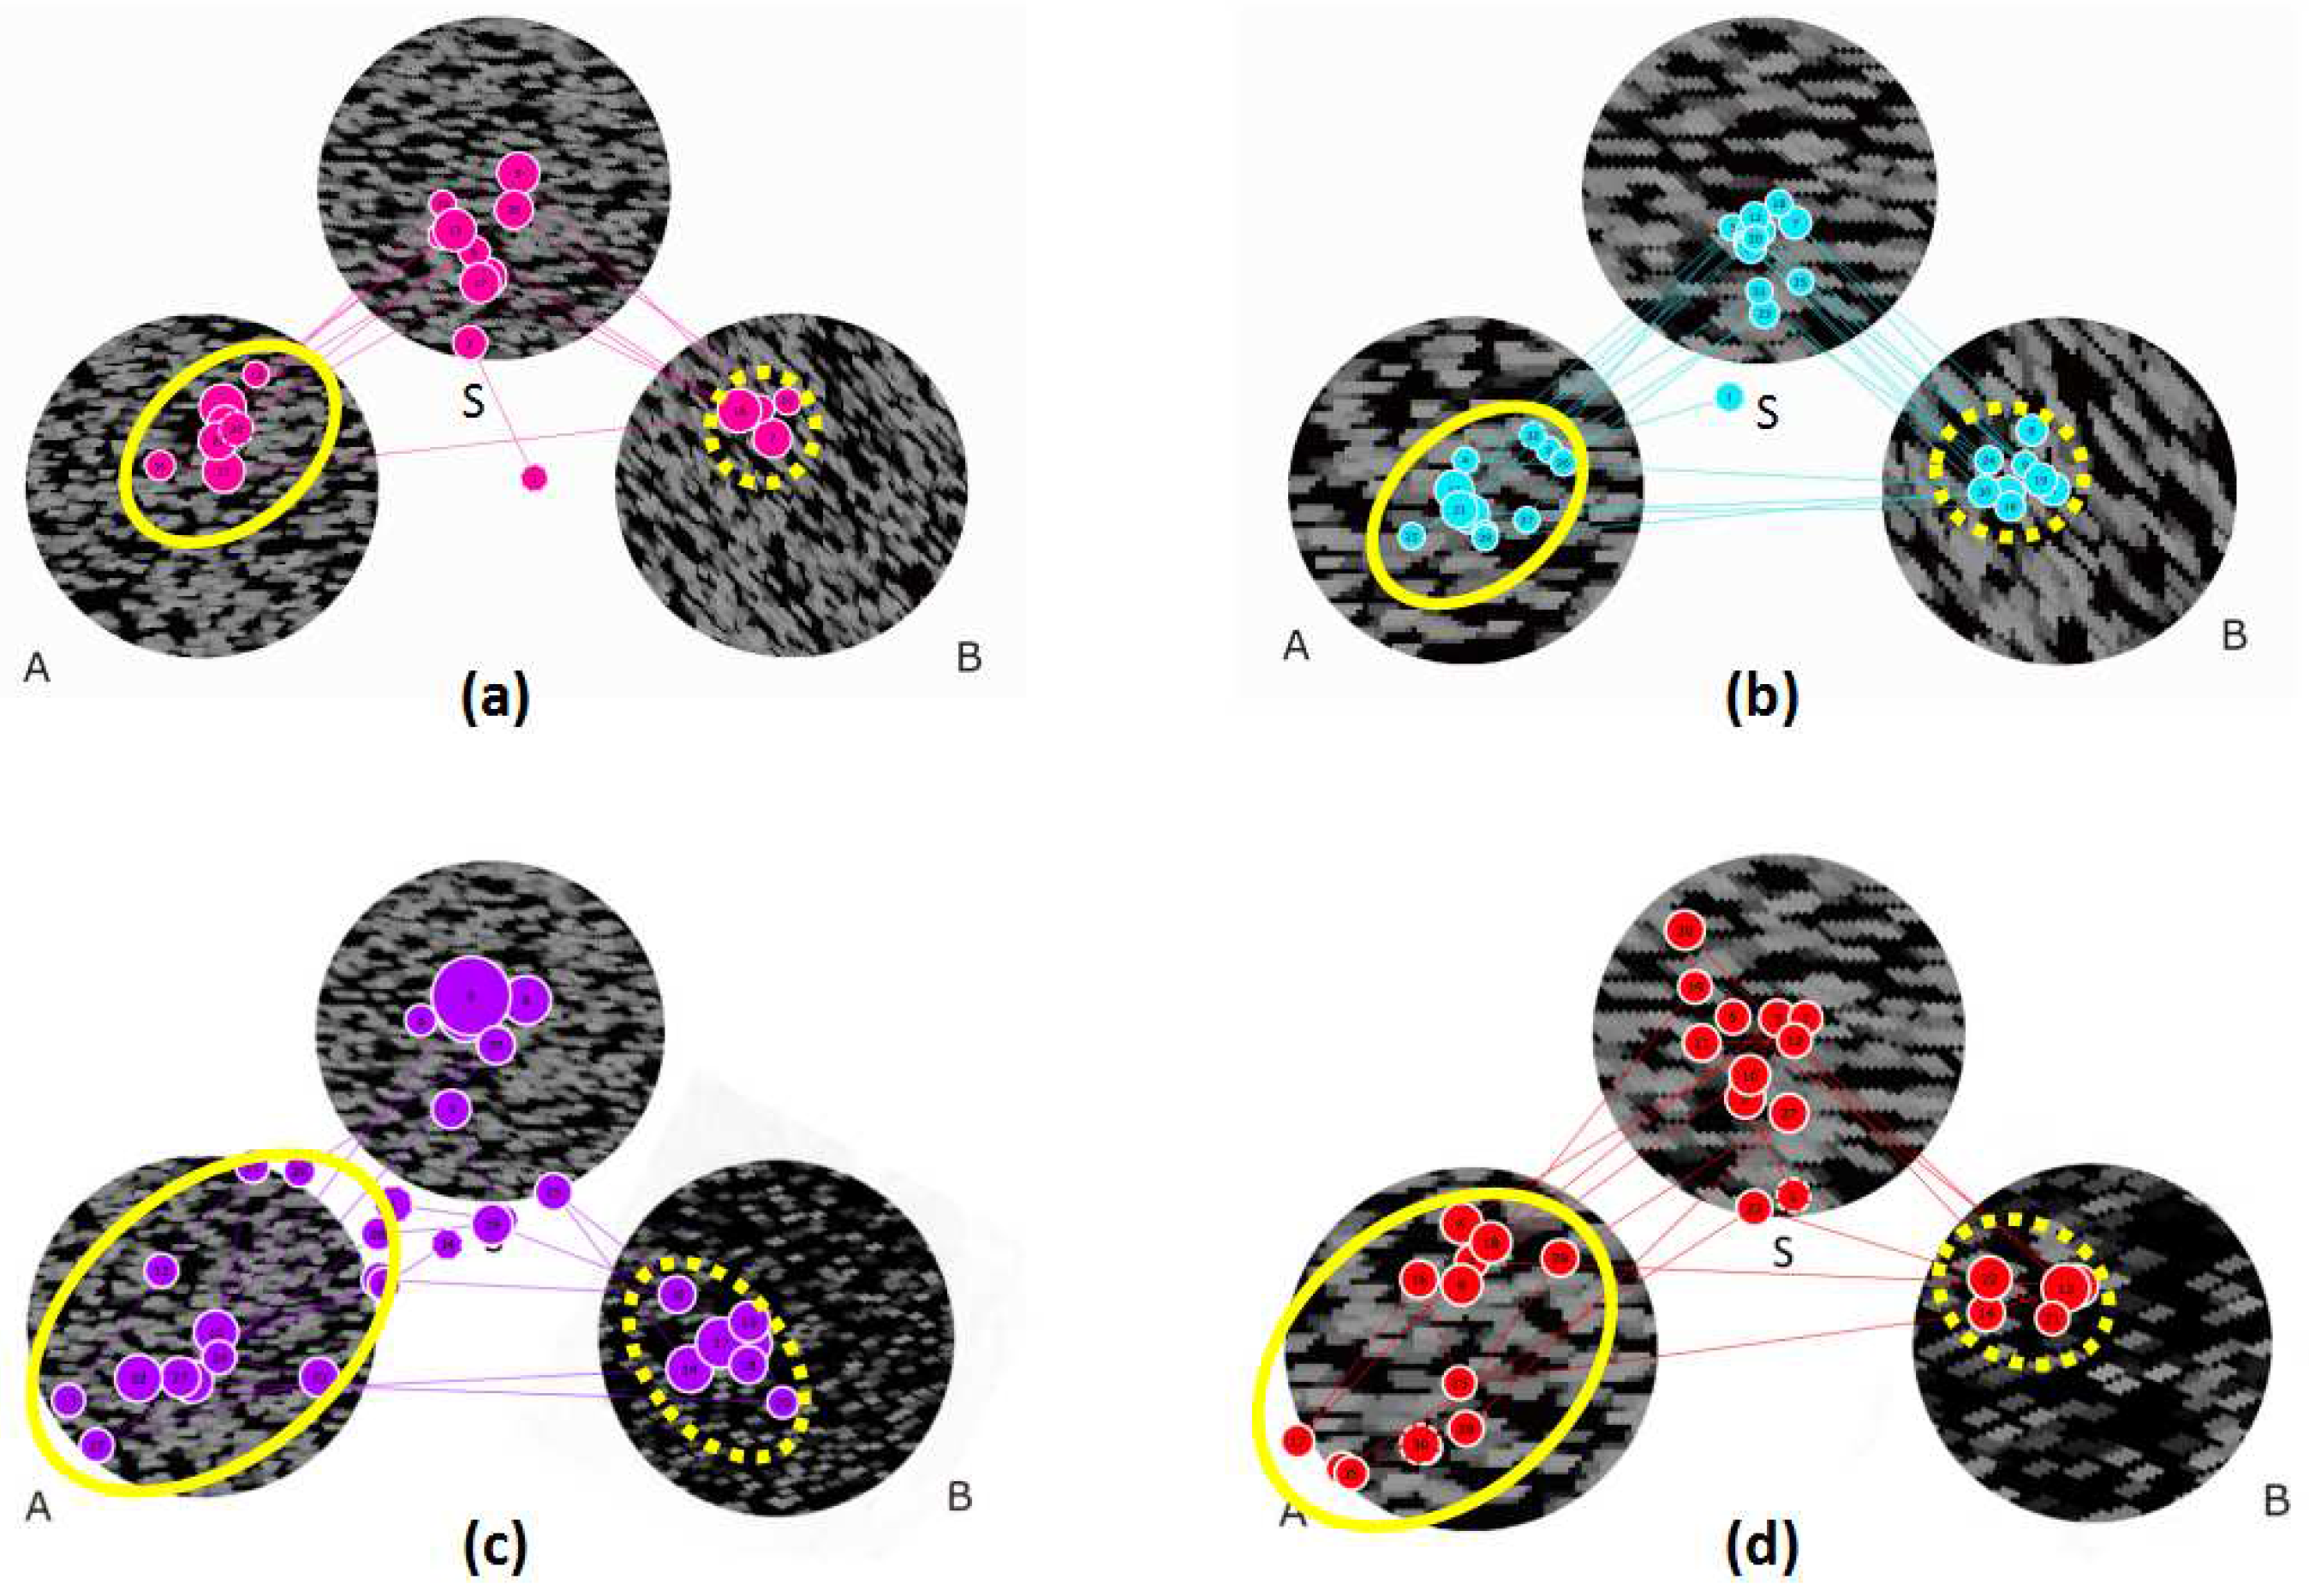
The average and SD of FPVs in the ROIs of Textures A and B for four scenes are shown in Table 2. We conducted a paired t-test to estimate differences in global and local features on the basis of FPVs for Textures A and B. The independent variable used in the t-test was the FPVs, which were calculated from 30 participants’ eye-movements. The p-values and Cohen’s d-values indicated that significant differences existed between global and local features on the basis of the FPVs for Textures A and B at the significance level of 0.05. Results validated the hypothesis that fixation points were more dispersed in Texture A than in Texture B. Overall, the fixation points in Texture A were scattered because Textures A and S had the same global features; fixation points in Texture B were concentrated because Textures B and S had the same local features. An example of the fixation-point distribution is shown in Figure 5. From this figure, it is obvious that the fixation points in Texture A were more dispersed than the fixation points in Texture B.
In the four scenes, Texture A contained dispersed fixation points because participants paid more attention to its global features (horizontally similar to Texture S). The horizontal displays were easier to process, which subsequently led to higher choice quantities [36,39]. Therefore, we hypothesized that the final similarity choices and the FPVs in ROIs (especially for Textures A or B) were highly related. That is, if the FPV in Texture A was larger than that in Texture B, the final similarity choice tended to be Texture A; by contrast, if the FPV in Texture A was smaller than that in Texture B, the final similarity choice tended to be Texture B. To verify this hypothesis, we conducted a paired t-test to verify differences between choices (Textures A and B) on the basis of the FPVs in Textures A and B (shown in Table 1). The independent variable used in the t-test was the FPVs in ROIs under a certain final similarity choice (Texture A or B).
Analysis results showed that, for Scene 1, the FPV in Texture A was significantly greater (in the paired t-test, t(14) = 3.661, p = 0.001) than that for Texture B when the similarity choice was Texture A under the significance level of 0.01. The FPV in Texture B, on the other hand, was not significantly greater (in the paired t-test, t(7) = −2.034, p = 0.040) than that for Texture A when the choice of similarity was Texture B. For Scene 2, the FPV in Texture A was not significantly greater (in the paired t-test, t(5) = 2.603, p = 0.024) than that for Texture B when the choice of similarity was Texture A. The FPV in Texture B was also not significantly greater (in the paired t-test, t(5) = −1.835, p = 0.063) than that for Texture A when the choice of similarity was Texture B. For Scene 3, the FPV in Texture A was significantly greater (in the paired t-test, t(14) = 4.512, p = 0.000) than that for Texture B when the choice of similarity was Texture A. However, the FPV in Texture B was not significantly greater (in the paired t-test, t(5) = −2.487, p = 0.028) than that for Texture A when the choice of similarity was Texture B. For Scene 4, the FPV in Texture A was significantly greater (in the paired t-test, t(8) = 3.561, p = 0.004) than that for Texture B when the choice of similarity was Texture A. The FPV in Texture B was not significantly greater (in the paired t-test, t(6) = −2.768, p = 0.016) than that for Texture A when the choice of similarity was Texture B. Analysis results showed that there was no significant relationship between final similarity choices and FPV in the ROIs.
(3) FTCs between different ROIs represent the fixation-transfer counts between different ROIs. In this research, the subjects viewed three synthesized texture images in one scene. Their final similarity choices between Textures A and B were determined by checking which of the two textures was more similar to Texture S. Therefore, we mainly considered the FTCs between Textures S and A (FTCs_S,A) and the FTCs between Textures S and B (FTCs_S,B).
As per Question (2) in the Introduction, we hypothesized that visual-similarity perception may influence eye-movement patterns, and there are two relationships between the final similarity choice and the FTCs between different textures (especially Textures A and S and Textures B and S). Moreover, Atalay et al. [40] demonstrated that gaze duration and fixation frequency tended to influence the final choice. Therefore, the relationships that we hypothesized are shown as follows:
I. If the final similarity choice was Texture A, then FTCs_S,A> FTCs_S,B.
II. If the final similarity choice was Texture B, then FTCs_S,A<FTCs_S,B.
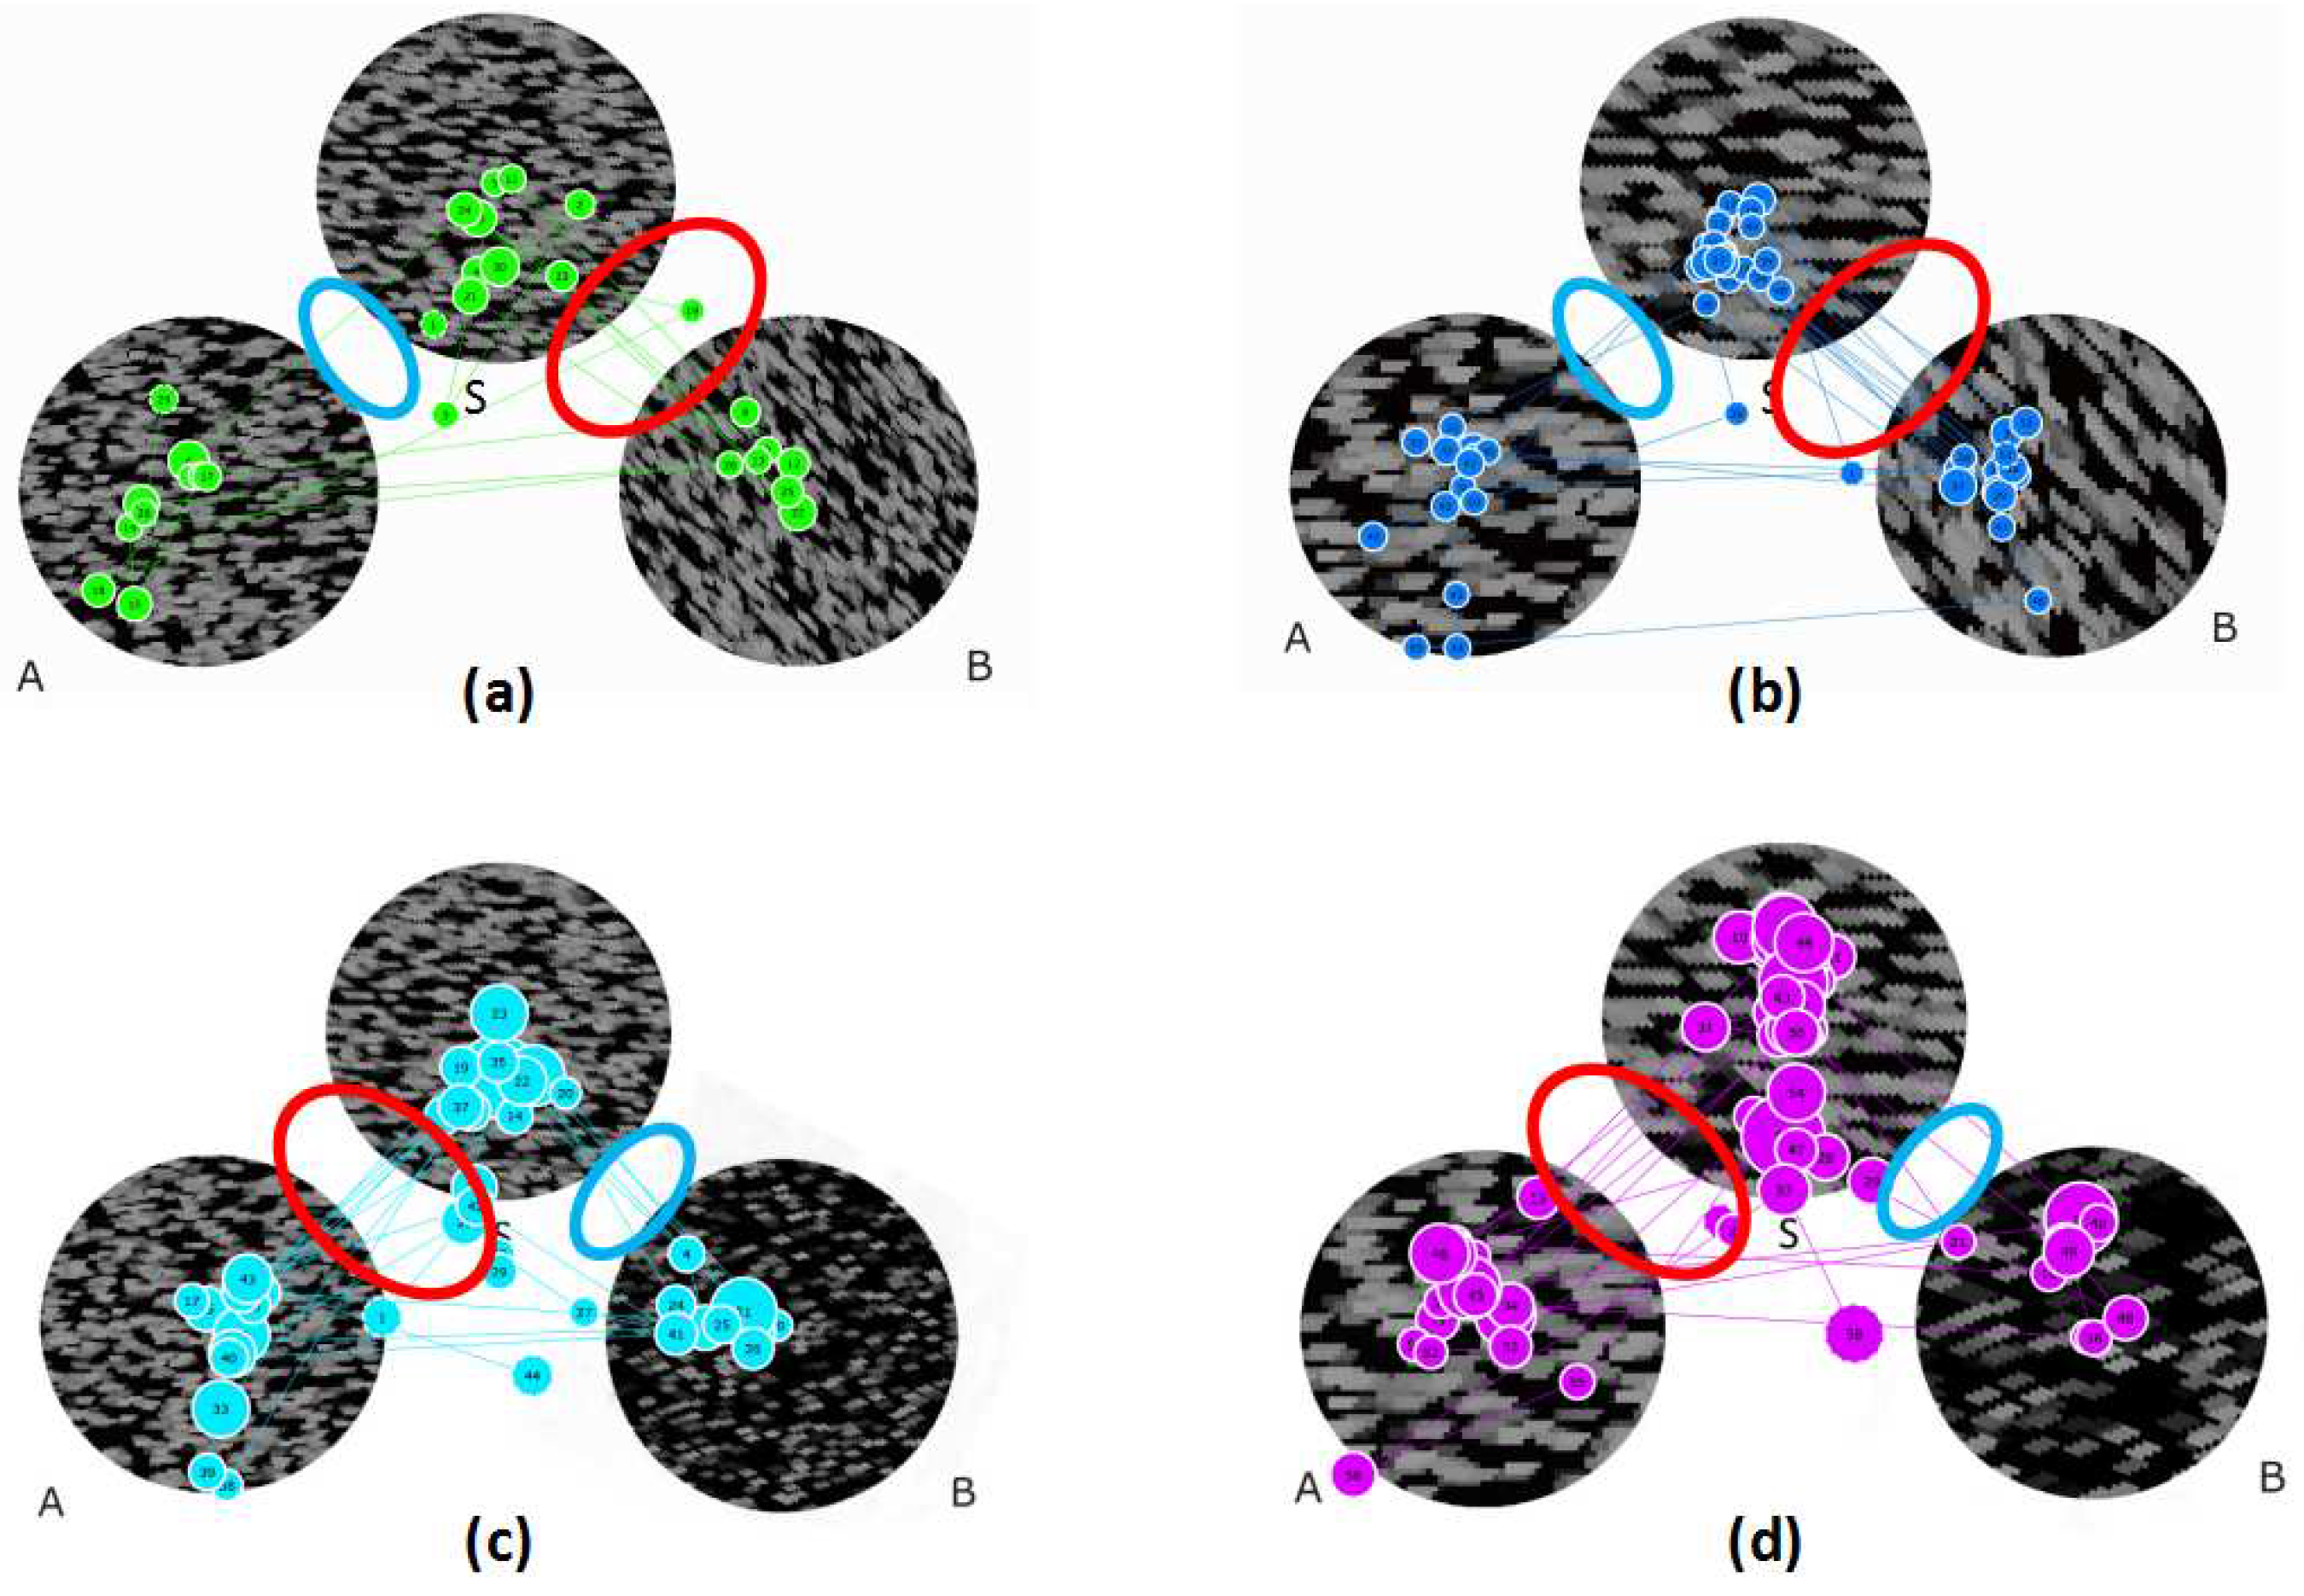
To verify the hypothesis, we conducted a paired t-test to evaluate differences in FTCs_S,A and FTCs_S,B for the similarity choice between Textures A and B in the four scenes. The independent variable used in the t-test was the FTCs between different ROIs under a certain finial similarity choice (Texture A or B). Results are shown in Table 3. For Scene 1, FTCs_S,A was significantly greater (in the paired t-test, t(16) = 4.883, p < 0.001) than FTCs_S,B when the similarity choice was Texture A. FTCs_S,A was much less (in the paired t-test, t(12) = −3.32, p = 0.006) than FTCs_S,B when the choice of similarity was Texture B. The same results were obtained in Scene 2. FTCs_S,A was significantly greater (in the paired t-test, t(11) = 2.966, p = 0.013) than FTCs_S,B when the similarity choice was Texture A. FTCs_S,A was considerably less (in the paired t-test, t(17) = −2.247, p = 0.038) than FTCs_S,B when the similarity choice was Texture B. In addition, in Scene 3, FTCs_S,A was significantly greater (in the paired t-test, t(23) = 6.075, p < 0.001) than FTCs_S,B when the similarity choice was Texture A. FTCs_S,A was much less (in the paired t-test, t(5) = −3.464, p = 0.018) than FTCs_S,B when the choice of similarity was Texture B. Lastly, in Scene 4, FTCs_S,A was significantly greater (in the paired t-test, t(16) = 3.289, p = 0.005) than FTCs_S,B when the similarity choice was Texture A. FTCs_S,A was less (in the paired t-test, t(12) = −2.241, p = 0.045) than FTCs_S,B when the choice of similarity was Texture B. Examples of FTCs for the four scenes are shown in Figure 6. On the basis of p- and Cohen’s d-values, analysis results verified the hypothesis that the final visual-similarity selection was related to FTCs between the different ROIs, and it influenced the fixation-transfer counts between different ROIs.
5. Discussion and Conclusions
Two main issues were studied in this experiment. The first was related to how global and local features influence eye-movement patterns under similarity perception, and the second was related to the relationship between similarity choice and eye-movement patterns.
Regarding the first issue, TFD and FPV in each ROI were calculated to analyze eye-movement patterns. Generally, a high TFD value was attributed to the attractiveness of an ROI [41]. For Scenes 1–4, the TFD in Texture B was longer than that in Texture A. This reflected that Texture B got more attention. However, some studies had different views. Long fixation duration on an ROI indicates that the ROI is too complex to understand [42,43]. In this research, textures in each scene were synthesized with the PGPC texture model. The complexities of grains and skeletons that were used in the synthesis were at the same level of complexity. Therefore, the only difference of complexity for Textures A and B was shown in directionality (for Scenes 1 and 2) and density (for Scenes 3 and 4). Deng et al. [36] demonstrated that horizontal displays are easier to process. This also proves our finding that the TFD in Texture A was shorter than the TFD in Texture B. Previous research [24] demonstrated that similarity has a different effect on processing global and local features. In the present study, fixations in Textures A and B showed different distributions under similarity perception. Textures A and S had a similarity of global features, and the fixation points in Texture A were dispersed. Textures B and S had a similarity of local features, and the fixation points in Texture B were relatively concentrated.
In terms of the second issue, we summarized the experiment data corresponding to the two types of relationships between final similarity choice and FTCs between the different ROIs; results are shown in Table 4. A total of 88.2%(15/17) of subjects in Scene 1, 75.0% (9/12) of subjects in Scene 2, 87.5% (21/24) of subjects in Scene 3, and 76.5% (13/17) of subjects in Scene 4 transferred more frequently between Textures A and S than between Textures B and S; these subjects believed that Texture A was more similar to Texture S. Meanwhile, a total of 61.5% (8/13) of subjects in Scene 1, 72.2% (13/18) of subjects in Scene 2, 83.3% (5/6) of subjects in Scene 3, and 61.5% (8/13) of subjects in Scene 4 transferred more frequently between Textures B and S than between Textures A and S; these subjects regarded Texture B as more similar to Texture S. Furthermore, we conducted a paired t-test to evaluate differences in FTCs_S,A and FTCs_S,B in the similarity choice between Textures A and B for the four scenes. On the basis of paired t-test results, we concluded that the final similarity choice was closely related to the FTCs of different textures viewed in the tests. This was in accordance with previous research that transitions between different fixations are related to the search behavior and expectations of the observers [44].
In conclusion, we investigated whether global and local features influence eye-movement patterns in texture-similarity perception. When the texture was globally similar to the texture being compared, the fixation points in the texture were highly dispersed. By contrast, when the texture was locally similar to the texture being compared, the fixation points in the texture were highly concentrated. Furthermore, the domination of global and local features influences viewers’ similarity choice. The final visual-similarity selection was related to FTCs between different ROIs, but not related to the TFD in each ROI. This research contributes to analyzing the pattern of texture recognition using an eye-tracker and extends a new application of the mathematical morphology-based texture model to human visual perception.
The texture stimuli utilized in the experiment were limited. In our future work, we aim to synthesize different types of textures for experimental research. We will further analyze other metrics of eye-movements to investigate the relationship between similarity perception and global/local processing.
Author Contributions
Conceptualization, X.G. and L.L.; methodology, X.G. and L.L.; software, X.G.; validation, X.G., L.L., and A.A.; formal analysis, C.M.A.; investigation, X.G.; resources, L.L.; data curation, L.L.; writing, original draft preparation, X.G.; writing, review and editing, X.G. and L.L.; visualization, X.G.; supervision, A.A.; project administration, X.G.; funding acquisition, X.G. All authors have read and agreed to the published version of the manuscript.
Funding
This project was funded by the National Natural Science Foundation of China (Grant No. 61603228), the Shanxi Province Science Foundation for Youths (Grant No. 201901D211171), the Research Project Supported by Shanxi Scholarship Council of China (Grant No. HGKY2019001), and the Scientific and Technological Innovation Programs of Higher Education Institutions in Shanxi (Grant No. 2020L0036).
Acknowledgments
The authors thank the experiment participants.
Conflicts of Interest
The authors declare no potential conflict of interest with respect to the research, authorship, and publication of this article.
References
- Navon, D. Forest before trees: The precedence of global features in visual perception. Cogn. Psychol. 1977, 9, 353–383. [Google Scholar] [CrossRef]
- Beaucousin, V.; Simon, G.; Cassotti, M.; Pineau, A.; Houdé, O.; Poirel, N. Global interference during early visual processing: ERP evidence from a rapid global/local selective task. Front. Psychol. 2013, 4, 539. [Google Scholar] [CrossRef] [PubMed] [Green Version]
- Shedden, J.M.; Reid, G.S. A variable mapping task produces symmetrical interference between global information and local information. Percept. Psychophys. 2001, 63, 241–252. [Google Scholar] [CrossRef] [Green Version]
- Volberg, G.; Hübner, R. Deconfounding the Effects of Congruency and Task Difficulty on Hemispheric Differences in Global/Local Processing. Exp. Pscyhol. 2007, 54, 83–88. [Google Scholar] [CrossRef] [PubMed]
- Martin, M. Local and global processing: The role of sparsity. Mem. Cogn. 1979, 7, 476–484. [Google Scholar] [CrossRef] [Green Version]
- Ripoll, T.; Fiere, E.; Pelissier, A. Relative weight of localand global properties depends on both the position of local elements and the saliency of global orm. Exp. Psychol. 2005, 52, 272–280. [Google Scholar] [CrossRef]
- Lamb, M.R.; Robertson, L.C. The effect of visual angle on global and local reaction times depends on the set of visual angles presented. Percept. Psychophys. 1990, 47, 489–496. [Google Scholar] [CrossRef] [Green Version]
- Poirel, N.; Pineau, A.; Mellet, E. Implicit identification of irrelevant local objects interacts with global/local processing of hierarchical stimuli. Acta Psychol. 2006, 122, 321–336. [Google Scholar] [CrossRef]
- Poirel, N.; Pineau, A.; Mellet, E. What does the nature of the stimuli tell us about the Global Precedence Effect? Acta Psychol. 2008, 127, 1–11. [Google Scholar] [CrossRef]
- Schyns, P.G.; Oliva, A. From blobs to boundary edges: Evidence for time- and spatial-scale-dependent scene recognition. Psychol. Sci. 1994, 5, 195–200. [Google Scholar] [CrossRef]
- Oliva, A. Gist of the Scene. In Neurobiology of Attention; Itti, L., Rees, G., Tsotsos, J.K., Eds.; Elsevier: San Diego, CA, USA, 2005; pp. 251–256. [Google Scholar]
- Oliva, A.; Torralba, A. Building the gist of a scene: The role of global image features in recognition. Prog. Brain Res. 2006, 155, 23–36. [Google Scholar] [PubMed]
- Oliva, A.; Schyns, P.G. Diagnostic colors mediate scene recognition. Cognit. Psychol. 2000, 41, 176–210. [Google Scholar] [CrossRef] [PubMed] [Green Version]
- Kimchi, R. Primacy of wholistic processing and global/local paradigm: A critical review. Psychol. Bull. 1992, 112, 24–38. [Google Scholar] [CrossRef] [PubMed]
- Kimchi, R. Uniform connectedness and grouping in the perceptual organization of hierarchical patterns. J. Exp. Psychol. Hum. Percept. Perform. 1998, 24, 1105–1118. [Google Scholar] [CrossRef]
- Dulaney, C.L.; Marks, W. The effects of training and transfer on global/local processing. Acta Psychol. 2007, 125, 203–220. [Google Scholar] [CrossRef]
- Li, L.; Asano, A.; Asano, C.M.; Okajima, K. Statistical quantification of the effects of viewing distance on texture perception. J. Opt. Soc. Am. Opt. Image Sci. Vis. 2013, 30, 1394–1403. [Google Scholar] [CrossRef]
- Murphy, K.P.; Torralba, A.; Freeman, W.T. Using the forest to see the trees: A graphical model relating features, objects and scenes. In Advances in Neural Information Processing Systems; MIT Press: Vancouver, BC, Canada, 2003. [Google Scholar]
- Torralba, A.; Oliva, A.; Castelhano, M.S.; Henderson, J.M. Contextual guidance of eye-movements and attention in real-world scenes: The role of global features in object search. Psychol. Rev. 2006, 113, 766–786. [Google Scholar] [CrossRef] [Green Version]
- Najemnik, J.; Geisler, W.S. Eye movement statistics in humans are consistent with an optimal search strategy. J. Vis. 2008, 8, 4. [Google Scholar] [CrossRef] [Green Version]
- Cheng, Z.; Chuk, T.; Hayward, W.G.; Chan, A.; Hsiao, J.H. Global and Local Priming Evoke Different Face Processing Strategies: Evidence from An Eye Movement Study. J. Vis. 2015, 15, 154. [Google Scholar] [CrossRef]
- Huang, X.; Chen, D.; Han, X.; Chen, Y. Glocal and local features for accurate impression estimation of cloth fabric images. In Proceedings of the 2013 IEEE/SICE International Symposium on System Integration, Kobe, Japan, 15–17 December 2013; pp. 486–489. [Google Scholar]
- Eisa, M. Combined Local and Global Features for Improving the Shape Retrieval. Int. J. Comput. Sci. Issues 2014, 11, 12–20. [Google Scholar]
- Blanca, M.J.; Luna, R.; López-Montiel, D.; Zalabardo, C.; Rando, B. Effect of the similarity between target and global and local levels in hierarchical stimuli processing. Psychol. Res. 2002, 66, 124–132. [Google Scholar] [CrossRef] [PubMed]
- Asano, A.; Ohkubo, T.; Muneyasu, M.; Hinamoto, T. Primitive and point configuration texture model and primitive estimation using mathematical morphology. In 10th Scandinavian Conference on Image Analysis; Lecture Note in Computer Science 2749; Springer: Berlin/Heidelberg, Germany, 2003; pp. 178–185. [Google Scholar]
- Li, L.; Asano, A.; Asano, C.M.; Muneyasu, M.; Hanada, Y. Dual Primitive Estimation of Textures. IEICE Trans. Fundam. Electron. Commun. Comput. Sci. 2011, 94, 1165–1169. [Google Scholar] [CrossRef]
- Yang, L.; Li, L.; Asano, C.M.; Asano, A. Primitive and grain estimation using flexible magnification for a morphological texture model. In 10th International Symposium on Mathematical Morphology; Lecture Note in Computer Science 6671; Springer: Berlin/Heidelberg, Germany, 2011; pp. 190–199. [Google Scholar]
- Yang, L.; Asano, A.; Li, L.; Asano, C.M.; Kurita, T. Multi-Structural Texture Analysis Using Mathematical Morphology. IEICE Trans. Fundam. Electron. Commun. Comput. Sci. 2012, 95, 1759–1767. [Google Scholar] [CrossRef]
- Yamada, M.; Fukuda, T. Quantitative evaluation of eye-movements as judged by sight-line displacements. SMPTE J. 1986, 95, 1230–1241. [Google Scholar] [CrossRef]
- Yamada, M.; Fukuda, T.; Hirota, M. Development of an eye-movement analyzer possessing functions for wireless transmission and autocalibration. Med. Biol. Eng. Comput. 1990, 28, 317–324. [Google Scholar] [CrossRef]
- Tobii Technology. Tobii Studio 3.3.0 User Manual; Tobii Technology: Danderyd, Sweden, 2014. [Google Scholar]
- Zhang, Y.; Hornof, A.J. Mode-of-disparities error correction of eye-tracking data. Behav. Res. Methods 2011, 43, 834–842. [Google Scholar] [CrossRef] [Green Version]
- Hwang, Y.M.; Lee, K.C. Using an Eye-Tracking Approach to Explore Gender Differences in Visual Attention and Shopping Attitudes in an Online Shopping Environment. Int. J. Hum. Comput. Interact. 2017, 34, 15–24. [Google Scholar] [CrossRef]
- Goldberg, J.H. Measuring Software Screen Complexity: Relating Eye Tracking, Emotional Valence, and Subjective Ratings. Int. J. Hum. Comput. Interact. 2014, 30, 518–532. [Google Scholar]
- Sendurur, E.; Yildirim, Z. Students’ Web Search Strategies With Different Task Types: An Eye-Tracking Study. Int. J. Hum. Comput. Interact. 2014, 31, 101–111. [Google Scholar]
- Deng, X.; Kahn, B.E.; Unnava, H.R.; Lee, H. A Wide variety: Effects of horizontal versus vertical display on assortment processing, perceived variety, and choice. J. Mark. Res. 2016, 53, 682–698. [Google Scholar] [CrossRef]
- Social Science Statistics. Available online: http://www.socscistatistics.com/effectsize/Default3.aspx (accessed on 3 October 2019).
- Wassertheil, S.; Cohen, J. Statistical Power Analysis for the Behavioral Sciences. Biometrics 2006, 26, 588. [Google Scholar] [CrossRef]
- Van der Lans, R.; Wedel, M. Eye Movements during Search and Choice. In Handbook of Marketing Decision Models; Wierenga, B., van der Lans, R., Eds.; International Series in Operations Research & Management Science; Springer: Cham, Switzerland, 2017; p. 254. [Google Scholar]
- Atalay, S.; Bodur, H.O.; Rasolofoarison, D. Shining in the center: Central gaze cascade effect on product choice. J. Consum. Res. 2012, 39, 848–866. [Google Scholar] [CrossRef]
- Resnick, M.L.; Albert, W. The Impact of Advertising Location and User Task on the Emergence of Banner Ad Blindness: An Eye-Tracking Study. Int. J. Hum. Comput. Interact. 2013, 30, 206–219. [Google Scholar]
- Just, M.A.; Carpenter, P.A. Eye fixations and cognitive processes. Cogn. Psychol. 1976, 8, 441–480. [Google Scholar] [CrossRef]
- Liversedge, S.P.; Zang, C.; Zhang, M.; Bai, X.; Yan, G.; Drieghe, D. The effect of visual complexity and word frequency on eye-movements during Chinese reading. Vis. Cogn. 2014, 22, 441–457. [Google Scholar] [CrossRef]
- Fitts, P.M.; Jones, R.E.; Milton, J.L. Eye movements of aircraft pilots during instrument-landing approaches. In Ergonomics: Psychological Mechanisms and Models in Ergonomics; Taylor & Francis: Park Drive, UK, 2006. [Google Scholar]
Figure 1.
Synthesized textures. Texture 1 (a) grain and (b) skeleton and (c) Synthesized Texture 1; (d) Synthesized Texture 2 and Texture 2 (e) grain and (f) skeleton.
Figure 1.
Synthesized textures. Texture 1 (a) grain and (b) skeleton and (c) Synthesized Texture 1; (d) Synthesized Texture 2 and Texture 2 (e) grain and (f) skeleton.

Figure 2.
(a) Scene 1 and (b) Scene 2 (200% zoom of Scene 1) in the experiment. The locations of Textures A and B are randomly on the left or right.
Figure 2.
(a) Scene 1 and (b) Scene 2 (200% zoom of Scene 1) in the experiment. The locations of Textures A and B are randomly on the left or right.

Figure 3.
(a) Scene 3 and (b) Scene 4 (200% zoom of Scene 3) used in the experiment. The locations of Textures A and B are randomly on the left or right.
Figure 3.
(a) Scene 3 and (b) Scene 4 (200% zoom of Scene 3) used in the experiment. The locations of Textures A and B are randomly on the left or right.

Figure 4.
Scene 1 after tagging different regions of interest (ROIs): ROI_S, ROI_A, and ROI_B.

Figure 5.
Example of eye-gaze trajectories for Scenes (a) 1, (b) 2, (c) 3, and (d) 4. In the four scenes, fixation points were more dispersed in Texture A than in Texture B.
Figure 5.
Example of eye-gaze trajectories for Scenes (a) 1, (b) 2, (c) 3, and (d) 4. In the four scenes, fixation points were more dispersed in Texture A than in Texture B.

Figure 6.
Examples of fixation-transfer counts (FTCs) for four scenes. (a) Scene 1: FTCs in the red circle on the right were greater than those in the blue circle on the left; the final similarity choice was Texture B. (b) Scene 2: FTCs in the red circle on the right were greater than those in the blue circle on the left; the final similarity choice was Texture B. (c) Scene 3: FTCs in the blue circle on the right were less than those in the red circle on the left; the final similarity choice was Texture A. (d) Scene 4: FTCs in the blue circle on the right were less than those in the red circle on the left; the final similarity choice was Texture A.


Table 1.
Statistical analysis of total fixation duration (TFD) for the four scenes in both tests.
| TFD(s) | Scene 1 | Scene 2 | Scene 3 | Scene 4 | ||||
|---|---|---|---|---|---|---|---|---|
| ROI_A | ROI_B | ROI_A | ROI_B | ROI_A | ROI_B | ROI_A | ROI_B | |
| Average | 3.104 | 3.106 | 1.526 | 1.905 | 2.835 | 2.629 | 2.764 | 2.980 |
| Std | 2.314 | 2.844 | 1.347 | 1.414 | 1.456 | 1.779 | 2.757 | 2.581 |
| F-test | F(1,29) = 0.000 | F(1,29) = 1.22 | F(1,29) = 0.000 | F(1,29) = 0.090 | ||||
| p-value | 0.997 | 0.273 | 0.996 | 0.755 | ||||
| 0.000 | 0.019 | 0.000 | 0.002 | |||||
| Average (Sele_A) | 3.832 | 3.308 | 1.862 | 1.979 | 2.865 | 2.272 | 3.220 | 2.305 |
| Std (Sele_A) | 2.576 | 2.826 | 1.821 | 1.597 | 1.462 | 1.181 | 3.339 | 2.034 |
| t-test (Sele_A) | t(16) = 2.434 | t(11) = −0.327 | t(23) = 3.059 | t(16) = 1.674 | ||||
| p-value (Sele_A) | 0.027 | 0.750 | 0.006 | 0.114 | ||||
| Cohen’s d (Sele_A) | 0.194 | 0.068 | 0.447 | 0.327 | ||||
| Average (Sele_B) | 2.151 | 2.843 | 1.343 | 1.870 | 2.712 | 4.061 | 2.167 | 3.864 |
| Std (Sele_B) | 1.154 | 2.962 | 0.869 | 1.311 | 1.504 | 2.979 | 1.536 | 3.015 |
| t-test (Sele_B) | t(12) = −1.327 | t(17) = −1.79 | t(5) = −2.274 | t(12) = −3.286 | ||||
| p-value (Sele_B) | 0.209 | 0.091 | 0.072 | 0.007 | ||||
| Cohen’s d (Sele_B) | 0.293 | 0.474 | 0.567 | 0.709 | ||||
Table 2.
Statistical analysis of fixation-point variance (FPV) for four scenes in both tests.
| FPV | Scene 1 | Scene 2 | Scene 3 | Scene 4 | ||||
|---|---|---|---|---|---|---|---|---|
| ROI_A | ROI_B | ROI_A | ROI_B | ROI_A | ROI_B | ROI_A | ROI_B | |
| Average | 61.137 | 53.003 | 53.218 | 43.762 | 50.285 | 42.683 | 52.141 | 41.349 |
| Std | 20.062 | 23.699 | 22.902 | 18.168 | 16.526 | 17.115 | 15.347 | 12.518 |
| t-test | t(29) = 2.376 | t(29) = 2.284 | t(29) = 2.178 | t(29) = 3.345 | ||||
| p-value | 0.024 | 0.030 | 0.038 | 0.002 | ||||
| Cohen’s d | 0.370 | 0.457 | 0.450 | 0.770 | ||||
| Average (Sele_A) | 65.057 | 48.197 | 68.975 | 41.640 | 54.8534 | 35.779 | 65.7071 | 43.997 |
| Std (Sele_A) | 21.458 | 26.514 | 29.388 | 7.320 | 17.579 | 15.588 | 14.582 | 8.400 |
| t-test (Sele_A) | t(14) = 3.661 | t(5) = 2.603 | t(14) = 4.512 | t(8) = 3.561 | ||||
| p-value (Sele_A) | 0.001 | 0.024 | 0.000 | 0.004 | ||||
| Cohen’s d (Sele_A) | 0.699 | 1.276 | 1.148 | 1.824 | ||||
| Average (Sele_B) | 56.232 | 64.214 | 43.844 | 57.257 | 45.551 | 49.314 | 39.193 | 53.507 |
| Std (Sele_B) | 15.411 | 16.056 | 17.754 | 21.942 | 11.067 | 13.758 | 6.446 | 13.878 |
| t-test (Sele_B) | t(7) = −2.034 | t(5) = −1.835 | t(5) = −2.487 | t(6) = −2.768 | ||||
| p-value (Sele_B) | 0.040 | 0.063 | 0.028 | 0.016 | ||||
| Cohen’s d (Sele_B) | 0.507 | 0.672 | 0.301 | 1.322 | ||||
Table 3.
Statistical analysis of FTCs for four scenes in both tests.
| FTCs | Scene 1 | Scene 2 | Scene 3 | Scene 4 | ||||
|---|---|---|---|---|---|---|---|---|
| FTCs_S,A | FTCs_S,B | FTCs_S,A | FTCs_S,B | FTCs_S,A | FTCs_S,B | FTCs_S,A | FTCs_S,B | |
| Average (Sele_A) | 8.410 | 5.710 | 6.830 | 4.830 | 7.917 | 5.333 | 9.117 | 6.294 |
| Std (Sele_A) | 4.542 | 4.341 | 3.380 | 2.791 | 3.309 | 2.884 | 3.140 | 4.089 |
| t-test (Sele_A) | t(16) = 4.883 | t(11) = 2.966 | t(23) = 6.075 | t(16) = 3.289 | ||||
| p-value (Sele_A) | <0.001 | 0.013 | <0.001 | 0.005 | ||||
| Cohen’s d (Sele_A) | 0.607 | 0.645 | 0.834 | 0.777 | ||||
| Average (Sele_B) | 4.460 | 6.230 | 4.110 | 5.560 | 7.667 | 8.500 | 7.231 | 9.1538 |
| Std (Sele_B) | 2.602 | 2.555 | 1.605 | 2.455 | 5.279 | 5.540 | 3.940 | 5.550 |
| t-test (Sele_B) | t(12) = −3.320 | t(17) = −2.247 | t(5) = −3.464 | t(12) = −2.241 | ||||
| p-value (Sele_B) | 0.006 | 0.038 | 0.018 | 0.045 | ||||
| Cohen’s d (Sele_B) | 0.686 | 0.699 | 0.378 | 0.398 | ||||
Table 4.
FTCs in different ROIs of four tests and final similarity selection.
| Relationships | Scene 1 | Scene 2 | Scene 3 | Scene 4 |
|---|---|---|---|---|
| I | 15/17 | 9/12 | 21/24 | 13/17 |
| II | 8/13 | 13/18 | 5/6 | 8/13 |
© 2020 by the authors. Licensee MDPI, Basel, Switzerland. This article is an open access article distributed under the terms and conditions of the Creative Commons Attribution (CC BY) license (http://creativecommons.org/licenses/by/4.0/).
Share and Cite
MDPI and ACS Style
Guo, X.; Li, L.; Asano, A.; Muraki Asano, C. Influences of Global and Local Features on Eye-Movement Patterns in Visual-Similarity Perception of Synthesized Texture Images. Appl. Sci. 2020, 10, 5552. https://doi.org/10.3390/app10165552
AMA Style
Guo X, Li L, Asano A, Muraki Asano C. Influences of Global and Local Features on Eye-Movement Patterns in Visual-Similarity Perception of Synthesized Texture Images. Applied Sciences. 2020; 10(16):5552. https://doi.org/10.3390/app10165552
Chicago/Turabian StyleGuo, Xiaoying, Liang Li, Akira Asano, and Chie Muraki Asano. 2020. "Influences of Global and Local Features on Eye-Movement Patterns in Visual-Similarity Perception of Synthesized Texture Images" Applied Sciences 10, no. 16: 5552. https://doi.org/10.3390/app10165552
Note that from the first issue of 2016, this journal uses article numbers instead of page numbers. See further details here.