Article

Structural and Phase Evolution upon Annealing of Fe76Si9−xB10P5Mox (x = 0, 1, 2 and 3) Alloys

1
Centro de Investigación, Innovación y Desarrollo de Materiales, CIDEMAT, Universidad de Antioquia UdeA, Calle 70 No. 52–21, 050010 Medellín, Colombia
2
Erich Schmid Institute of Materials Science, Austrian Academy of Sciences, Jahnstraße 12, A 8700 Leoben, Austria
3
Laboratory of Metal Physics and Technology, Department of Materials, ETH Zurich, Vladimir-Prelog-Weg, CH-8093 Zurich, Switzerland
4
Department of Materials Science, Chair of Materials Physics, Montanuniversität Leoben, Jahnstraße 12, A 8700 Leoben, Austria
*
Author to whom correspondence should be addressed.
Previous address: Institute for Complex Materials, Leibniz Institute for Solid State and Materials Research (IFW Dresden), Helmholtzstr. 20, D-01069 Dresden, Germany.
Adjunct with National University of Science and Technology (MISiS), LeninskyProsp., 4, 119049 Moscow, Russia.
Metals 2020, 10(7), 881; https://doi.org/10.3390/met10070881
Submission received: 18 May 2020 / Revised: 22 June 2020 / Accepted: 24 June 2020 / Published: 2 July 2020
(This article belongs to the Special Issue Heterogeneities in Metallic Glasses)

Abstract

:
Alloying elements play an important role in adjusting the magnetic and thermal properties of Fe-based amorphous alloys. In this work, the effect of Mo addition on the thermal stability, structural evolution, and magnetic properties of Fe76Si9B10P5 metallic glass was studied. The study revealed that the substitution of a small amount of Mo (1 at.%) for Si enhances the glass-forming ability (GFA) but reduces the thermal stability of the alloy, causing a reduction of the supercooled liquid region. Substitution of up to 3 at.% Mo for Si lowers the Curie temperature from 677 to 550 K and the saturation magnetization drops from 160 to 138 Am2/kg. The structural evolution was evaluated by annealing the glassy samples at different temperatures, revealing that the crystallization proceeds in multiple steps, beginning with the formation of different iron borides (FeB, Fe2B, FeB2 and Fe23B6) followed by transformation to a mixture of more stable phases.

1. Introduction

Since the discovery of amorphous alloys [1], a wide variety of systems have been developed in the continuous search for a good combination of properties. Fe-based amorphous alloys are known for their good soft magnetic behavior, presenting high saturation magnetization, low coercivity, and low core losses [2]; however, their restricted thermal stability and glass-forming ability (GFA) limits their applications [3]. To date, a wide variety of alloy systems have been developed searching for a virtuous combination of good soft magnetic properties and good GFA; it has been reported that the proper addition of some elements like Al, Ga, Nb, Zr, Ni, and Er to Fe-based alloys may improve the GFA of the systems, as well as vary mechanical, physical and magnetic properties [4,5,6,7]. Nevertheless, most of these elements are rare and expensive, and in most cases, result in considerable effects on other properties [8].
The influence of Mo as an alloying element on the structural evolution during annealing of iron-based amorphous alloys has not been clarified yet in detail. The knowledge of this behavior is important if the objective is to tailor the material properties by heat treatment of the amorphous precursor for a specific application, even if no crystallization process is involved. Makino et al. [9,10] developed a Fe-based alloy with good magnetic properties and high glass-forming ability by adding P to a conventional Fe-Si-B alloy, achieving a high saturation magnetization (1.51 T), low coercivity (0.8 A/m), and a critical diameter of 2.5 mm. It has also been reported that the addition of small amounts of Mo can successfully enhance the GFA of Fe-based alloys due to its relatively large atomic radius and large negative enthalpies of mixing (ΔHmix) with the most common elements in these alloys, such as B, Si, P, and C [11,12]. The previously-reported alloy compositions include elements that promote nanocrystalline structures by proper additions of alloying elements, increasing in this way the opportunity for developing new soft magnetic amorphous and nanocrystalline alloys [13,14,15,16,17,18,19].
In this article, we will discuss the changes in GFA, thermal, and magnetic properties, as well as the structural evolution during isothermal annealing at various temperatures caused by the addition of Mo to the Fe76Si9B10P5 glass. As the Mo content increases, the soft magnetic properties are considerably deteriorated by the change in the chemical composition and the phase evolution associated with the structural changes during the annealing of the samples.

2. Experimental Procedure

The master alloys with compositions of Fe76Si9−xB10P5Mox (x = 0, 1, 2 and 3) were prepared by melting together pieces of Fe (99.9% mass), Mo (99.9% mass), crystalline B (99.5% mass), crystalline Si (99.99% mass) and an FeP pre-alloy containing 14 at.% P under a protective argon atmosphere. In this process, induction melting was preferred in order to assure good homogeneity of the entire master alloy. The pieces of the master alloys were re-melted in a quartz crucible and the molten material was then ejected onto the surface of a copper wheel rotating at a tangential speed of 44 m/s. The temperature was carefully monitored by an infrared pyrometer. For preparing the rod samples, a water-cooled copper mold was used.
The structural characterization of the as-spun and annealed ribbons was performed by X-ray diffraction (XRD) using a PANalytical X’pert Pro diffraction system (PANalytical, Almelo, Netherlands) with Co-Kα (λ = 1.789010) radiation. The thermal behavior of the as-spun ribbons was evaluated using a NETZSCH DSC 404C differential scanning calorimeter (NETSCH, Selb, Germany) at a heating rate of 20 K/min and by thermogravimetric analysis (TGA) in the presence of a weak magnetic field produced by a permanent magnet; this analysis was carried out in a TGA Q500 thermogravimetric analyzer (TA instruments, New Castle, Unites States) at a heating rate of 10 K/min. Transmission electron microscopy (TEM) of the samples was carried using an FEI Tecnai G2-F20 super twin microscope (FEI company, Tokyo, Japan); the latter results were used to design the annealing process. The samples were annealed at different temperatures using the same NETZSCH DSC 404C for 60 s, employing a constant heating and cooling rate of 20 K/min for heating up to the desired annealing temperature and for quenching to room temperature after the annealing treatment. For magnetic measurements, DC M-H hysteresis loops were measured with a vibrating sample magnetometer (VSM) (Quantum Design North America, San Diego, Unites States) at ambient temperature. The accuracy of the measured data lies within ± 3 K in the case of the DSC measurements and ±80 A/m (~1 Oe) for the VSM measurements.

3. Results and Discussion

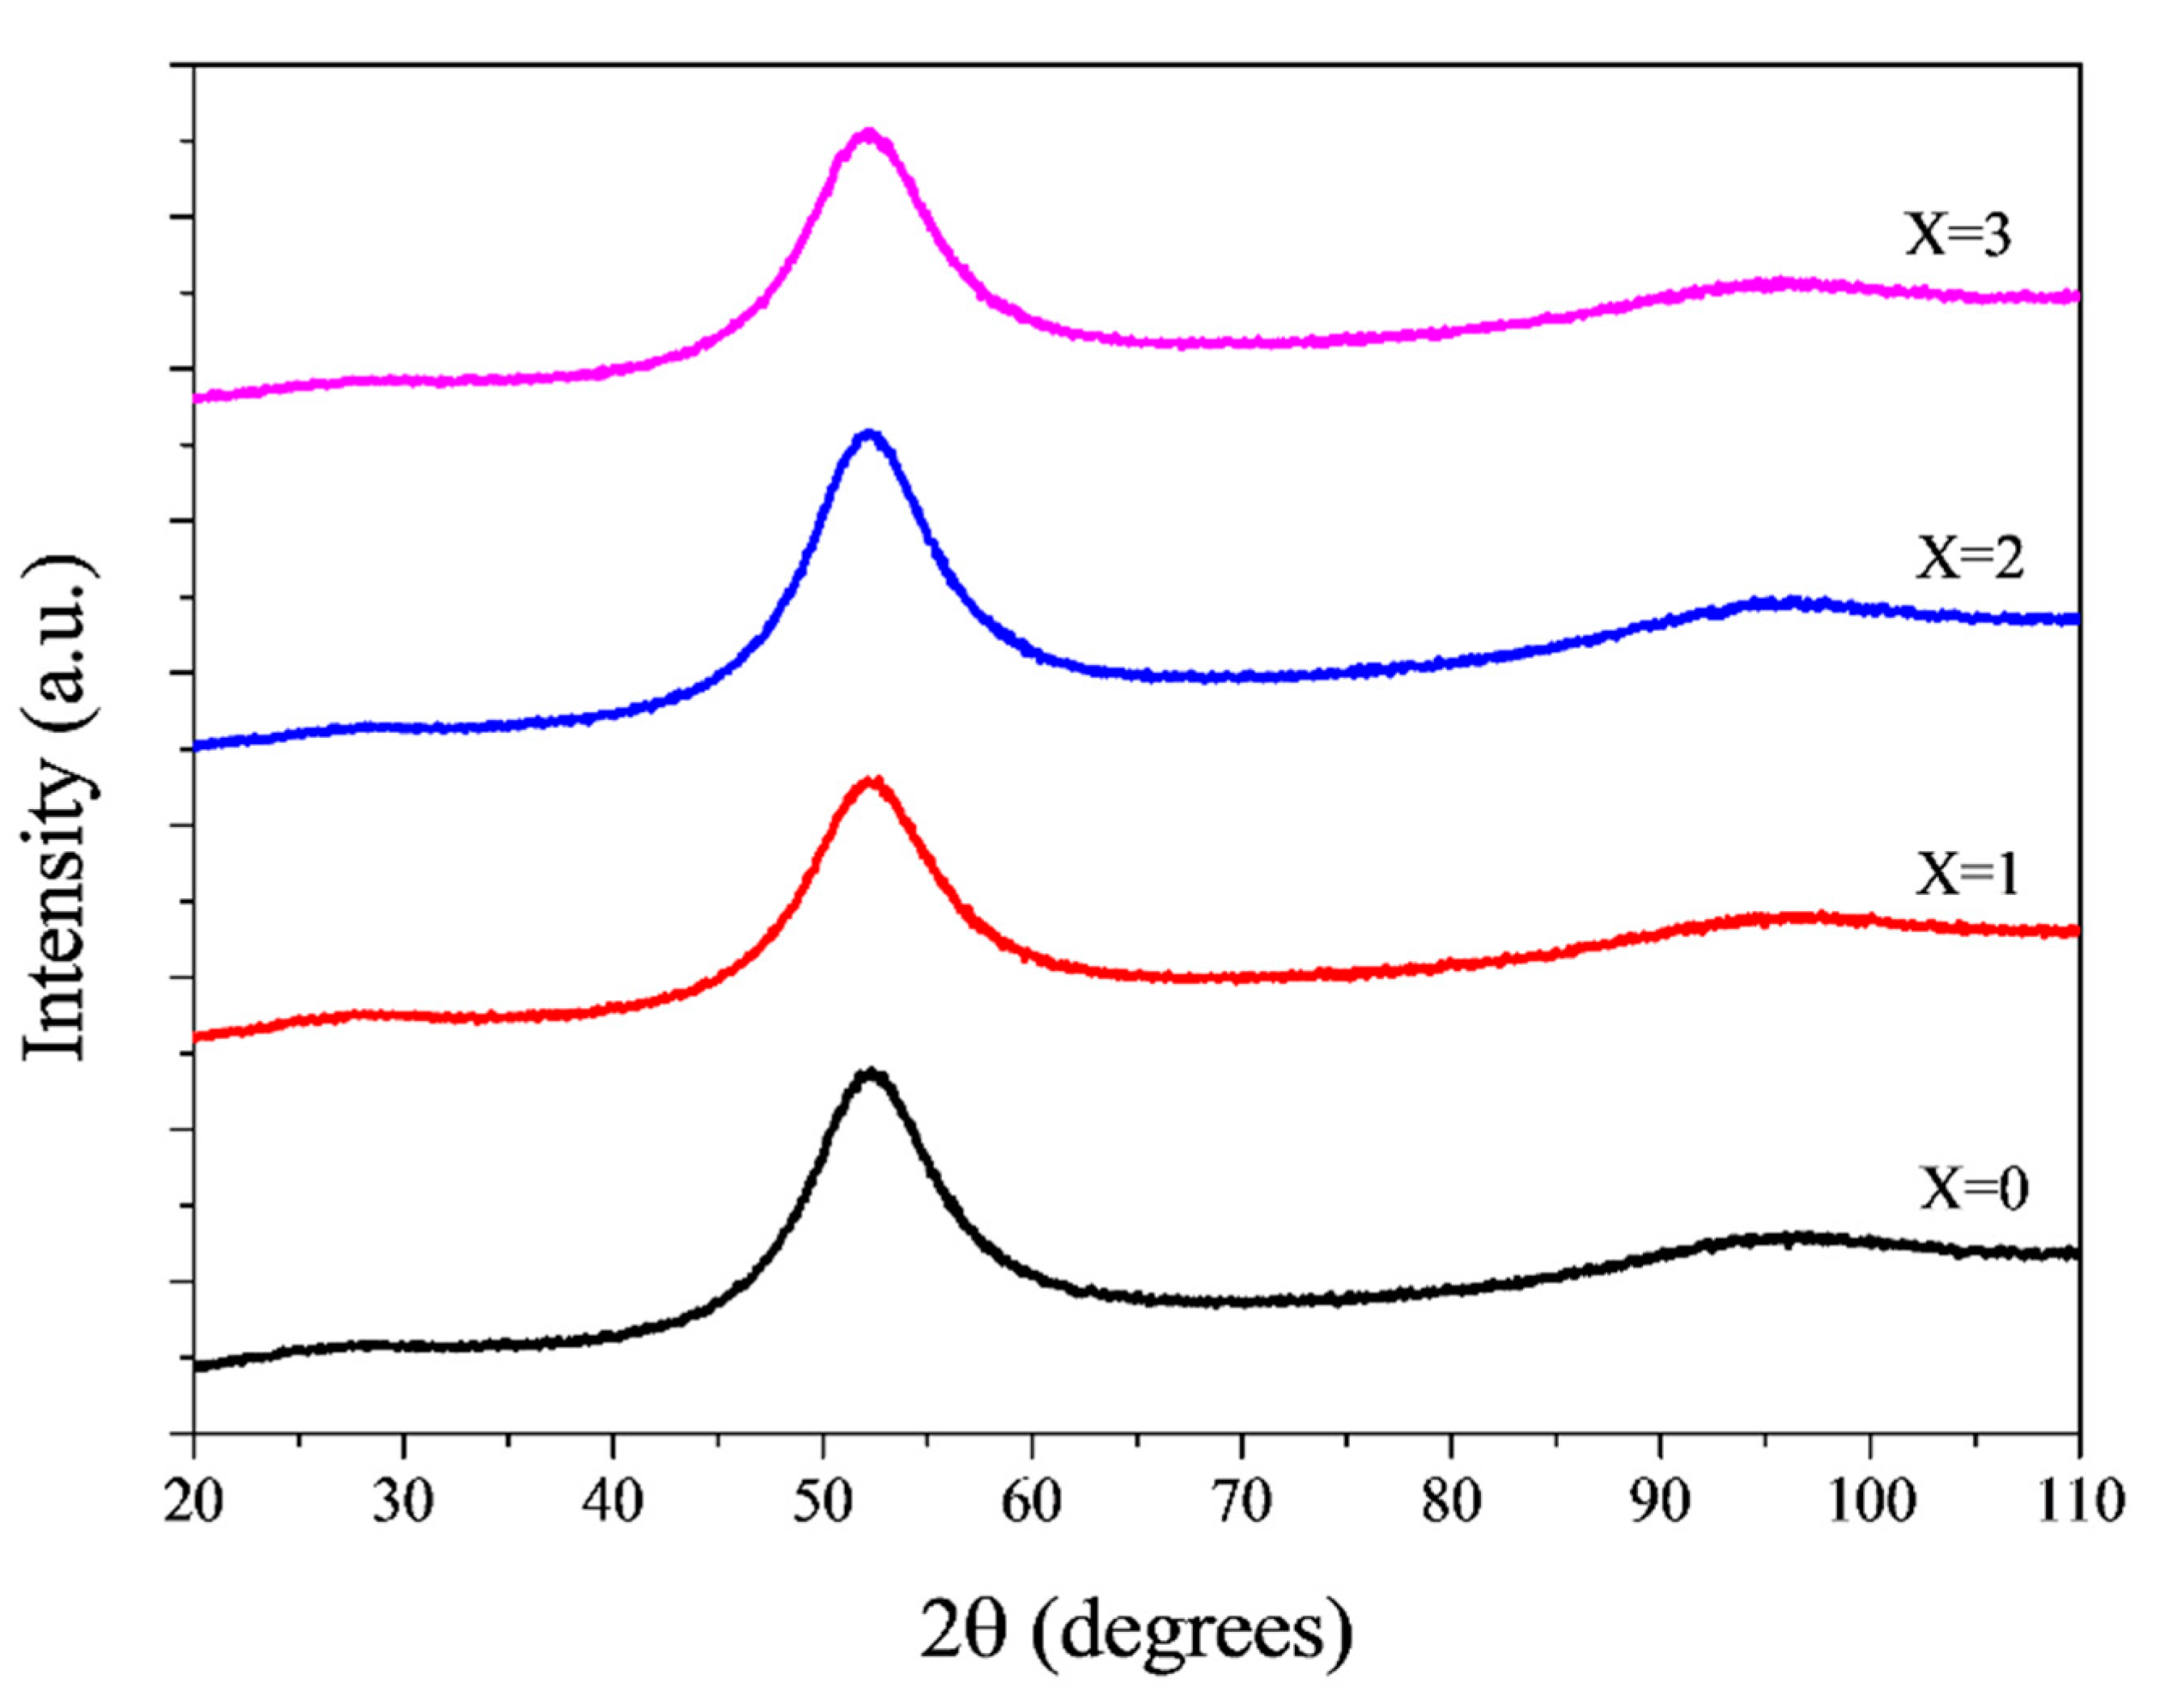
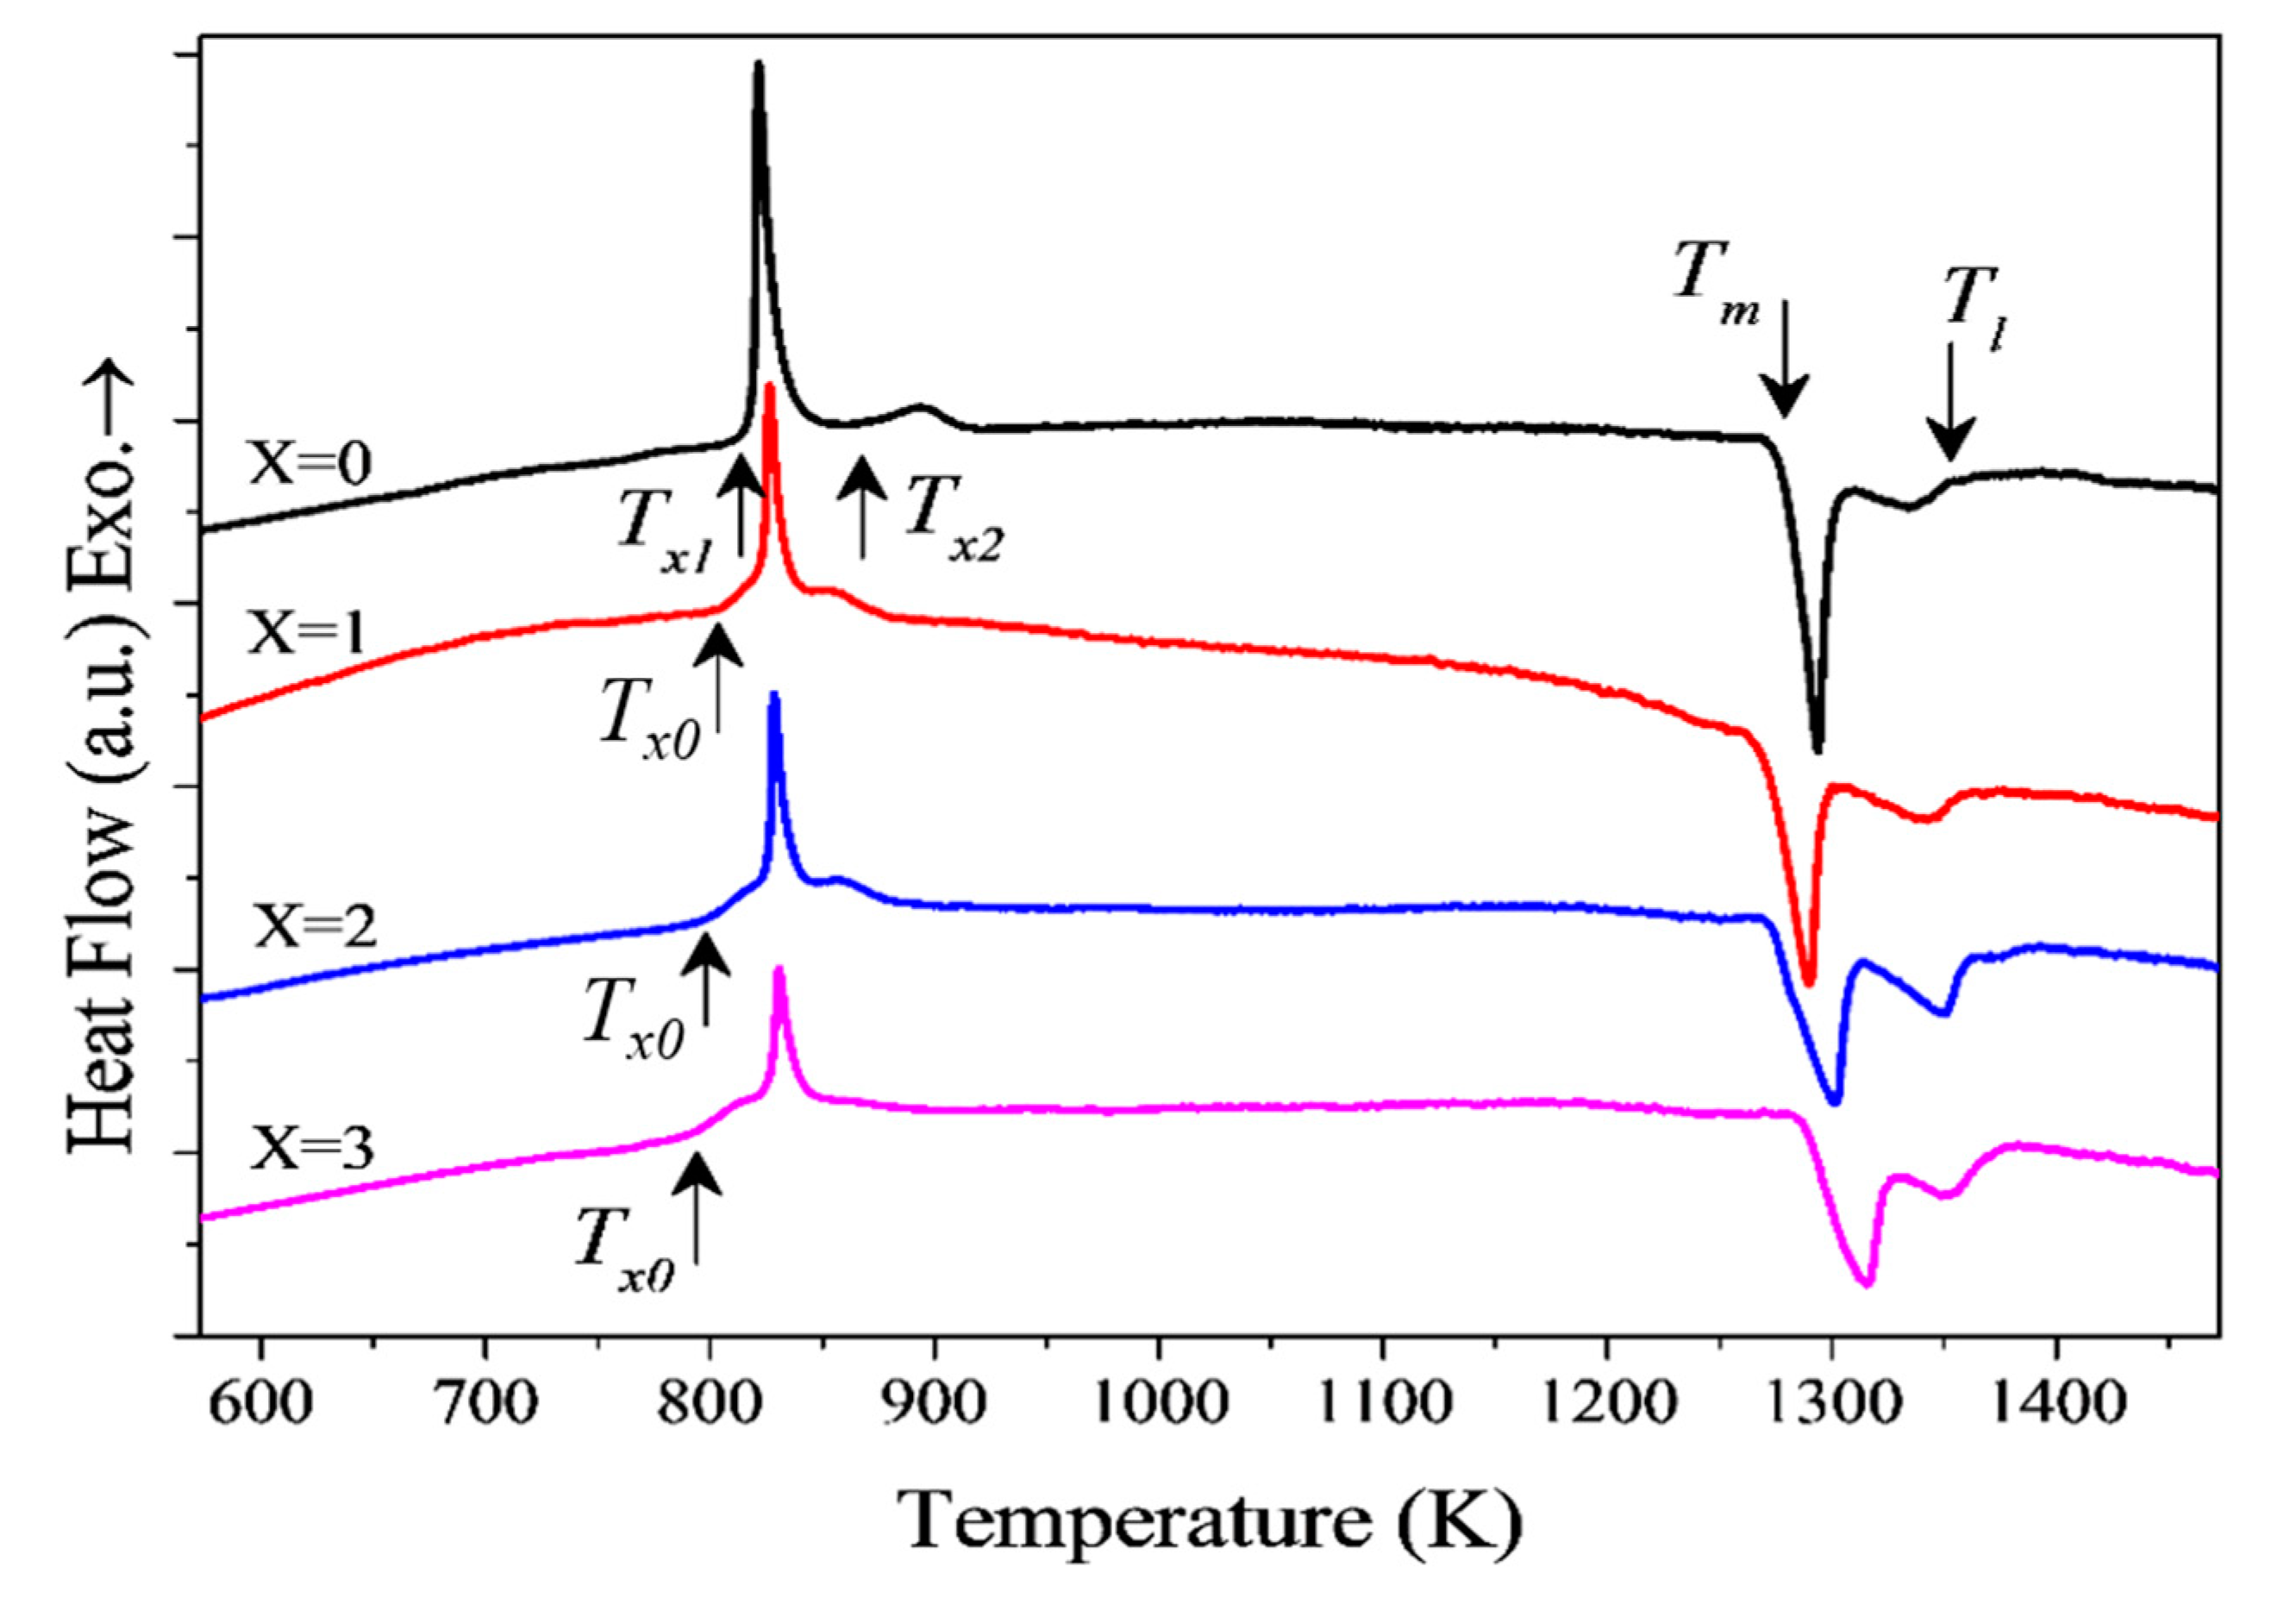
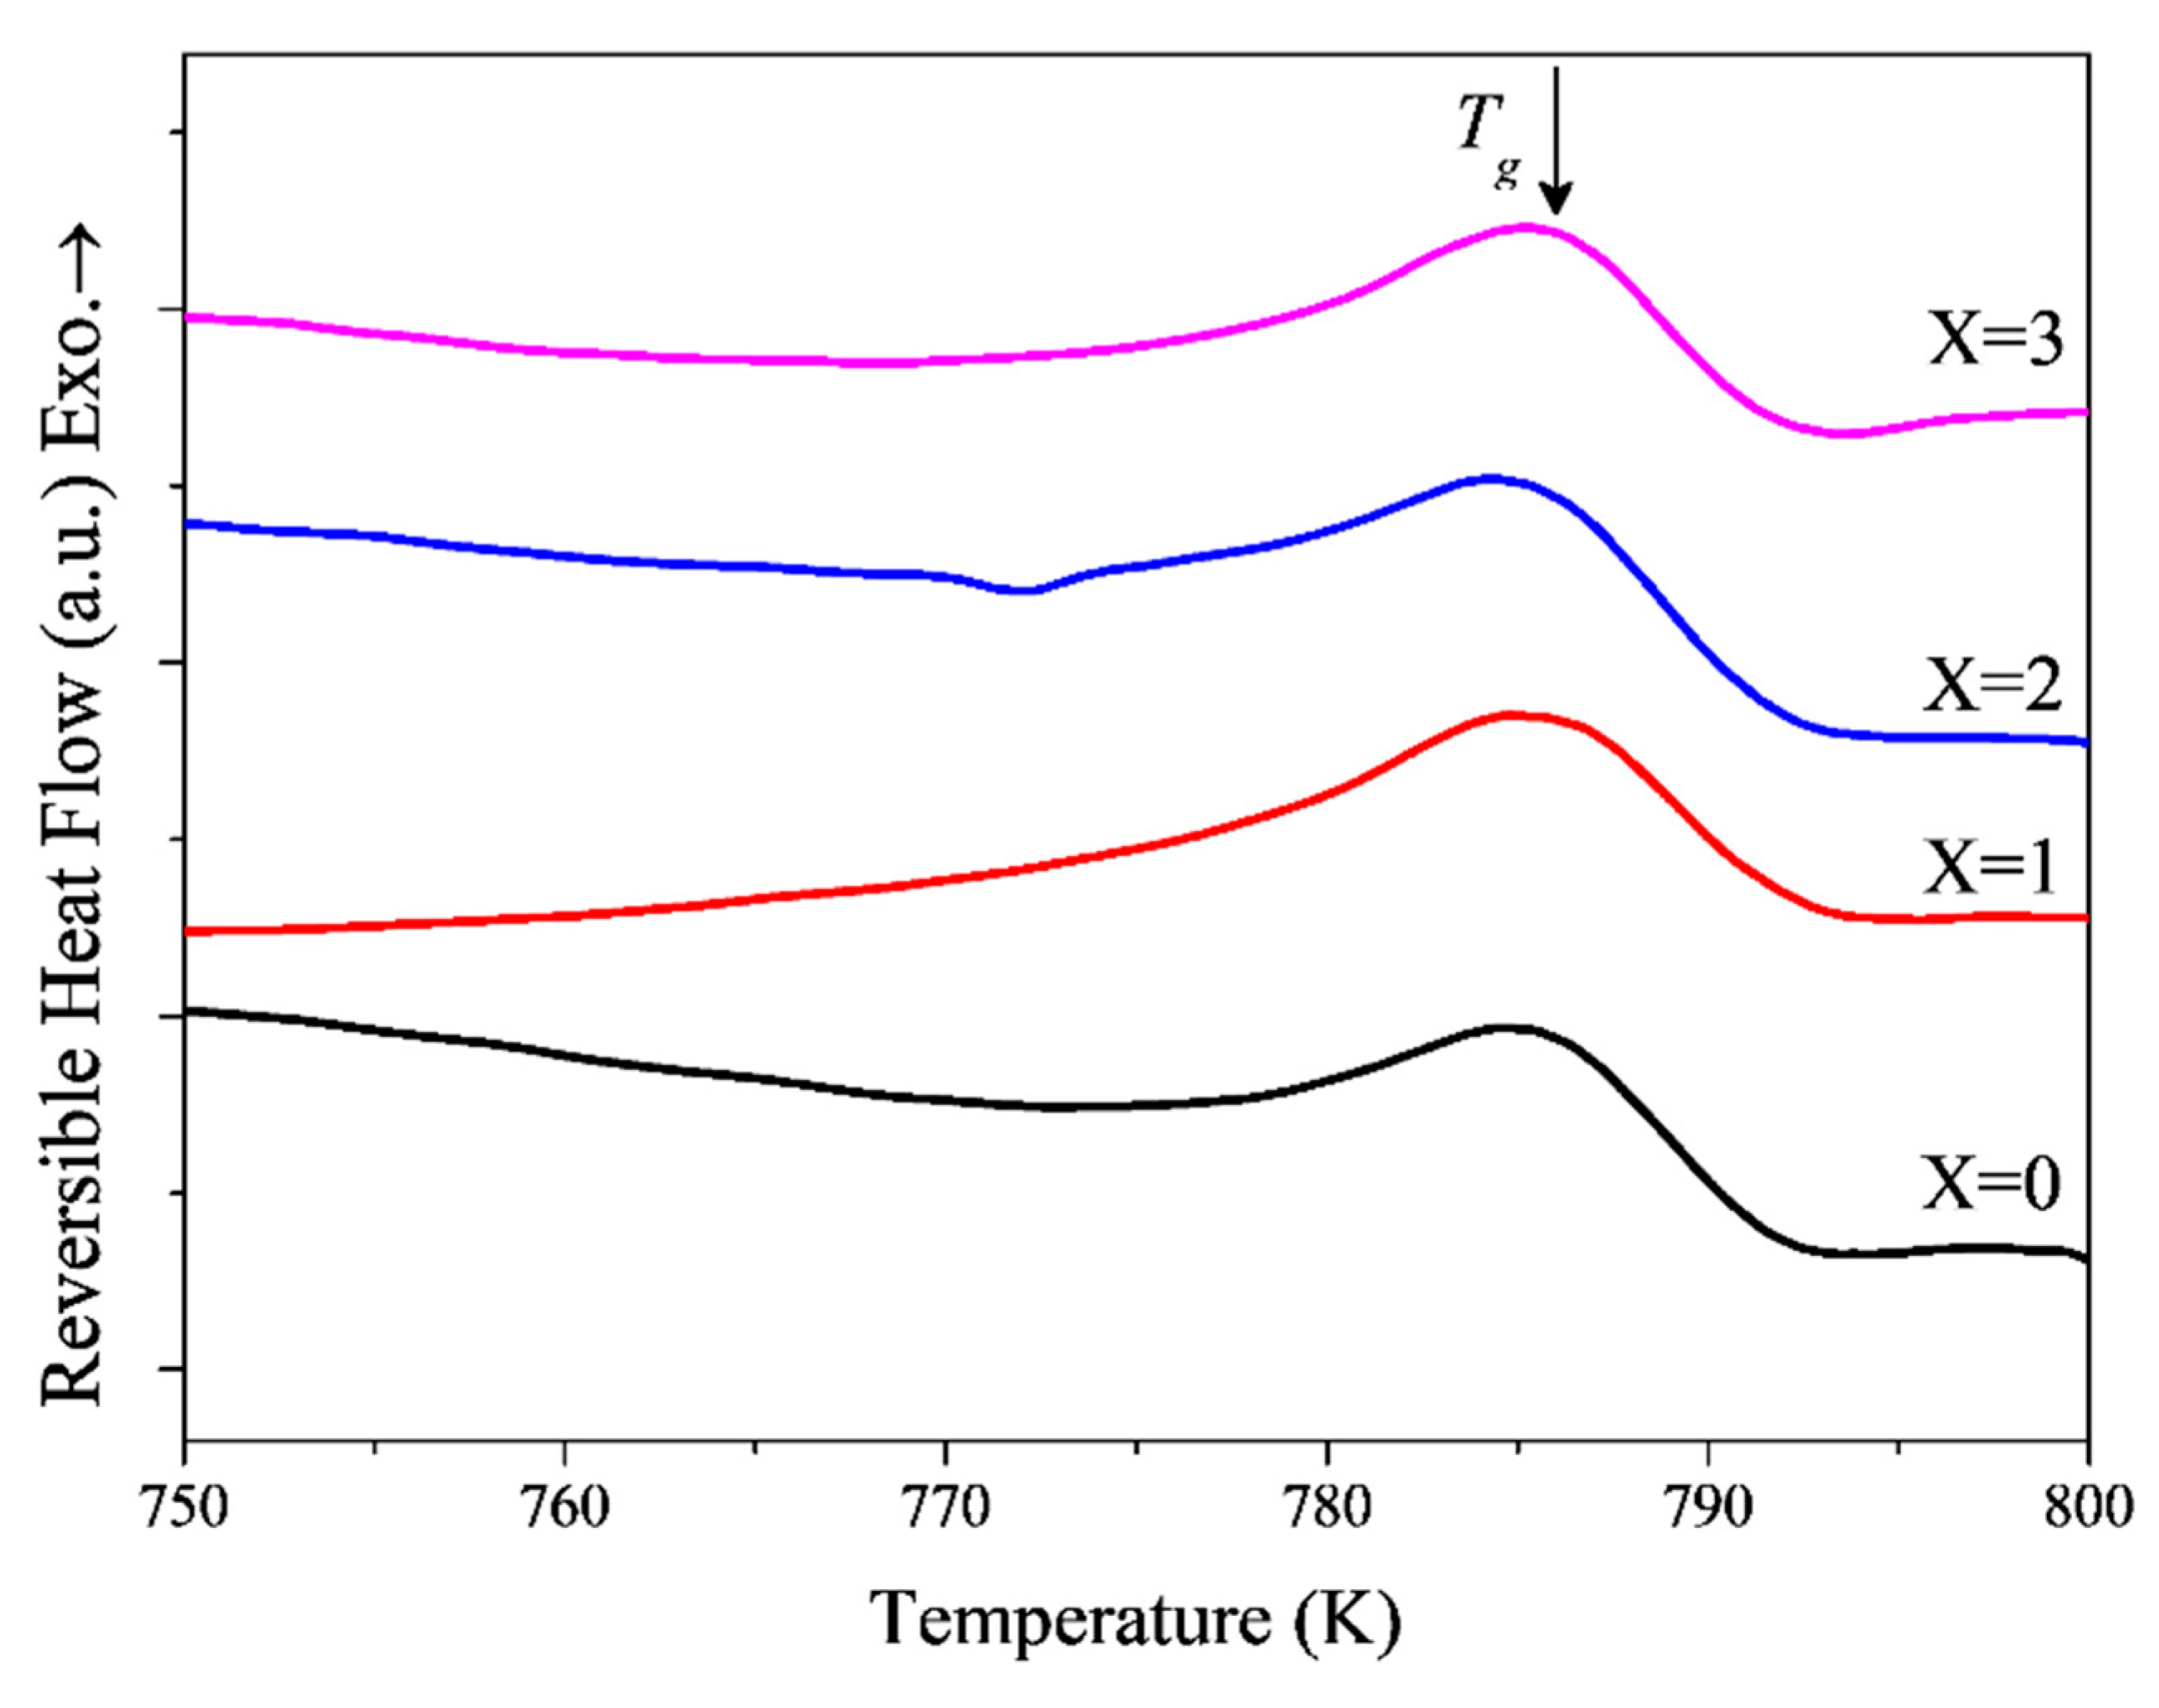
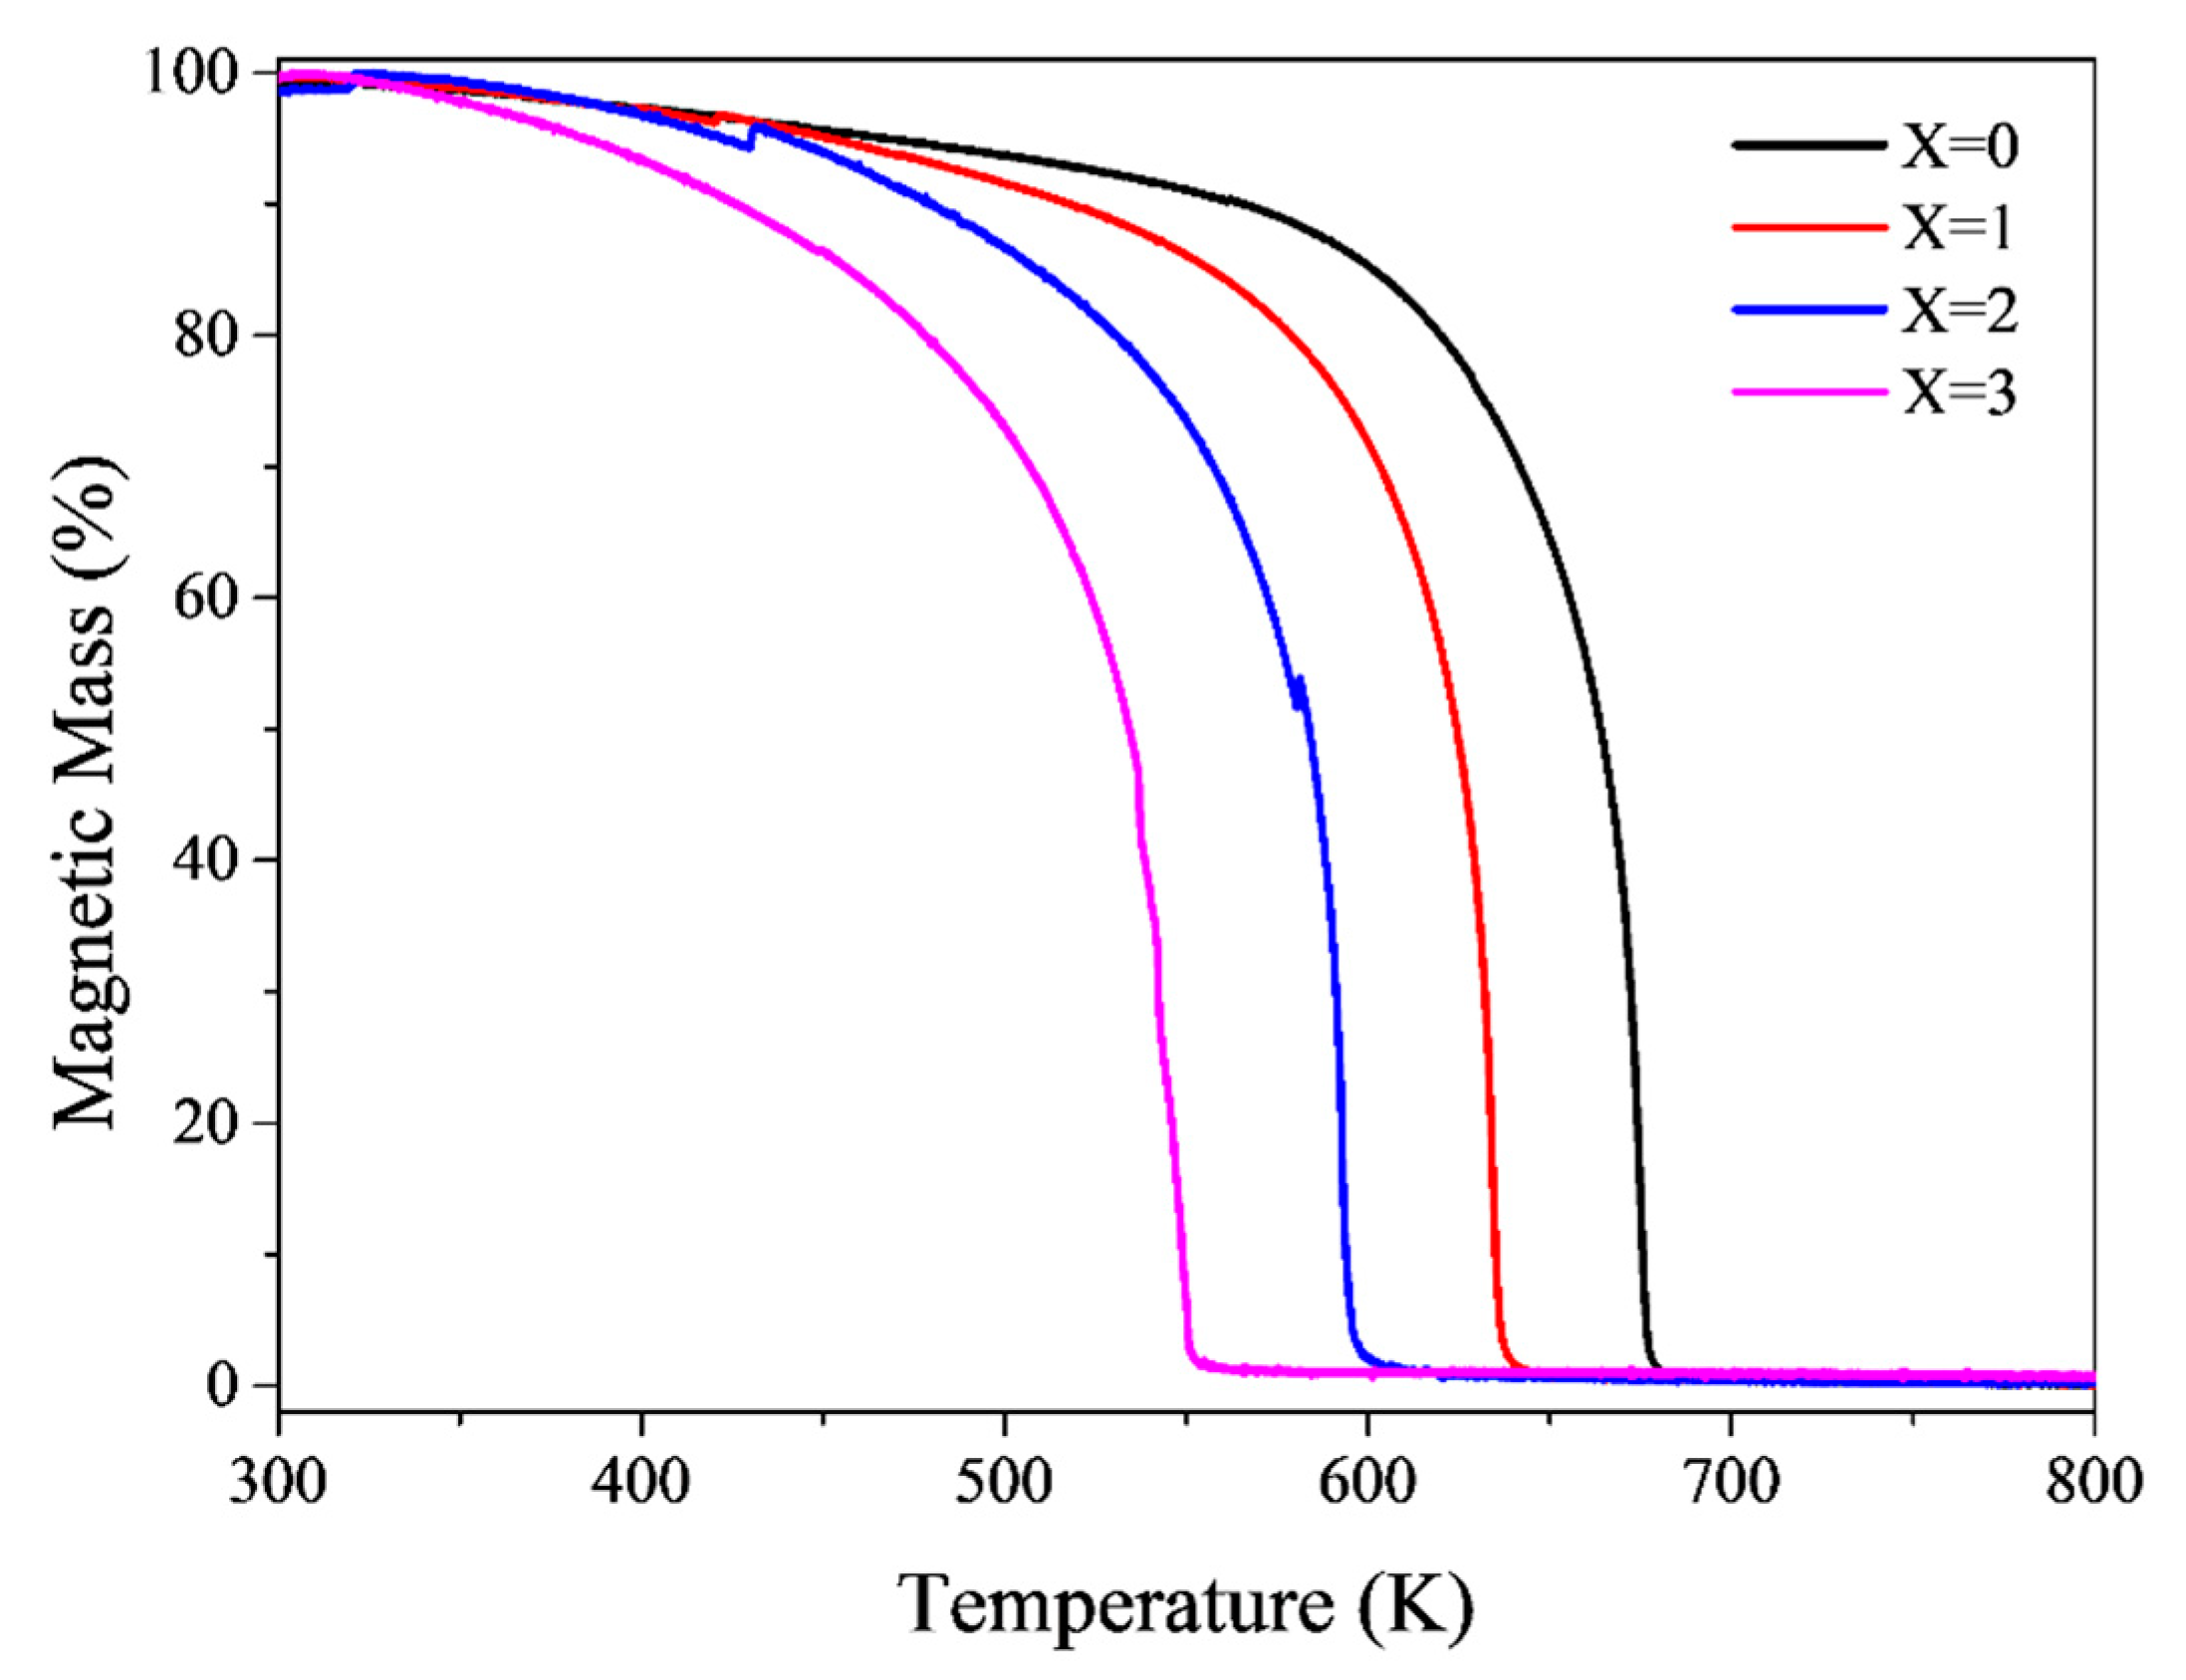
3.1. Thermal and Structural Characterization

Figure 1 shows the diffraction patterns of the as-spun ribbons; all the patterns exhibit broad diffraction maxima characteristic of amorphous materials. For comparison, the XRD pattern of the base alloy without Mo is also included. Figure 2 displays the DSC curves of the as-spun amorphous ribbons with 1, 2 and 3 at.% Mo as well as the base alloy, measured at a heating rate of 20 K/min. The temperatures Tx, Tm and Tl, which are marked in DSC curves, are the onset temperatures of crystallization, the melting temperature and the liquidus temperature, respectively; apparently, the base alloy crystallizes via two exothermic events at 816 and 867 K, corresponding to the crystallization temperatures Tx1 and Tx2, respectively. With the increase in the molybdenum content there is a displacement of both crystallization events: the crystallization peak, Tp1, moves slightly to the right from 824 to 830 K with addition of 1 at.% Mo and the second peak of crystallization gets closer to the first, to the point of looking like a single exothermic event for the alloy with 1 at.% Mo. The alloys with 2 and 3 at.% Mo show a hump to the left of the crystallization peak (798 for 2 at.% Mo and 791 K for 3 at.% Mo), that is, at a temperature lower than the initial Tx1 of 816 K, indicating the appearance of a third exothermic peak, Tx0. In turn, the melting temperature, Tm, is reduced from 1279 to 1263 K with the addition of 1 at.% Mo and gradually increases to 1287 K as Mo reaches 3% Mo.
In Figure 2, the glass transition temperature of the alloys is not clearly visible. For this reason, the as-spun samples were subjected to a modulated DSC (MDSC) analysis. The results of the MDSC are shown in Figure 3. In this analysis, the signals measured by the device are separated and the curve corresponding to the reversible heat flow associated with the samples during the heating is analyzed [20]. As a result, the event corresponding to the glass transition temperature remains approximately constant at 786 K. It is seen that the thermal stability of the material deteriorates with the addition of Mo because, as Tg remains constant, the appearance of the third crystallization peak, Tx0, below Tx1 results in a considerable shrinkage of the supercooled liquid region, ΔTx. The thermal stability data, such as Tg, Tx, ΔTx, Tm, Tp and Tl etc. are listed in Table 1.
Table 1 shows the results obtained from the TGA, DSC, and MDSC analyses. The GFA of Mo free glass is poor despite having higher ΔTx than Mo containing glasses. With 1 at.% Mo we were able to cast amorphous rods with 2 mm diameter, however for 0, 2 and 3 at.% Mo content we were able to produce only ribbons. It can be deduced that there is a poor correlation between the parameters used to measure the GFA and the results reported by Zhang et al. [21], who found an increase in the GFA with Mo addition, achieving a maximum casting diameter of 3.5 mm when 2 at.% Mo were added to the FeSiBP system. Another work reporting a poor correlation between the parameters to measure the GFA and the critical diameter obtained for iron-based BMGs has also been reported by Ponnambalam et al. [22].
The DSC analysis served as a basis to establish the isothermal annealing temperatures between 773 and 1073 K for further studying the crystallization behavior of the different alloys. Figure 4 depicts the XRD patterns of the metallic glasses annealed at different temperatures. The patterns of the as-spun samples are also shown for comparison. At 773 K all the alloys are still amorphous. For the base alloy annealed at 813 K, a mixture of several crystalline phases (Fe2B, FeB, FeB2, Fe23B6) formed. These phases transform into more stable phases such as α-Fe(Si), Fe2B, Fe3(B,P) upon annealing at 1073 K. Hence, it can be concluded that the mechanism of crystallization in the base alloy occurs by means of a multi-stage process. With the addition of Mo, the appearance of a small peak corresponding to the crystalline phase Fe23B6 is observed during annealing at 813 K. The intensity of the peaks of this phase increases as the Mo content increases. When comparing this result with the data obtained by constant-rate heating DSC it can be deduced that the preferential precipitation of the Fe23B6 phase in the Mo-containing samples is linked to the appearance of the exothermic peak starting at Tx0, while the formation of the iron borides observed in the base alloy is correlated with the displacement of the crystallization peak Tp1 to higher temperatures. As an effect of this displacement, the alloys with Mo show at 873 K the precipitation of the same intermediate phases that appear in the base alloy starting from 813 K, accompanied by the phases FeMo and Fe0.875Mo0.125; at higher annealing temperatures, the precipitation of the α-Fe phase dominates.
The structural evolution in Mo free glass upon annealing is more complicated than previously reported by Zhang et al. [21]. In their work, they reported only the formation of Fe23B6, Fe3(B,P), and α-Fe(Si) phases, however in our work we observed several metastable phases like Fe2B, FeB, FeB2 close to the onset of first crystallization event. Understanding the formation and decomposition sequence of these metastable phases are key to improve the GFA and magnetic properties of these glassy alloys. For precise identification of the metastable phases, TEM investigations were performed.

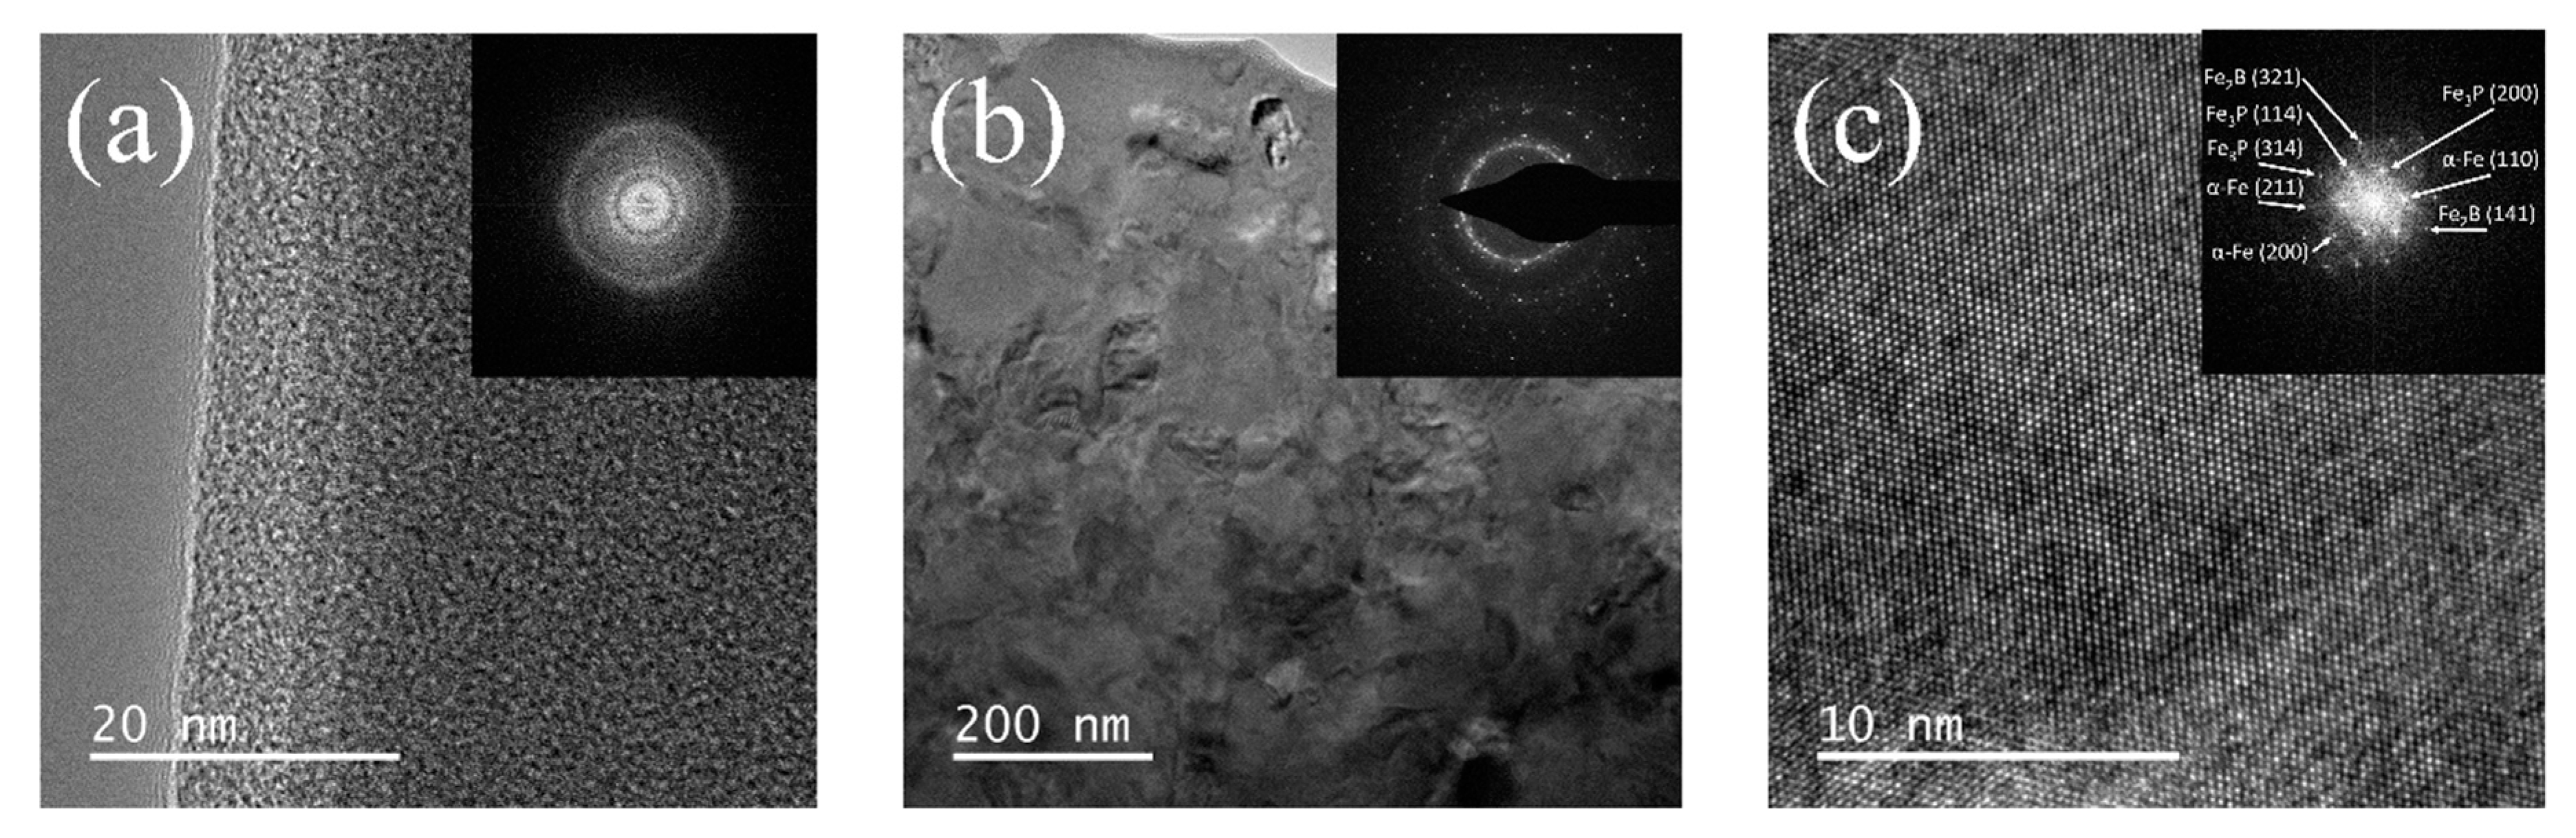
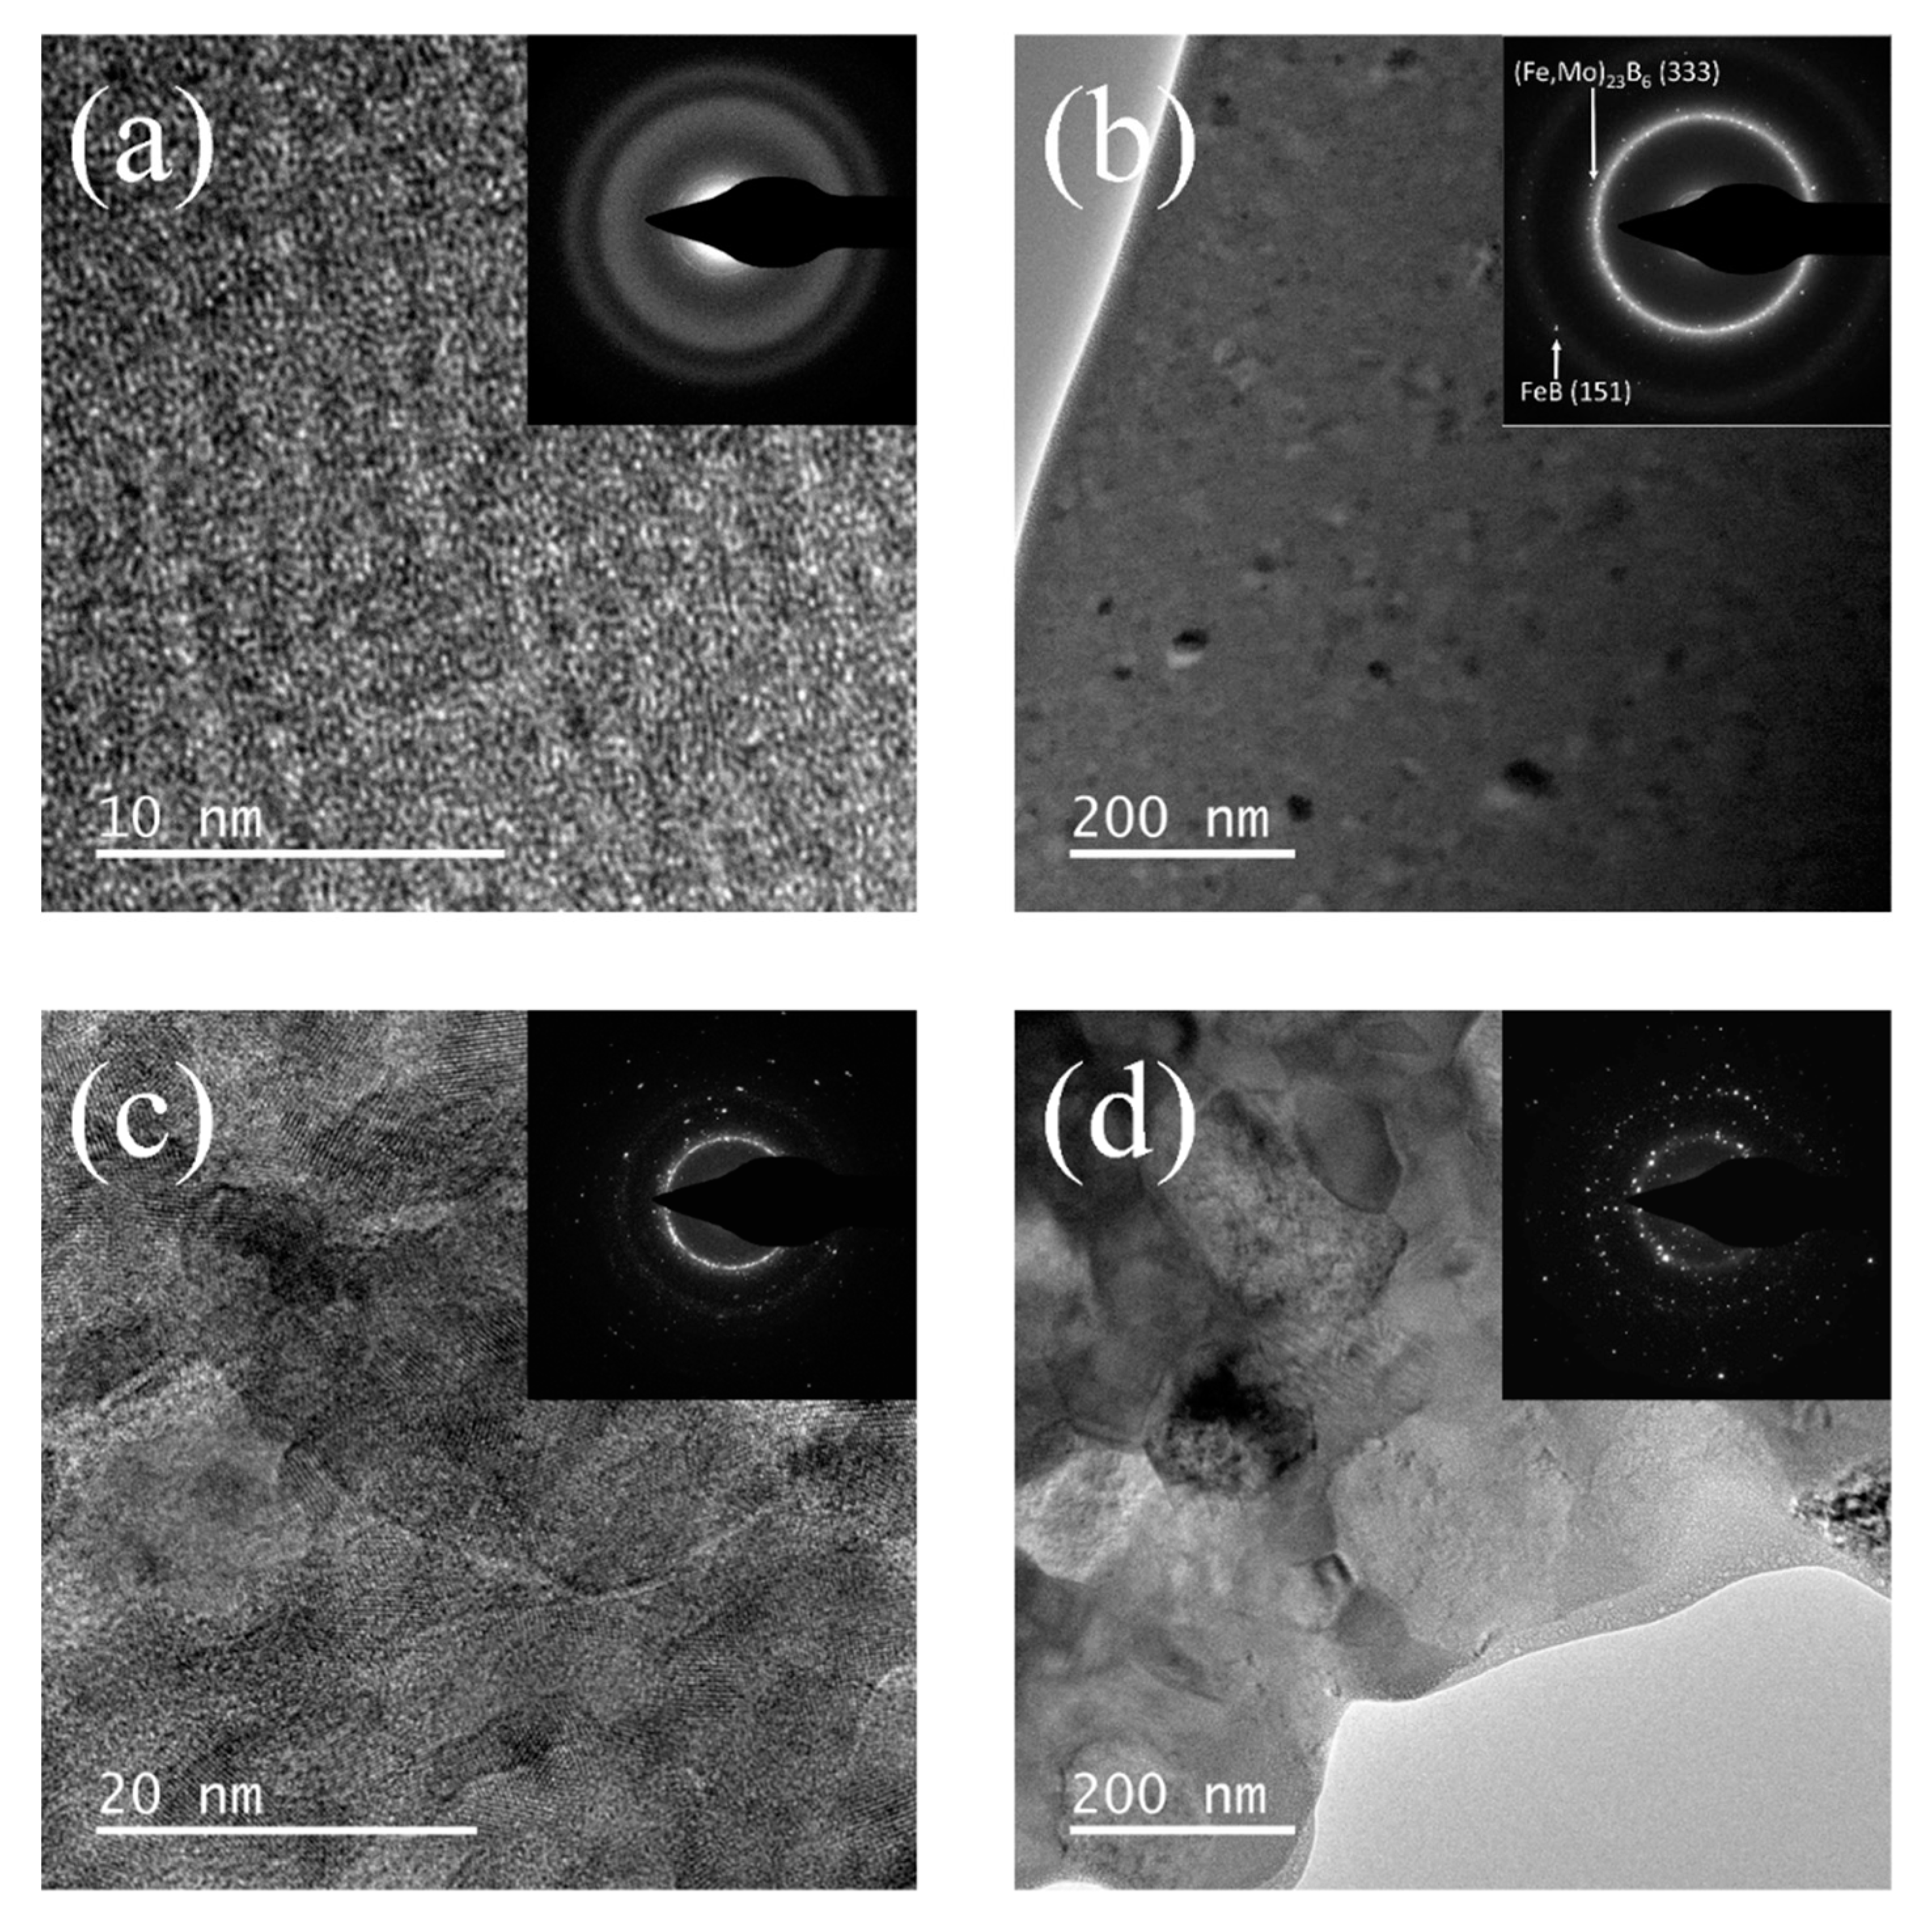
3.2. Microstructural Evaluation

For more detailed TEM characterization, the Fe76Si9B10P5 and Fe76Si7B10P5Mo2 alloys were chosen to understand the difference in the crystallization sequence between Mo-free and Mo-containing glasses. Figure 5 shows TEM images of the Fe76Si9B10P5 alloy in the as-spun state and annealed at 813 and 873 K, along with their respective selected-area electron diffraction (SAED) patterns. As shown in Figure 5a, the as-spun sample is completely amorphous. No clusters or indications for ordered crystalline regions are observed in the high-resolution image, and the SAED pattern only displays the characteristic features of amorphous material. The sample annealed at 813K reveals the complex crystallization process (Figure 5b). At low magnification, 50–100 nm-sized grains randomly distributed in the amorphous matrix can be observed. This result is consistent with the SAED pattern, displaying multiple diffraction spots superimposed on the halo of the amorphous matrix, corresponding to planes of the different crystalline phases precipitated. Figure 5c shows a high-resolution image of a sample annealed at 1073 K corresponding to a magnification of one of the grains found in the sample in which an arrangement of atoms is present. As can be seen from the respective SAED pattern, the grain is composed of a mixture of phases: one can distinguish (110), (200), and (211) planes of the α-Fe(Si) phase, (314), (114), and (200) planes of Fe3(B,P) and (321), and (141) planes of Fe2B.
The TEM analysis of the Fe76Si7B10P5Mo2 alloy shown in Figure 6 presents its crystallization process upon annealing at different temperatures. In the amorphous state, the alloy has a homogeneous structure. Heat treatment at 813 K, slightly above Tx0, causes the formation of nanometer-sized crystals (20–50 nm) of the metastable phase (Fe,Mo)23B6 along with small amounts of FeB embedded in the amorphous matrix (Figure 6b). As can be seen in Figure 6c,d, the images of the samples annealed at 873 and 1073 K evidence that annealing at a higher temperature accelerates the crystallization process of new phases, as well as the growth and transformation of the initial grains of the metastable phase (Fe,Mo)23B6 to more stable phases.

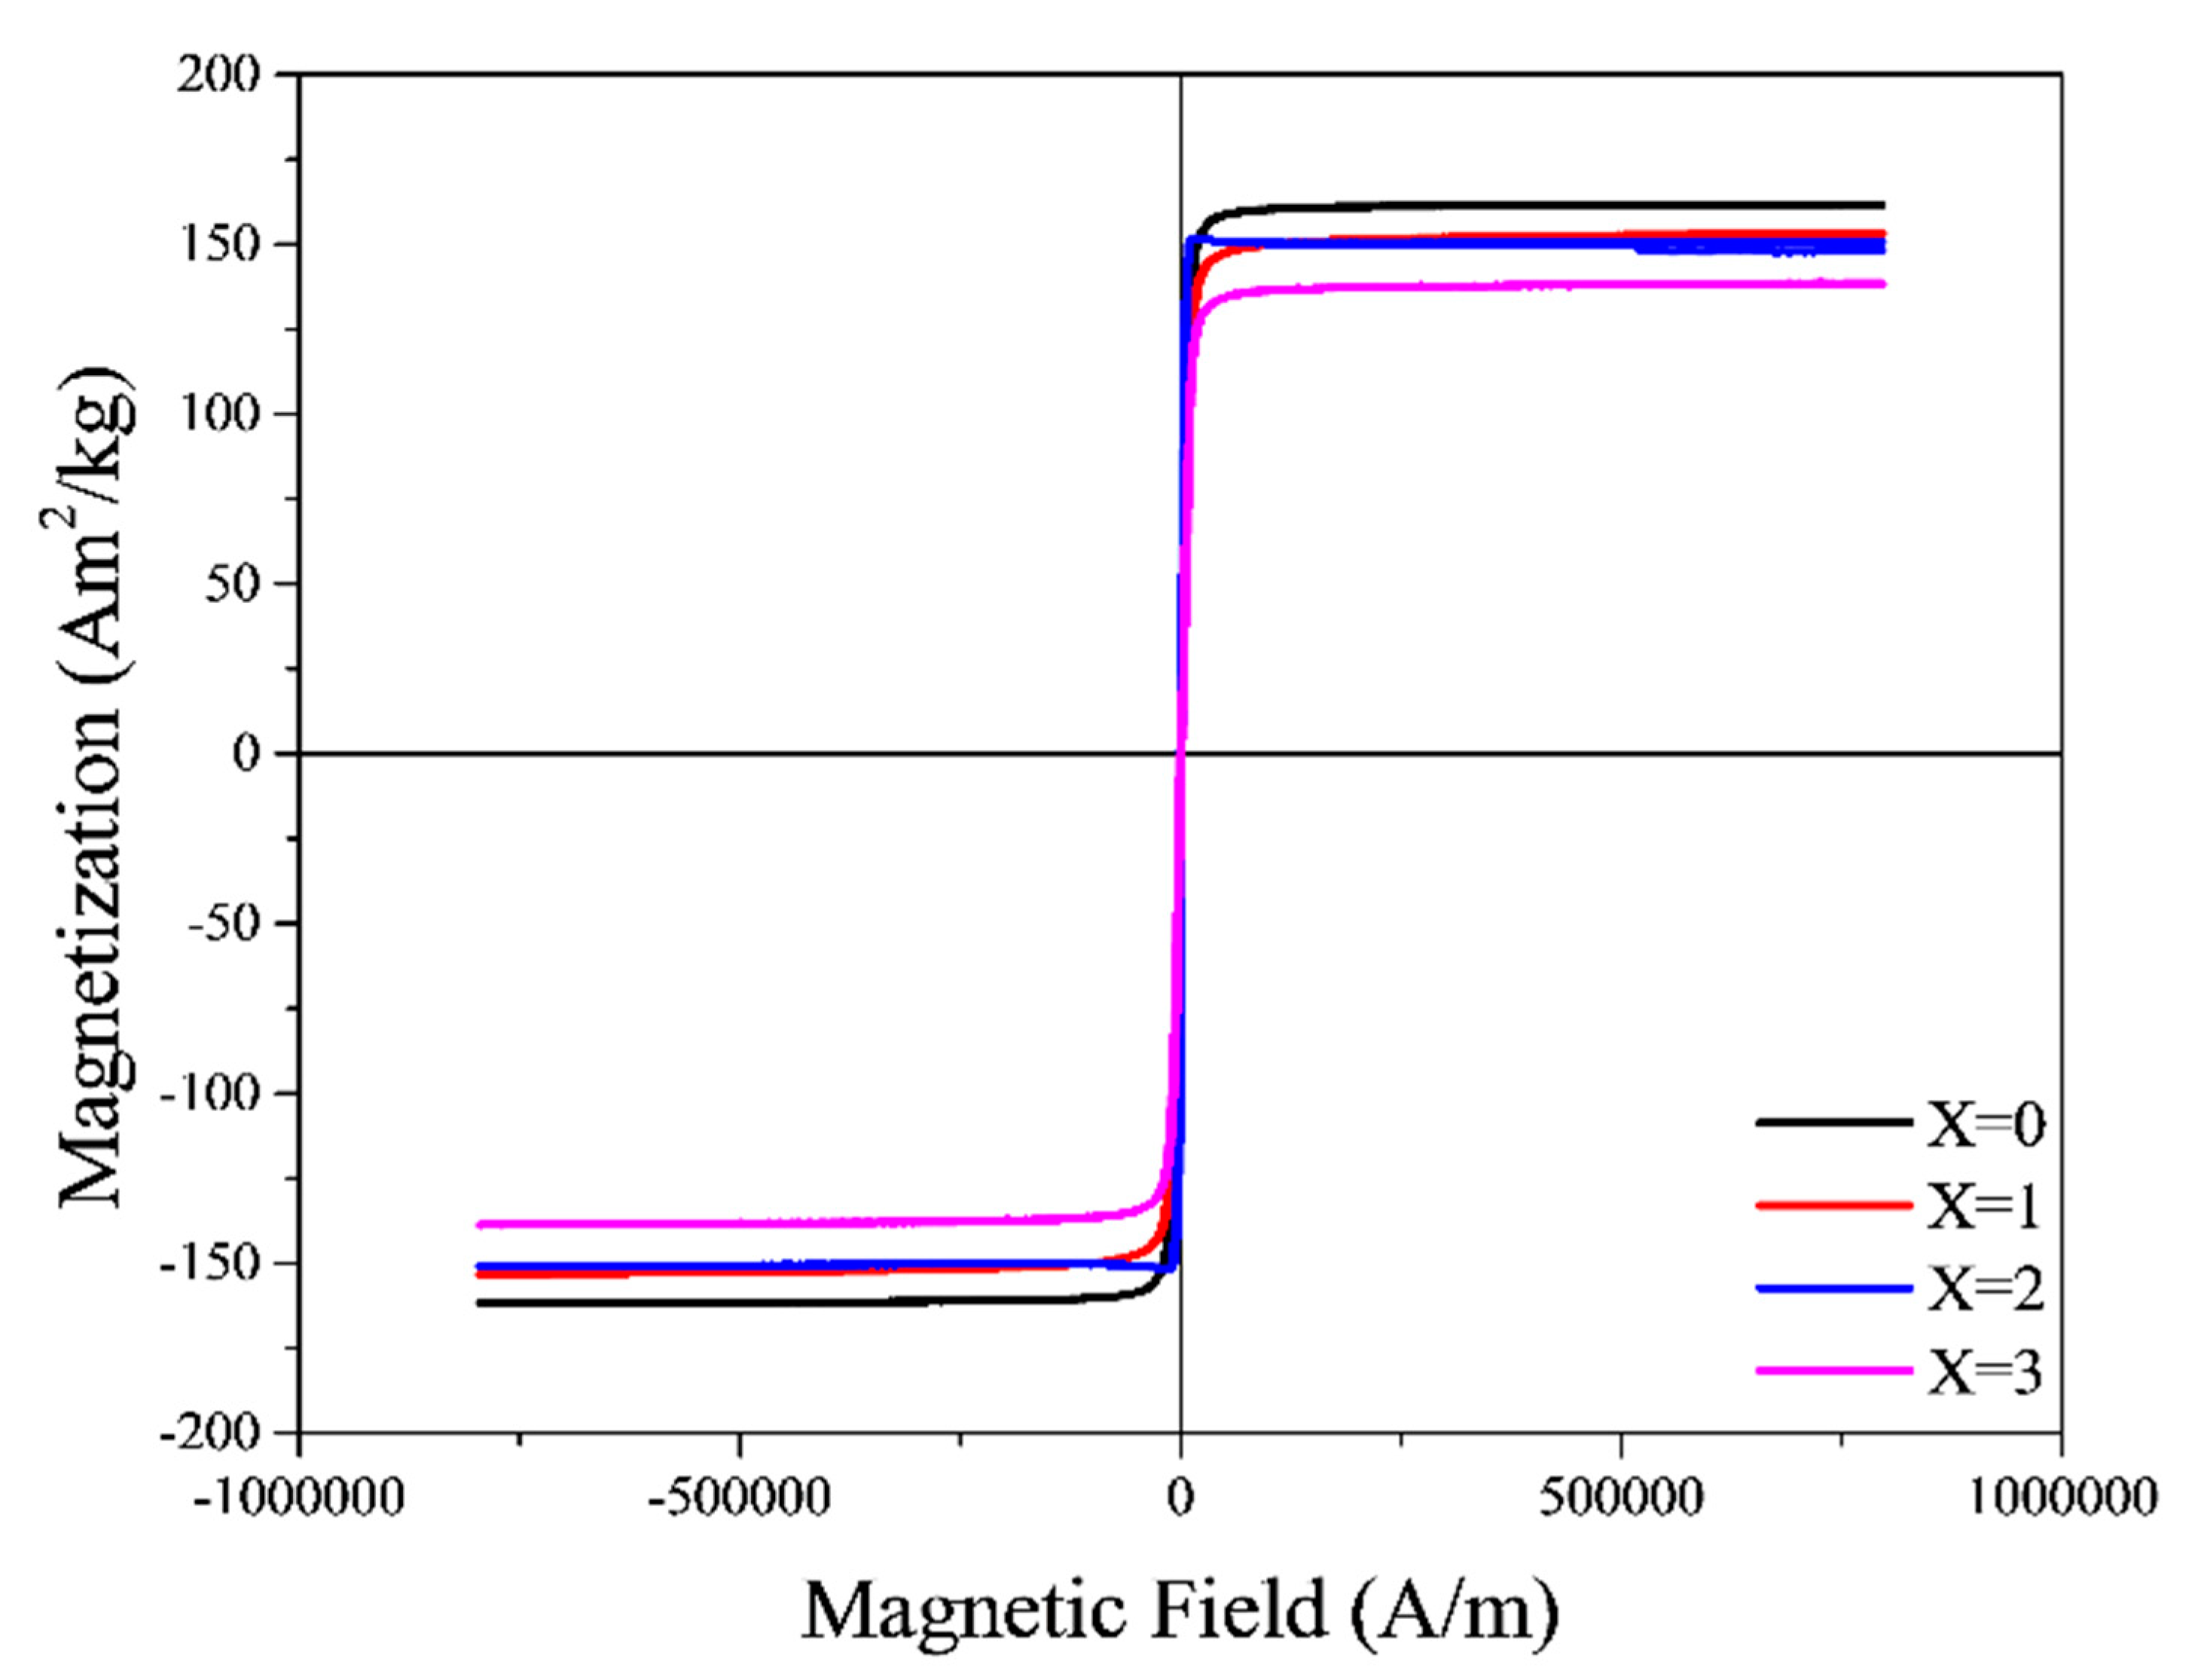
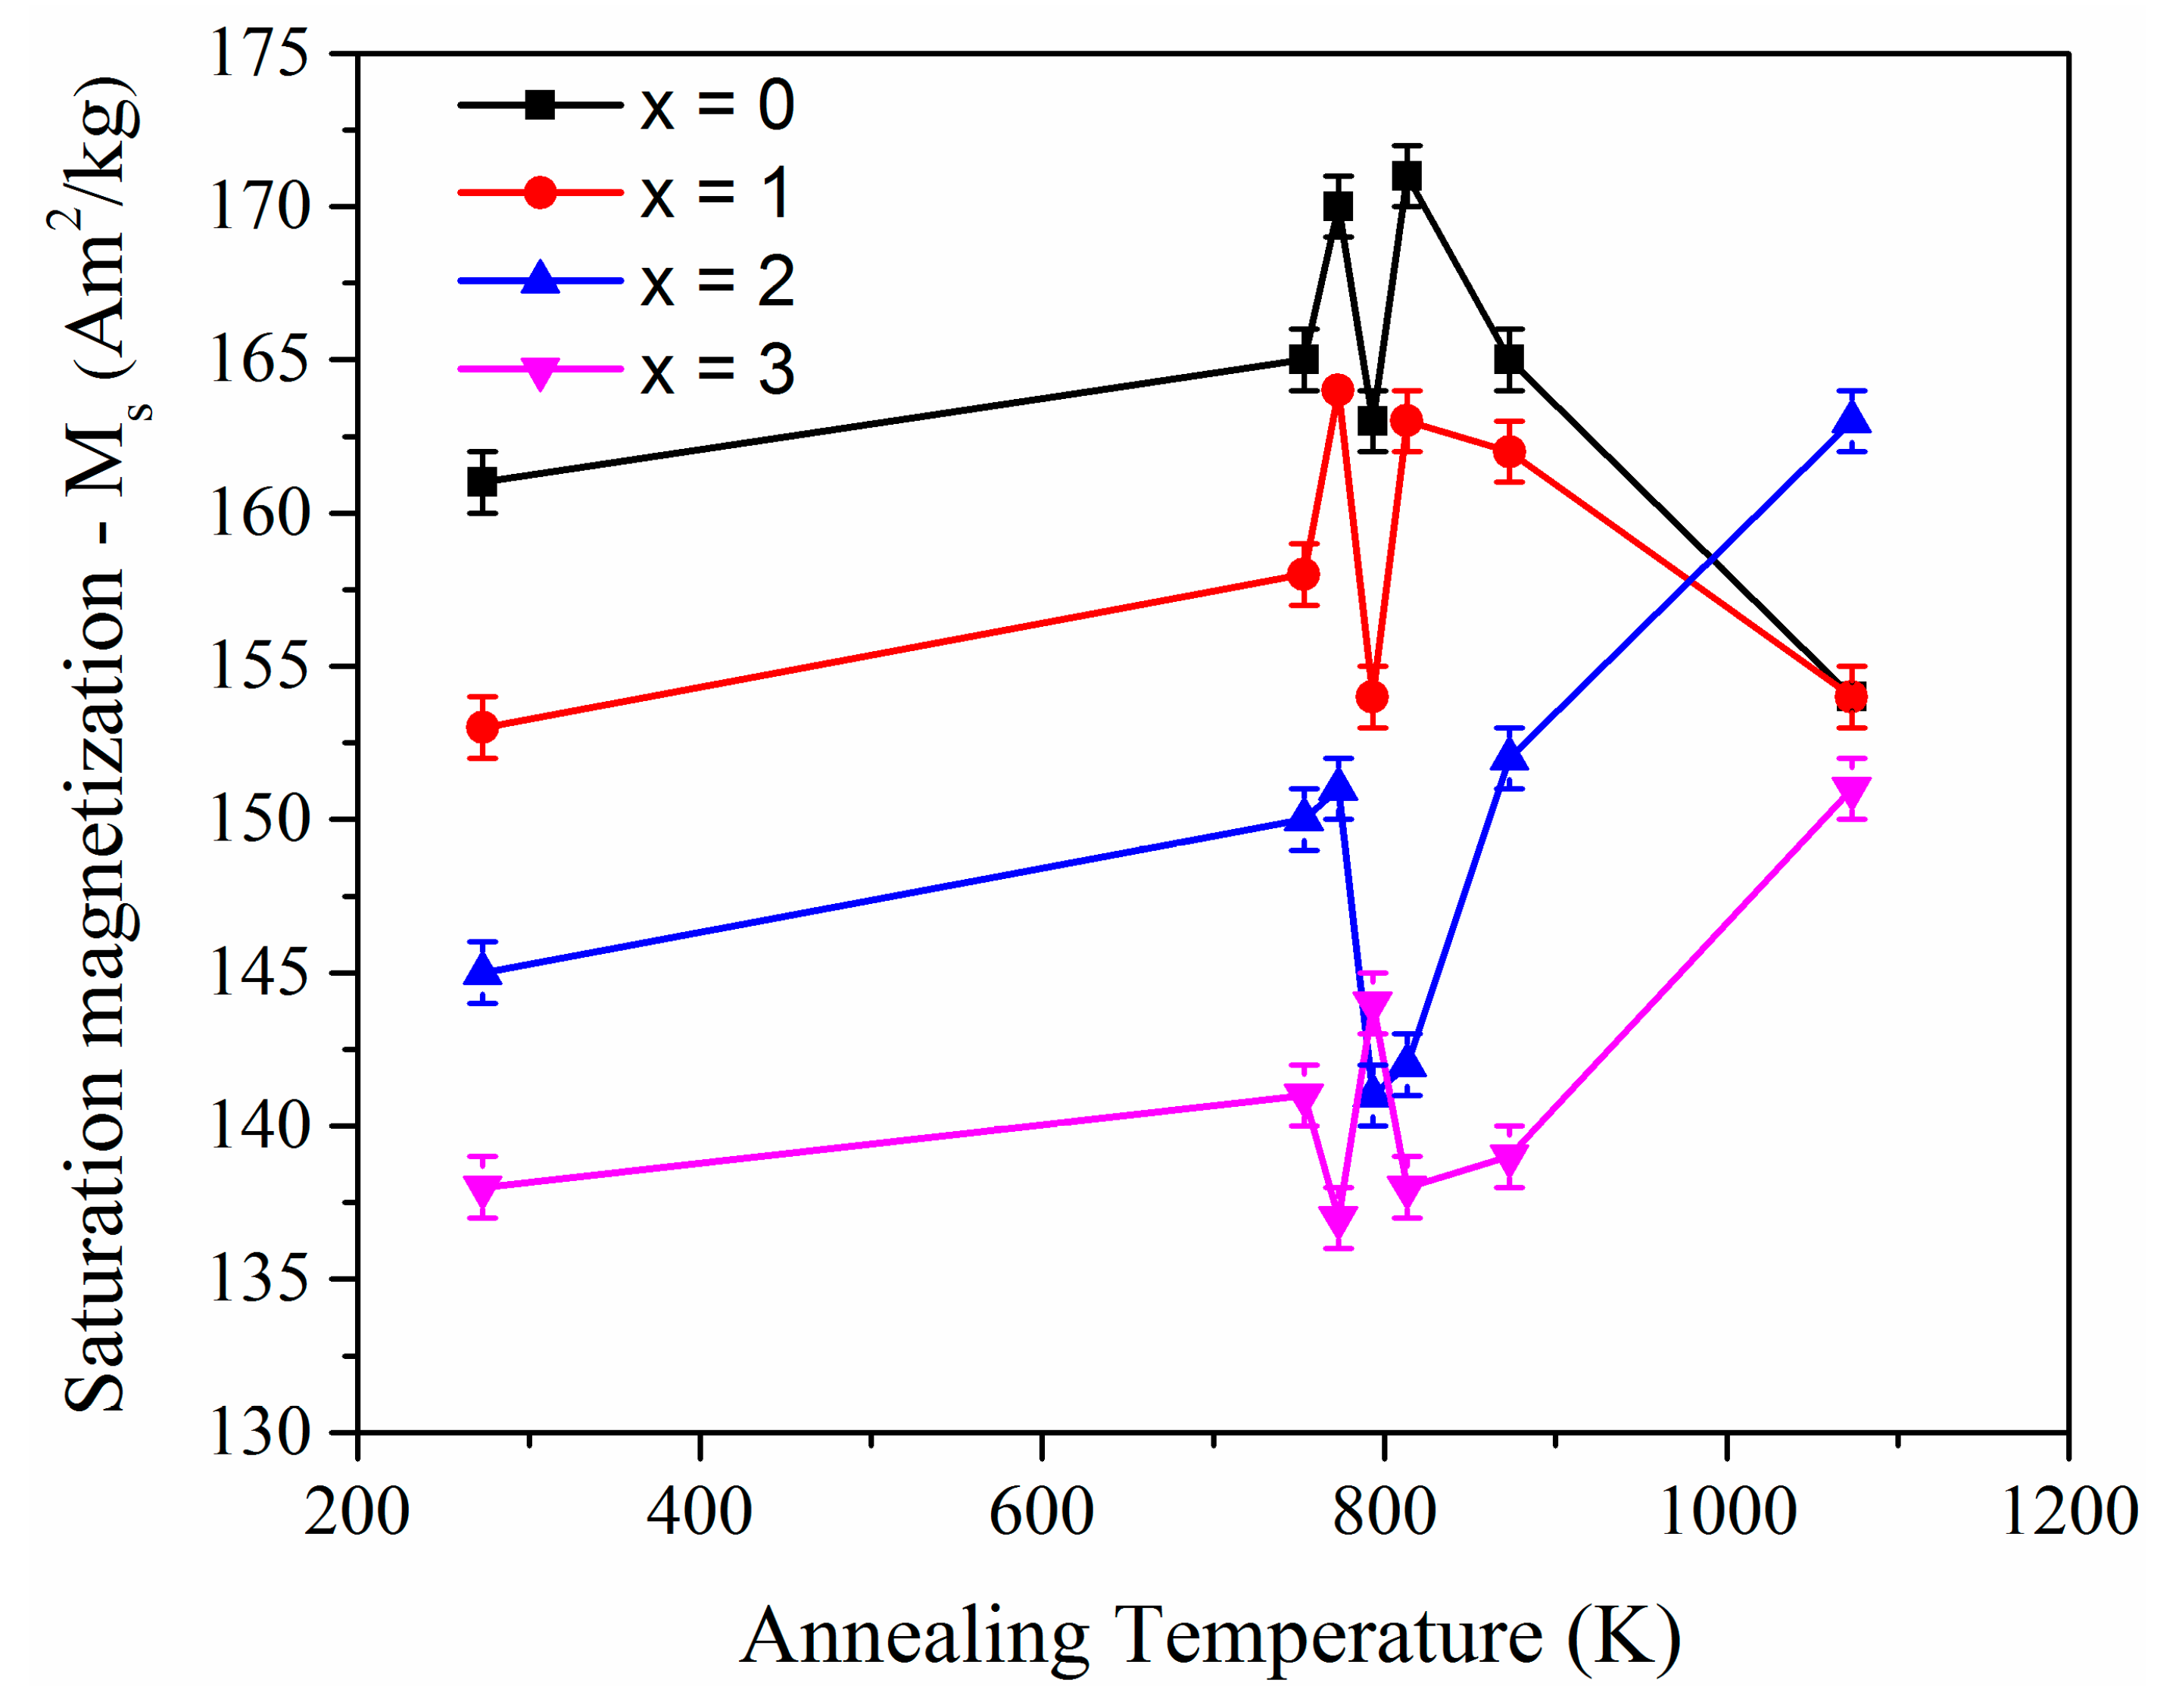
3.3. Magnetic Properties

Figure 7 shows the TGA curves obtained in the presence of a magnetic field for the Fe76Si9−xB10P5Mox (x = 0, 1, 2 and 3) glasses. The drop in the magnetic mass corresponds to the transition of the material from a ferromagnetic state to a paramagnetic state. The temperature at which the magnetic mass reaches its minimum value can be identified as the Curie temperature of the amorphous phase. This value decreases significantly with the increase of the Mo content from 677 K for the base alloy to 550 K for the alloy with 3 at.% Mo. This is mainly because of the addition of the non-magnetic element Mo; it is well-known that the soft magnetic properties of ferromagnetic glasses are strongly influenced by the addition of non-magnetic elements and impurities [23].
The influence of Mo on the magnetic properties of Fe76Si9B10P5 glass was further examined through investigation of the saturation magnetization (Ms) of the as-spun and annealed ribbon samples. In order to avoid systematic errors introduced by different sample dimensions and annealing times, all the sample sizes and annealing times were kept the same for all the experiments. Figure 8 reveals that the amorphous alloys have a soft magnetic behavior. It can also be seen that the addition of molybdenum to the base alloy is detrimental for the saturation magnetization, since it decreases from 161 Am2/kg for the base alloy to 138 Am2/kg for the alloy with 3 at.% Mo as the concentration of Mo increases.
Figure 9 shows the variation of the saturation magnetization Ms as a function of annealing temperature. The variation of Ms is in accordance with the crystallization sequence shown in the XRD patterns. At low annealing temperatures, up to 773 K, there is a gradual increase in saturation magnetization due to the relaxation of the structure. When the annealing temperature increases above 773 K, the samples with 0 and 1 at.% molybdenum show a considerable variation in Ms due to the formation and decomposition of metastable phases. Upon further annealing, i.e., above 813 K, more stable magnetically-hard phases like Fe3(B,P) and Fe2B form, resulting in the decrease of Ms. On the other hand, the alloys with 2 and 3 at.% Mo exhibit a different behavior; the initial decrease in Ms is due to the formation of hard magnetic phases between 773 and 813 K, and the increase of Ms between 813 and 1073 K is due to the crystallization of the ferromagnetic phase α-Fe(Si), which contributes considerably to the increase of Ms.
In the case of the sample with 3% Mo, the increase in Ms value around 800 K could be due to the formation of a metastable ferromagnetic phase, which upon further annealing decomposed into a different phase with low Ms.
It should be mentioned here that in order to clearly understand the sequence in precipitation of metastable and stable phases more detailed experiments are required.

4. Summary

The analysis of the structural evolution of the Fe76Si9B10P5 alloy with the addition of small amounts of Mo substituting Si shows that this alloy system presents a multistage crystallization process. The addition of Mo alters the crystallization sequence by reducing the crystallization start temperature, favoring the precipitation of the metastable phase Fe23B6 in the early stage of crystallization. This phase subsequently decomposes into α-Fe(Si), Fe2B, and Fe3(B,P). The magnetic properties such as the Curie temperature and the saturation magnetization are reduced with the increase in Mo concentration, although there is a small increase of Ms upon thermal treatment of the alloys at temperatures below Tx. Annealing above Tx temperature promotes the precipitation of hard magnetic phases, which leads to significant variation in Ms depending on the formation of the final stable phase.

Supplementary Materials

The following are available online at https://www.mdpi.com/2075-4701/10/7/881/s1, Figure S1: SEAD pattern of the Fe76Si9B10P5 sample annealed at 1073 K.

Author Contributions

D.P.: Experimental work, analysis of the results, writing of the manuscript. C.P.: TGA analysis, TEM samples preparation and analysis of results. P.R.: VSM measurement and analysis. M.S.: Result analysis and revision of the manuscript. J.E.: Result analysis and discussion. F.B.: Discussion, analysis of results and revision of the manuscript. F.E.: Discussion, analysis of results and revision of the manuscript. All authors have read and agreed to the published version of the manuscript.

Funding

This research was funded by [Departamento Administrativo de Ciencia, Tecnología e Innovación (CTeI)–COLCIENCIAS] grant no. 567, [EU Initial Training Network VitriMetTech] grant no. FP7-PEOPLE-2013-ITN-607080, [European Research Council under the ERC Advanced Grant INTELHYB] grant no. ERC-2013-ADG-340025, and [Ministry of Science and Higher Education of the Russian Federation in the framework of Increase Competitiveness Program of NUST «MISiS»] grant no. К2-2020-020). The APC was funded by ERC-2013-ADG-340025.

Acknowledgments

Part of this work was done during the stay of D.P. at the Institute for Complex Materials (ICM) of the Leibniz Institute for Solid State and Materials Research—IFW Dresden, Germany. Thanks are given to T. Gemming for placing the facilities and resources of ICM–IFW Dresden at our disposal. D.P. acknowledges the financial support provided by the Departamento Administrativo de Ciencia, Tecnología e Innovación (CTeI)–COLCIENCIAS through its call 567 for national doctorates. P.R. and M.S. acknowledge additional support through the EU Initial Training Network VitriMetTech, FP7-PEOPLE-2013-ITN-607080. P.R. and J.E. are also grateful for the support through the European Research Council under the ERC Advanced Grant INTELHYB (grant ERC-2013-ADG-340025). J.E. acknowledges the financial support of the Ministry of Science and Higher Education of the Russian Federation in the framework of Increase Competitiveness Program of NUST «MISiS» (№ К2-2020-020). Special thanks are given to B. Bartusch, S. Donath and M. Frey for technical assistance.

Conflicts of Interest

The authors declare no conflict of interest.

References

  1. Klement, W.; Willens, R.H.; Duwez, P. Non-crystalline Structure in Solidified Gold-Silicon Alloys. Nature 1960, 187, 869. [Google Scholar] [CrossRef]
  2. Li, H.X.; Lu, Z.C.; Wang, S.L.; Wu, Y.; Lu, Z.P. Fe-based bulk metallic glasses: Glass formation, fabrication, properties and applications. Prog. Mater. Sci. 2019, 103, 235–318. [Google Scholar] [CrossRef]
  3. Inoue, A. Bulk Glassy Alloys: Historical Development and Current Research. Engineering 2015, 1, 185–191. [Google Scholar] [CrossRef] [Green Version]
  4. Ramasamy, P.; Stoica, M.; Bera, S.; Calin, M.; Eckert, J. Effect of replacing Nb with (Mo and Zr) on glass forming ability, magnetic and mechanical properties of FeCoBSiNb bulk metallic glass. J. Alloys Compd. 2017, 707, 78–81. [Google Scholar] [CrossRef]
  5. Inoue, A.; Shen, B.L. A New Fe-based Bulk Glassy Alloy with Outstanding Mechanical Properties. Adv. Mater. 2004, 16, 2189–2192. [Google Scholar] [CrossRef]
  6. Gu, X.; McDermott, A.; Poon, S.J.; Shiflet, G.J. Critical Poisson’s ratio for plasticity in Fe–Mo–C–B–Ln bulk amorphous steel. Appl. Phys. Lett. 2006, 88, 211905. [Google Scholar] [CrossRef]
  7. Jung, H.; Yi, S. Enhanced glass forming ability and soft magnetic properties through an optimum Nb addition to a Fe–C–Si–B–P bulk metallic glass. Intermetallics 2010, 18, 1936–1940. [Google Scholar] [CrossRef]
  8. Suryanarayana, C.; Inoue, A. Iron-based bulk metallic glasses. Int. Mater. Rev. 2013, 58, 131–166. [Google Scholar] [CrossRef]
  9. Makino, A.; Kubota, T.; Chang, C.; Makabe, M.; Inoue, A. FeSiBP bulk metallic glasses with unusual combination of high magnetization and high glass-forming ability. Mater. Trans. 2007, 0710160234. [Google Scholar] [CrossRef] [Green Version]
  10. Makino, A.; Kubota, T.; Makabe, M.; Chang, C.; Inoue, A. FeSiBP metallic glasses with high glass-forming ability and excellent magnetic properties. Mater. Sci. Eng. B 2008, 148, 166–170. [Google Scholar] [CrossRef]
  11. Takeuchi, A.; Inoue, A. Classification of bulk metallic glasses by atomic size difference, heat of mixing and period of constituent elements and its application to characterization of the main alloying element. Mater. Trans. 2005, 46, 2817–2829. [Google Scholar] [CrossRef] [Green Version]
  12. Yang, X.; Ma, X.; Li, Q.; Guo, S. The effect of Mo on the glass forming ability, mechanical and magnetic properties of FePC ternary bulk metallic glasses. J. Alloys Compd. 2013, 554, 446–449. [Google Scholar] [CrossRef]
  13. Jia, X.; Li, Y.; Xie, G.; Qi, T.; Zhang, W. Role of Mo addition on structure and magnetic properties of the Fe85Si2B8P4Cu1 nanocrystalline alloy. J. Non-Crys. Solids 2018, 481, 590–593. [Google Scholar] [CrossRef]
  14. Liu, F.; Pang, S.; Li, R.; Zhang, T. Ductile Fe–Mo–P–C–B–Si bulk metallic glasses with high saturation magnetization. J. Alloys Compd. 2009, 483, 613–615. [Google Scholar] [CrossRef]
  15. Li, X.; Qin, C.; Kato, H.; Makino, A.; Inoue, A. Mo microalloying effect on the glass-forming ability, magnetic, mechanical and corrosion properties of (Fe0.76Si0.096B0.084P0.06) 100-xMox bulk glassy alloys. J. Alloys Compd. 2011, 509, 7688–7691. [Google Scholar] [CrossRef]
  16. Makino, A.; Li, X.; Yubuta, K.; Chang, C.; Kubota, T.; Inoue, A. The effect of Cu on the plasticity of Fe–Si–B–P-based bulk metallic glass. Scripta Mater. 2009, 60, 277–280. [Google Scholar] [CrossRef]
  17. Li, X.; Kato, H.; Yubuta, K.; Makino, A.; Inoue, A. Effect of Cu on nanocrystallization and plastic properties of FeSiBPCu bulk metallic glasses. Mater. Sci. Eng. A 2010, 527, 2598–2602. [Google Scholar] [CrossRef]
  18. Li, X.; Makino, A.; Yubuta, K.; Kato, H.; Inoue, A. Mechanical Properties of Soft Magnetic (Fe0.76Si0.096B0.084P0.06)B100-xCux (x = 0 and 0.1) Bulk Glassy Alloys. Mater. Trans. 2009, 50, 1286–1289. [Google Scholar] [CrossRef] [Green Version]
  19. Zhu, L.; Xia, G.T.; Cao, C.C.; Meng, Y.; Dai, Y.D.; Chen, J.K.; Wang, Y.G. Effect of Mo on nanocrystallization and magnetic properties of Fe83xB10C6Cu1Mox (x = 0–1.25) soft magnetic alloys. J. Mater. Sci. Mater. Electron. 2018, 29, 1856–1860. [Google Scholar] [CrossRef]
  20. Brown, M.E. Introduction to Thermal Analysis: Techniques and Applications; Springer Science & Business Media: Berlin, Germany, 2001; Volume 1. [Google Scholar]
  21. Zhang, J.; Shen, B.; Zhang, Z. Crystallization behaviors of FeSiBPMo bulk metallic glasses. J. Non-Crys. Solids 2013, 360, 31–35. [Google Scholar] [CrossRef]
  22. Ponnambalam, V.; Poon, S.J.; Shiflet, G.J. Fe-based bulk metallic glasses with diameter thickness larger than one centimeter. J. Mater. Res. 2004, 19, 1320–1323. [Google Scholar] [CrossRef]
  23. Parthiban, R. Soft Ferromagnetic Bulk Metallic Glasses with Enhanced Mechanical Properties. Ph.D. Thesis, Technical University Dresden, Dresden, Germany, 2017. [Google Scholar]
Figure 1. XRD patterns of the as-spun Fe76Si9−xB10P5Mox (x = 0, 1, 2 and 3) ribbons.
Metals 10 00881 g001
Figure 2. DSC curves of the as-spun Fe76Si9−xB10P5Mox (x = 0, 1, 2 and 3) ribbons with a heating rate of 20 K/min.
Metals 10 00881 g002
Figure 3. MDSC curves of the as-spun Fe76Si9−xB10P5Mox (x = 0, 1, 2 and 3) ribbons with a heating rate of 5 K/min.
Metals 10 00881 g003
Figure 4. XRD patterns of the Fe76Si9−xB10P5Mox (x = 0, 1, 2 and 3) glasses showing the structural evolution after annealing at different temperatures. (a): x = 0; (b): x = 1; (c): x = 2; (d): x = 3.
Metals 10 00881 g004
Figure 5. TEM micrographs of Fe76Si9B10P5 (a) in the as-spun state, (b) annealed at 813 K, and (c) 1073 K. The samples were annealed at different temperatures using the NETZSCH DSC 404C for 60 s. (Figure 5c insert is given in Supplementary file for better clarity)
Metals 10 00881 g005
Figure 6. TEM micrographs of Fe76Si7B10P5Mo2 (a) in the as-spun state, (b) annealed to 813 K, (c) annealed at 873 K, and (d) annealed at 1073 K. The samples were annealed at different temperatures using the NETZSCH DSC 404C for 60 s.
Metals 10 00881 g006
Figure 7. TGA curves of the as-spun Fe76Si9−xB10P5Mox (x = 0, 1, 2 and 3) ribbons with a heating rate of 10 K/min.
Metals 10 00881 g007
Figure 8. Hysteresis loops for Fe76Si9−xB10P5Mox (x = 0, 1, 2 and 3) as-spun glassy ribbons.
Metals 10 00881 g008
Figure 9. Variation of saturation magnetization (Ms) as a function of temperature for Fe76Si9−xB10P5Mox (x = 0, 1, 2 and 3) glasses.
Metals 10 00881 g009
Table 1. Summary of thermal properties of the as-prepared Fe76Si9−xB10P5Mox (x = 0, 1, 2 and 3) glassy alloys determined from the DSC curves at a heating rate of 20 K/min. Tc, Tx, Tp1, and Tm are the Curie temperature, the glass transition temperature, the onset temperature of crystallization, the first crystallization peak, the liquidus temperature and the melting point, respectively. (ΔTx = TxTg).
AlloyTC (K)Tg * (K)Tx0 (K)Tx1 (K)Tp1 (K)Tm (K)ΔTx (K)
Fe76Si9B10P5677786-816824127930
Fe76Si8B10P5Mo1636786808-830126322
Fe76Si7B10P5Mo2595786798-831127312
Fe76Si6B10P5Mo3550786791-83312875
* Data obtained from the MDSC at a heating rate of 5 K/min.

