Analyzing E-Bikers’ Risky Riding Behaviors, Safety Attitudes, Risk Perception, and Riding Confidence with the Structural Equation Model


Abstract
:1. Introduction
- (1)
- What are the significant relationships among risky riding behavior, riding confidence, safety attitude, and risk perception, and their secondary exogenous variables?
- (2)
- How can strategies be implemented for intervening and preventing the risky riding behavior and understand the psychological mechanism of e-bike riders based on the SEM results?
2. Literature Review
3. Materials and Methods
3.1. Respondents and Procedure
3.2. Measurements
3.2.1. Riding Confidence
3.2.2. Risk Perception
3.2.3. Safety Attitude
3.2.4. Risky Riding Behavior
3.2.5. Crash Involvement and Demographics
4. Results
4.1. Respondent Characteristics
4.2. Exploratory Factor Analysis
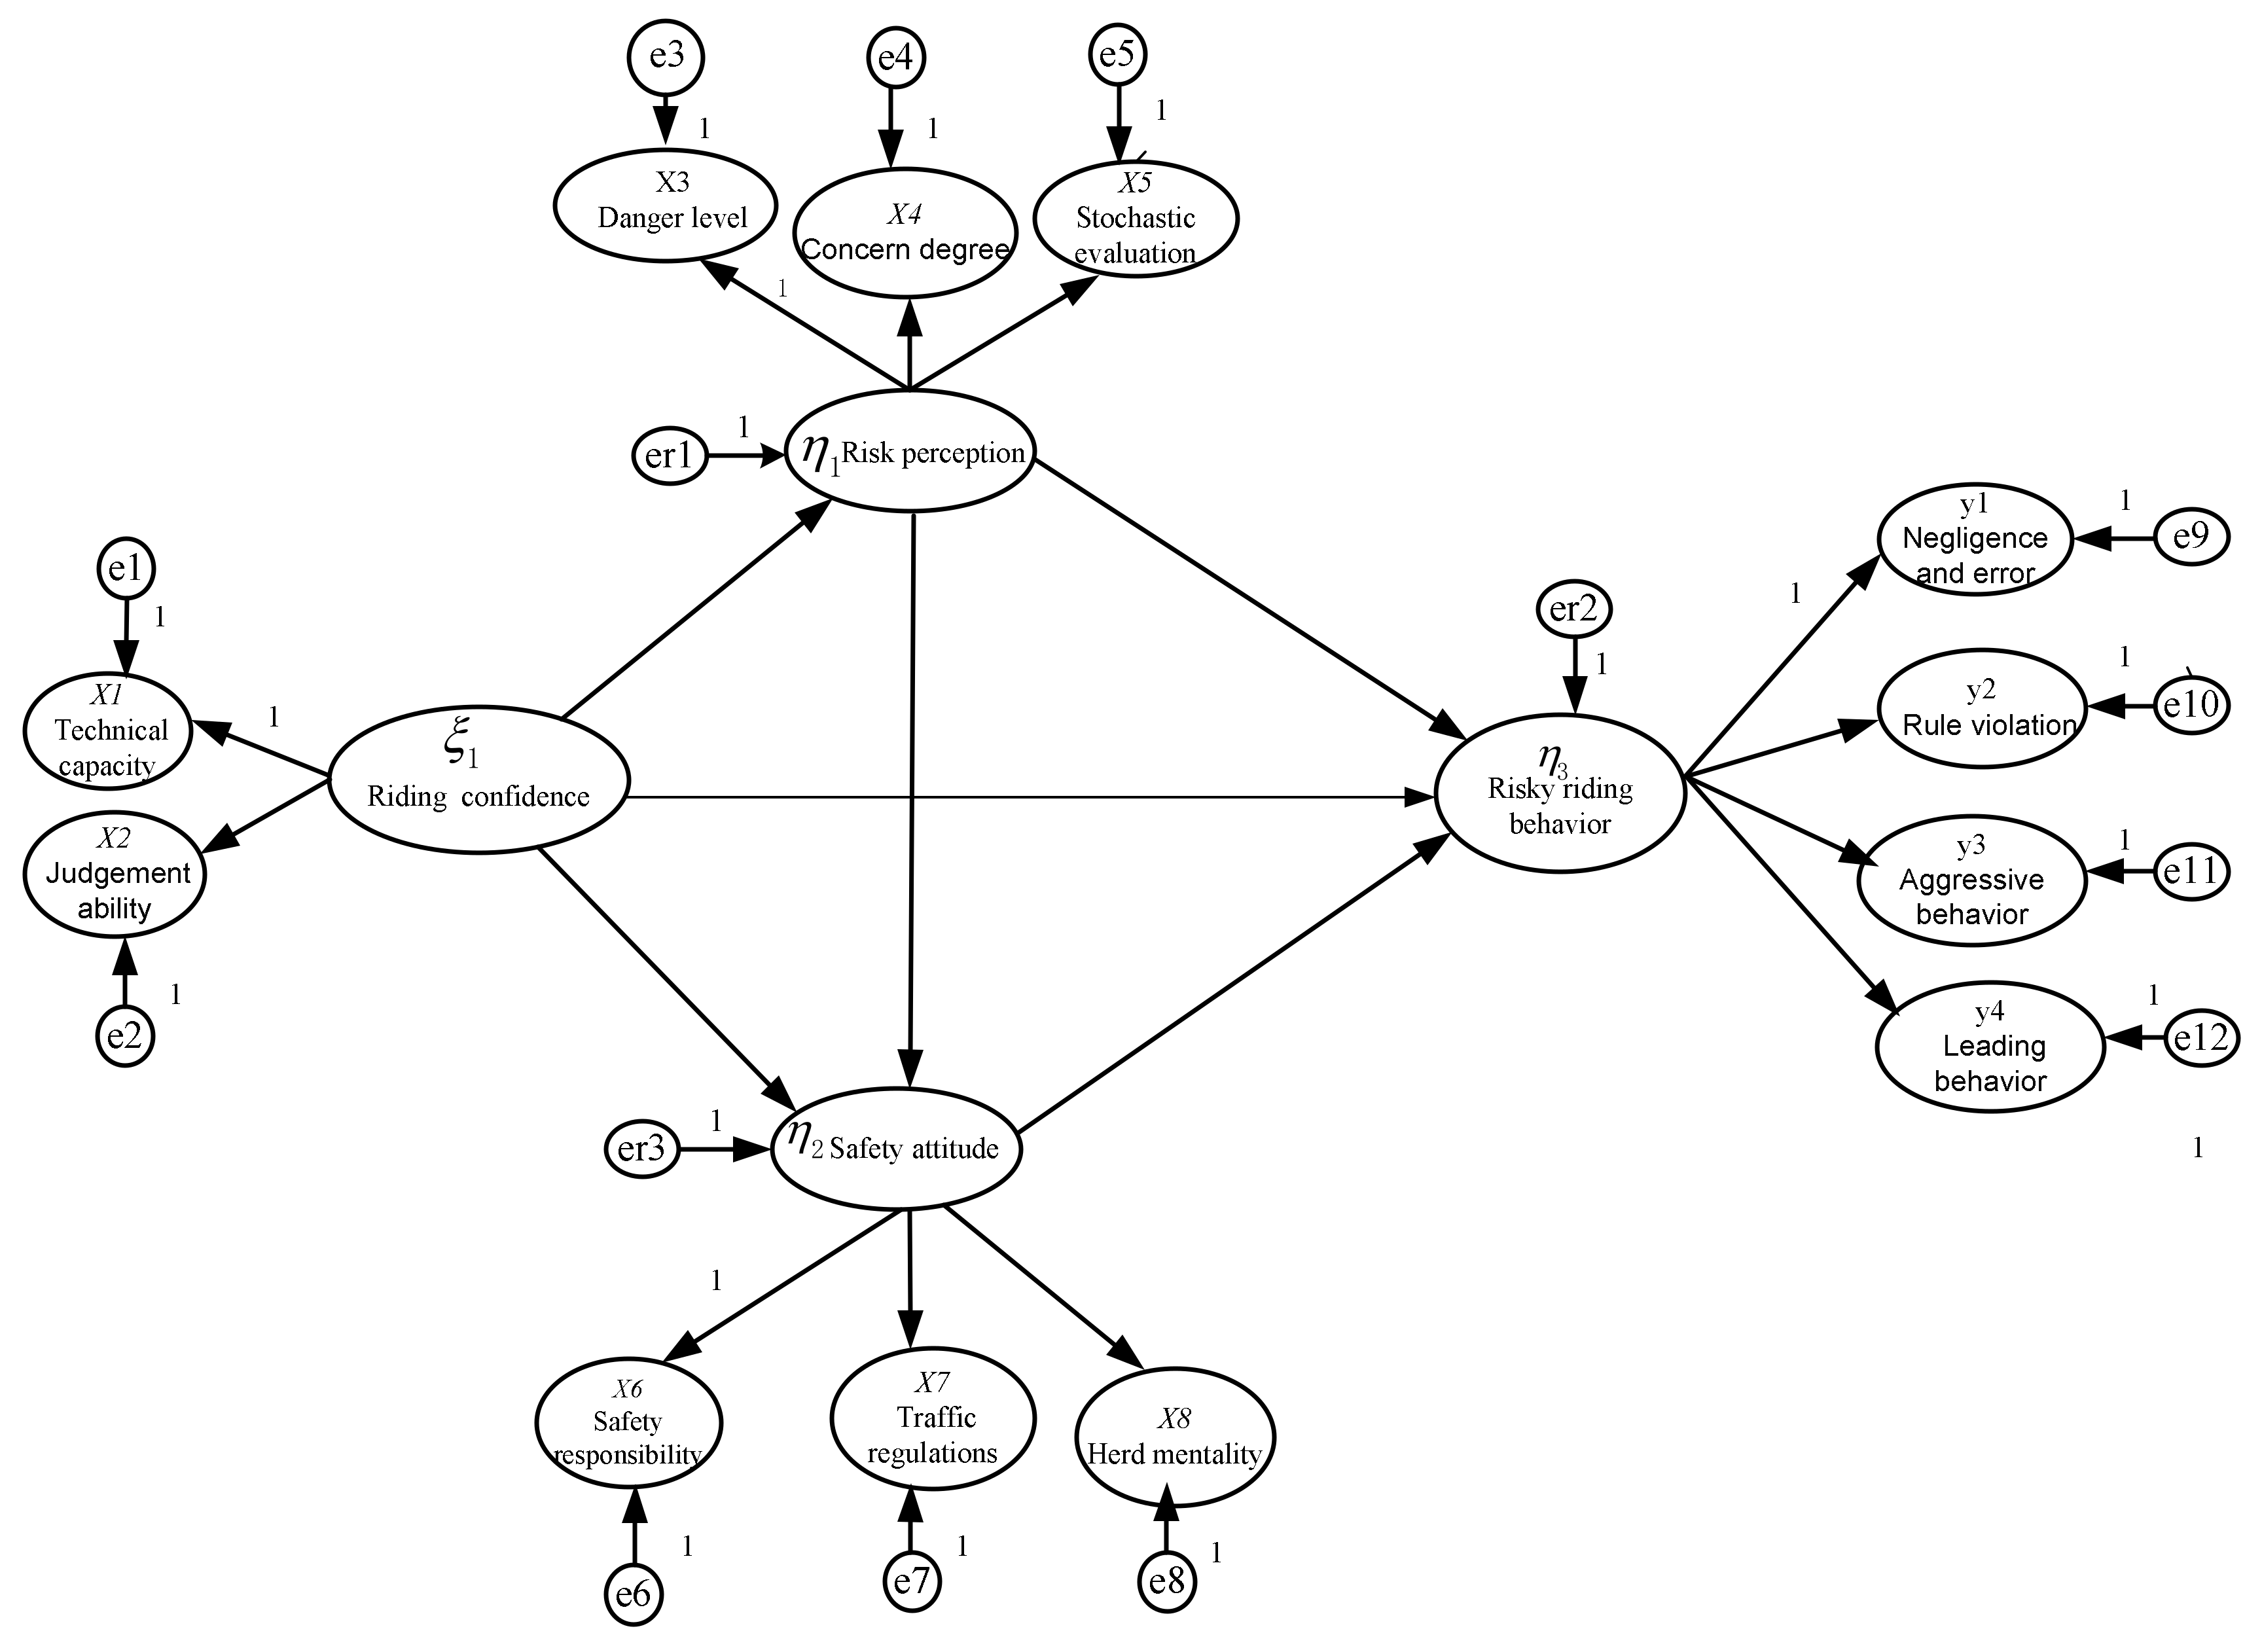
4.3. Structural Equation Model Testing
4.3.1. Theoretical Model Hypothesis
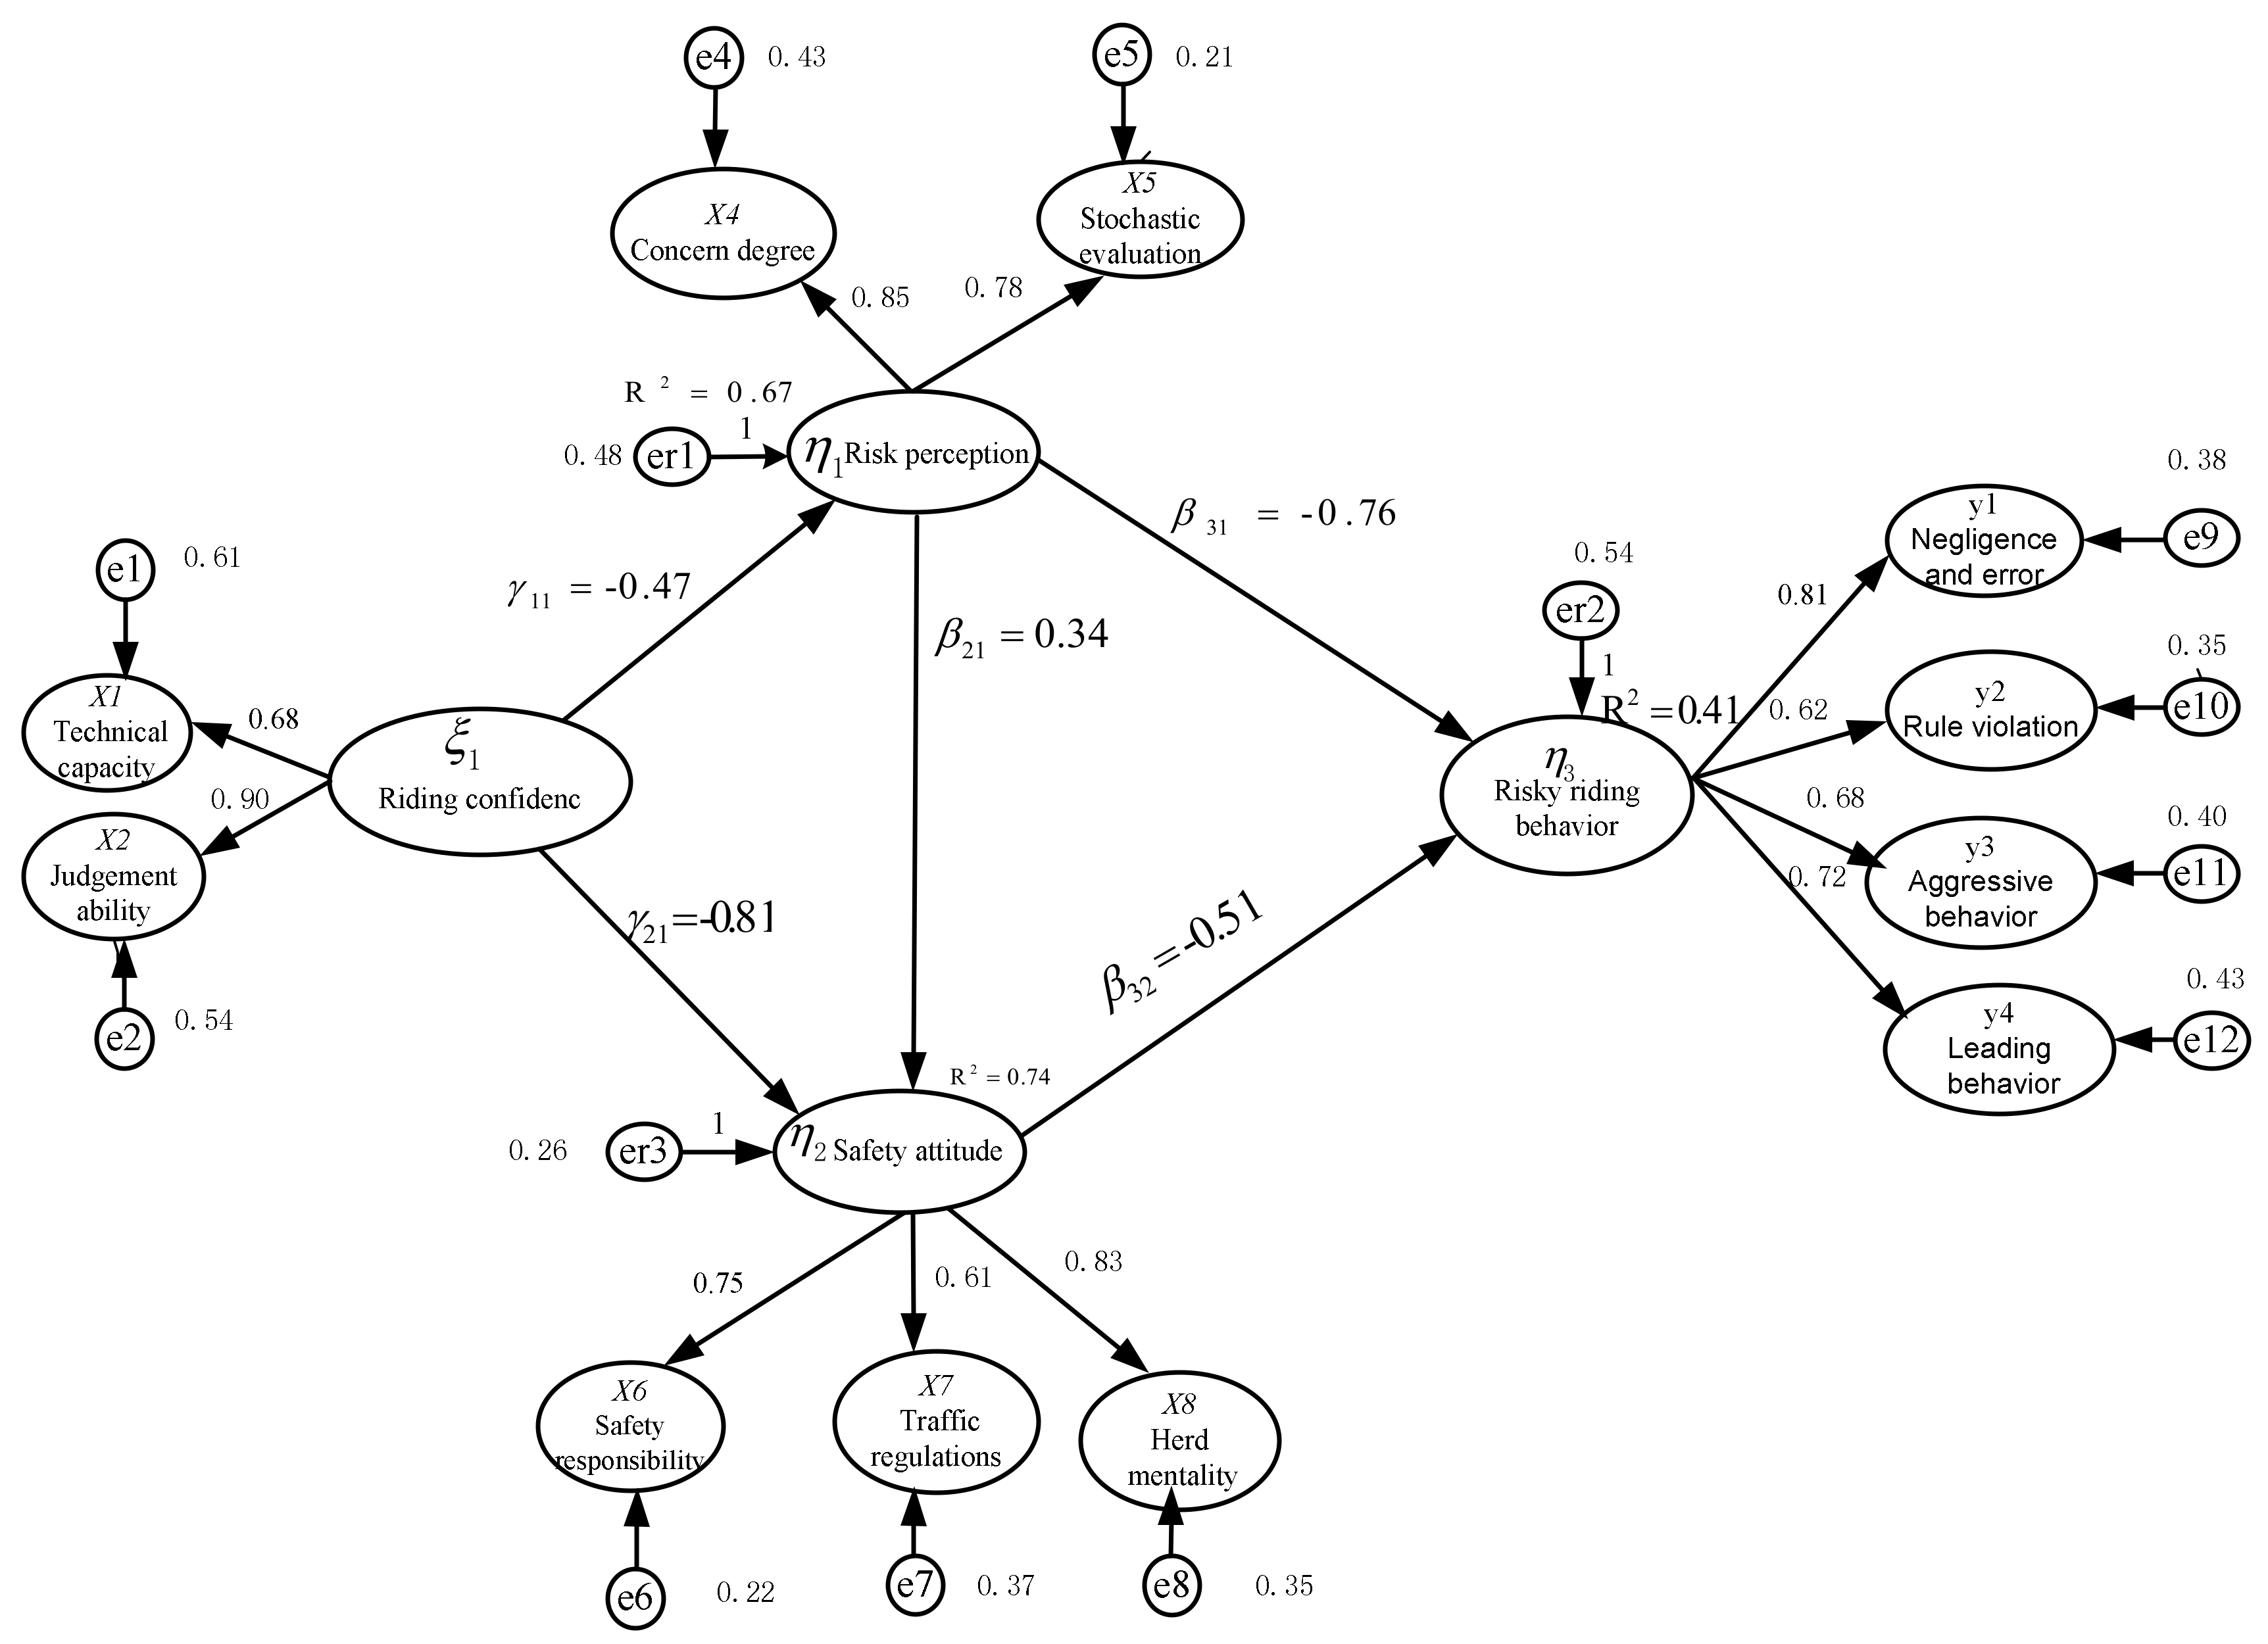
4.3.2. Goodness of Fit and Estimated Results
5. Discussions
5.1. Analysis of Direct, Indirect, and Total Effects
5.2. Prevention and Intervention of Risky Riding Behavior
6. Conclusions
Author Contributions
Funding
Acknowledgments
Conflicts of Interest
Appendix A

| Dimension | Measurement Item | Factor Loading | Cronbach’s α |
|---|---|---|---|
| Riding confidence | Sub-scale 1: Technical capacity | 0.827 | |
| 1. Ability to deal with unexpected situations on unfamiliar roads | 0.873 | ||
| 2. Riding skills will help me get out of trouble when in danger | 0.902 | ||
| 3. It is okay to ride after a few alcoholic drinks | 0.929 | ||
| 4. I am a good rider so I can ride exceeding the speed limits | 0.920 | ||
| Sub-scale 2: Judgement ability | 0.853 | ||
| 5. I am familiar with the roads around me and everything is under my control | 0.864 | ||
| 6. I can often judge whether my riding behavior is dangerous or not based on experience | 0.896 | ||
| 7. I can accurately judge the movement of nearby vehicles | 0.784 | ||
| 8. I can judge the speed of a motor vehicle accurately | 0.799 | ||
| Risk perception | Sub-scale 1: Danger level | 0.911 | |
| 1. If the non-motorized lane is crowded, I will ride in a motorized lane | 0.809 | ||
| 2. I can ride faster than others surrounding me | 0.846 | ||
| 3. Views on drunk driving | 0.879 | ||
| 4. Turning into the opposite lane to overtake slow vehicles | 0.900 | ||
| 5. Views on running a red light when riding | 0.837 | ||
| Sub-scale 2: Concern degree | 0.814 | ||
| 6. I am often concerned about accidents when riding | 0.803 | ||
| 7. When riding an e-bike, I consider myself a cautious person | 0.748 | ||
| 8. It is unsafe to ride an e-bike | 0.767 | ||
| Sub-scale 3: Stochastic evaluation | 0.831 | ||
| 9. The possibility of traffic accidents on e-bikes | 0.812 | ||
| 10. The possibility of being seriously injured in a crash when riding an e-bike | 0.787 | ||
| 11. Traffic accidents are more likely to happen to us than to others | 0.652 | ||
| Safety attitude | Sub-scale 1: Safety responsibility | 0.932 | |
| 1. I am responsible for others’ safety | 0.842 | ||
| 2. I try my best to prevent all accidents | 0.904 | ||
| 3. I feel very guilty if a traffic accident is caused due to my error | 0.918 | ||
| 4. I think every traffic participant should be responsible for his ownBehavior | 0.918 | ||
| 5.Family members’ lives are severely affected by traffic accidents | 0.844 | ||
| Sub-scale 2: Traffic regulations | 0.960 | ||
| 6. It makes no sense for me to obey the rules when most people do not | 0.820 | ||
| 7. Obeying the traffic rules will make me safer | 0.866 | ||
| 8. Traffic violations should be allowed as long as safety is ensured | 0.702 | ||
| 9. Sometimes it is necessary to violate traffic regulations for protecting our interests | 0.799 | ||
| 10. I feel guilty when violating traffic regulations | 0.680 | ||
| Sub-scale 3: Herd mentality | 0.844 | ||
| 11. I can get away with breaking traffic rules by following others | 0.751 | ||
| 12. If I follow others when violating traffic regulations, I will not be accused | 0.577 | ||
| 13. I think it is safer to ride with others | 0.836 | ||
| 14. When I do not know if it is okay to cross, following others’ behaviors is more accurate | 0.834 | ||
| Risky riding behavior | Sub-scale 1: Negligence and errors | 0.776 | |
| 1. Not observing the surrounding when changing lanes or turning corners | 0.801 | ||
| 2. Using a mobile phone when riding | 0.780 | ||
| 3. Near collision with pedestrians or objects due to lack of | 0.626 | ||
| Concentration | |||
| 4. Slow down and detour around the rear of the vehicle to avoid it | 0.612 | ||
| 5. The vehicle suddenly rushes out when accelerating at first | 0.523 | ||
| 6. Forgetting to turn on headlights when riding at night | 0.689 | ||
| Sub-scale 2: Rule violation | 0.866 | ||
| 7. Red-light running | 0.756 | ||
| 8. Riding in a motorized lane | 0.752 | ||
| 9. Waiting for the signal beyond the stopping line | 0.862 | ||
| 10. Speed up when encountering a yellow light at the intersection | 0.784 | ||
| 11. Riding in the opposite direction | 0.806 | ||
| Sub-scale 3: Aggressive behavior | 0.791 | ||
| 12. Following extremely close to warn the leading rider to get out of the way | 0.684 | ||
| 13. Cutting through a lane when the current vehicle wants to turn right | 0.605 | ||
| 14. Chasing other vehicles after being provoked by them | 0.661 | ||
| 15. Trying to keep up with or overtake faster vehicles | 0.648 | ||
| 16. Not slowing down when approaching intersections | 0.595 | ||
| Sub-scale 4: Leading behavior | 0.766 | ||
| 17. Once I am behind, I want to overtake | 0.833 | ||
| 18. Not moving to the right when vehicles are approaching quickly | 0.712 | ||
| 19. Not keeping enough distance when following other vehicles | 0.698 | ||
| 20. Much faster than the surrounding vehicles | 0.627 |
References
- Ma, C.; Yang, D.; Zhou, J.; Feng, Z.; Yuan, Q. Risk riding behaviors of urban e-bikes: A literature review. Int. J. Environ. Res. Public Health 2019, 16, 2308. [Google Scholar] [CrossRef] [PubMed] [Green Version]
- SoHo. The Number of E-Bikes in China Has Exceeded 250 Million. Available online: http://www.sohu.com/a/275816334_114771. (accessed on 9 March 2019).
- Administration Bureau of China State Security Ministry. China Road Traffic Accidents Statistics Report; Administration Bureau of China State Security Ministry: Beijing, China, 2016.
- Wang, Z.; Neitzel, R.L.; Xue, X.; Zheng, W.; Jiang, G. Awareness, riding behaviors, and legislative attitudes toward electric bikes among two types of road users: An investigation in Tianjin, a municipality in China. Traffic Inj. Prev. 2019, 20, 72–78. [Google Scholar] [CrossRef] [PubMed]
- Fishman, E.; Cherry, C. E-bikes in the Mainstream: Reviewing a Decade of Research. Transp. Rev. 2016, 36, 72–91. [Google Scholar] [CrossRef]
- Tomarken, A.J.; Waller, N.G. Structural Equation Modelling: Strengths, Limitations, and Misconceptions. Annu. Rev. Clin. Psychol. 2005, 1, 31–65. [Google Scholar] [CrossRef] [Green Version]
- Chiou, Y.C.; Chen, Y.H. Service quality effects on air passenger intentions: A service chain perspective. Transportmetrica 2012, 8, 406–426. [Google Scholar] [CrossRef]
- Ulleberg, P.; Rundmo, T. Personality, attitudes and risk perception as predictors of risky driving behaviour among young drivers. Saf. Sci. 2003, 41, 427–443. [Google Scholar] [CrossRef]
- Jing, S.; Yao, X.; Li, T.; Paul, A. Factors causing aberrant driving behaviors: A model of problem drivers in China. J. Transp. Saf. Secur. 2018, 10, 288–302. [Google Scholar] [CrossRef]
- Zhao, X.; Xu, W.; Ma, J.; Li, H.; Chen, Y. An analysis of the relationship between driver characteristics and driving safety using structural equation models. Transp. Res. Part F Traffic Psychol. Behav. 2019, 62, 529–545. [Google Scholar] [CrossRef]
- Zhang, Q.; Ge, Y.; Qu, W.; Zhang, K.; Sun, X. The traffic climate in China: The mediating effect of traffic safety climate between personality and dangerous driving behavior. Accid. Anal. Prev. 2018, 113, 213–223. [Google Scholar] [CrossRef]
- Uzumcuoglu, Y.; Ozkan, T. Traffic climate and driver behaviors: Explicit and implicit measures. Transp. Res. Part F Traffic Psychol. Behav. 2019, 62, 805–818. [Google Scholar] [CrossRef]
- Broughton, P.; Fuller, R.; Stradling, S.; Gormley, M.; Kinnear, N.; O’dolan, C.; Hannigan, B. Conditions for speeding behaviour: A comparison of car drivers and powered two wheeled riders. Transp. Res. Part F Traffic Psychol. Behav. 2009, 12, 417–427. [Google Scholar] [CrossRef]
- Chen, C.; Zheng, Y.; Ma, Y.; Li, N.; Truong, L.; Nguyen, H.; Bates, L.; Hawkins, A.; Rodwell, D. Personality, safety attitudes and risky driving behaviors-Evidence from young Taiwanese motorcyclists. Accid. Anal. Prev. 2009, 41, 963–968. [Google Scholar] [CrossRef] [PubMed]
- Sukor, N.; Tarigan, A.; Fujii, S. Analysis of correlations between psychological factors and self-reported behavior of motorcyclists in Malaysia, depending on self-reported usage of different types of motorcycle facility. Transp. Res. Part F Traffic Psychol. Behav. 2017, 46, 509–523. [Google Scholar] [CrossRef]
- Hu, F.; Lv, D.; Zhu, J.; Fang, J. Related risk factors for injury severity of e-bike and bicycle crashes in Hefei. Traffic Inj. Prev. 2014, 15, 319–323. [Google Scholar] [CrossRef]
- Guo, Y.; Zhou, J.; Wu, Y.; Chen, J. Evaluation of Factors Affecting E-Bike Involved Crash and E-Bike License Plate Use in China Using a Bivariate Probit Model. J. Adv. Transp. 2017, 2017, 2142659. [Google Scholar] [CrossRef] [Green Version]
- Yan, X.C.; Wang, T.; Ye, X.F.; Chen, J.; Yang, Z.; Bai, H. Recommended Widths for Separated Bicycle Lanes Considering Abreast Riding and Overtaking. Sustainability 2018, 10, 3127. [Google Scholar] [CrossRef] [Green Version]
- Yang, X.; Huan, M.; Abdelaty, M.; Peng, Y.; Gao, Z. A hazard-based duration model for analyzing crossing behavior of cyclists and electric bike riders at signalized intersections. Accid. Anal. Prev. 2015, 74, 33–41. [Google Scholar] [CrossRef]
- Schepers, J.P.; Fishman, E.; Den Hertog, P.; Wolt, K.K.; Schwab, A.L.; Kovácsová, N.; Vlakveld, W.P.; de Winter, J.C.F.; Huang, Y.; Zhou, Q.; et al. The safety of electrically assisted bicycles compared to classic bicycles. Accid. Anal. Prev. 2014, 73, 174–180. [Google Scholar] [CrossRef]
- Yao, L.; Wu, C. Traffic safety for electric bike riders in china: Attitudes, risk perception, and aberrant riding behaviors. Transp. Res. Rec. 2012, 24, 49–56. [Google Scholar] [CrossRef]
- Zheng, Y.; Ma, Y.; Cheng, J. Effects of personality traits and sociocognitive determinants on risky riding behaviors among Chinese e-bikers. Traffic Inj. Prev. 2019, 20, 838–843. [Google Scholar] [CrossRef]
- Ye, X.F.; Yan, X.C.; Chen, J.; Wang, T.; Yang, Z. Impact of Curbside Parking on Bicycle Lane Capacity in Nanjing, China. Transp. Res. Rec. 2018, 2672, 92–99. [Google Scholar] [CrossRef]
- Zhang, Y.L.; Xie, Y.C. Forecasting of short-term freeway volume with v-support vector machines. Transp. Res. Rec. 2007, 2024, 92–99. [Google Scholar] [CrossRef]
- Yan, B.; Chu, X.N.; Zhang, L. User Perception Modeling by Combining Structural Equation Model and Artificial Neural Network. J. Shanghai Jiaotong Univ. 2019, 53, 830–837. (In Chinese) [Google Scholar]
- Suparman, Y.A.; Folmer, H.B.; Oud, J.H.L. Hedonic price models with omitted variables and measurement errors: A constrained autoregression-structural equation modeling approach with application to urban Indonesia. J. Geogr. Syst. 2014, 16, 49–70. [Google Scholar] [CrossRef]
- Deng, Y.C.; Shi, C.J. Psycho-intentional analysis for the factors leading to fatigue driving based on the Bayesian-SEM. J. Saf. Environ. 2019, 19, 520–526. (In Chinese) [Google Scholar]
- Carla, G.; Rebecca, D.B.; Andreas, G.K.; Karin, S. Fit Index to Assess Model Fit and Detect Omitted Terms in Nonlinear SEM. Struct. Equ. Model. 2017, 24, 414–417. [Google Scholar] [CrossRef]
- Raut, R.D.; Priyadarshinee, P.; Gardas, B.B.; Jha, M.K. Analyzing the factors influencing cloud computing adoption using three stage hybrid SEM-ANN-ISM (SEANIS) approach. Technol. Forecast Soc. Chang. 2018, 134, 98–123. [Google Scholar] [CrossRef]
- Gliem, J.A.; Gliem, R.R. Calculating, interpreting, and reporting Cronbach’s alpha reliability coefficient for Likert-type scales. In Proceedings of the Midwest Research-to-Practice Conference in Adult, Continuing, and Community Education, Columbus, OH, USA, 8–10 October 2003; Ohio State University: Columbus, OH, USA, 2003. [Google Scholar]
- Wong, J.T.; Chang, Y.H.; Huang, S.H. Some Insights of Young Motorcyclists’ Risky Behavior. In Proceedings of the Transportation Research Board 88th Annual Meeting, Washington, DC, USA, 11–15 January 2009. [Google Scholar]
- Rundmo, T.; Iversen, H. Risk perception and driving behavior among adolescents in two Norwegian counties before and after a traffic safety campaign. Saf. Sci. 2004, 42, 1–21. [Google Scholar] [CrossRef]
- Machin, M.A.; Sankey, K.S. Relationships between young drivers’ personality characteristics, risk perceptions, and driving behavior. Accid. Anal. Prev. 2008, 40, 541–547. [Google Scholar] [CrossRef] [Green Version]
- Golob, T.F. Structural equation modeling for travel behavior research. Transp. Res. Part B Methodol. 2003, 37, 1–25. [Google Scholar] [CrossRef] [Green Version]
- Yang, C.; Ye, X.F.; Xie, J.; Yan, X.C.; Lu, L.L.; Yan, Z.; Wang, T. Analyzing Drivers’ Intention to Accept Parking App by Structural Equation Model. J. Adv. Transp. 2020, 2020, 1–11. [Google Scholar] [CrossRef] [Green Version]
- Hu, L.; Bentler, P.M. Cutoff criteria for fit indexes in covariance structure analysis: Conventional criteria versus new alternatives. Struct. Equ. Model. 1999, 6, 1–55. [Google Scholar] [CrossRef]
- Wang, J.; Peeta, S.; Lu, L.; Li, T. Multiclass information flow propagation control under vehicle-to-vehicle communication environments. Transp. Res. Part B Methodol. 2019, 129, 96–121. [Google Scholar] [CrossRef] [Green Version]
- Wang, J.; Gong, S.; Peeta, S.; Lu, L. A real-time deployable model predictive control-based cooperative platooning approach for connected and autonomous vehicles. Transp. Res. Part B Methodol. 2019, 128, 271–301. [Google Scholar] [CrossRef]
- Wang, J.; Peeta, S.; He, S. Multiclass traffic assignment model for mixed traffic flow of human-driven vehicles and connected and autonomous vehicles. Transp. Res. Part B Methodol. 2019, 126, 139–168. [Google Scholar] [CrossRef]
- Lu, L.L.; Chan, C.Y.; Wang, J.; Wang, W. A study of pedestrian group behaviors in crowd evacuation based on an extended floor field cellular automaton model. Transp. Res. Part C Emer. 2017, 81, 317–329. [Google Scholar] [CrossRef]


| Variable | Category | Frequency | Percentage |
|---|---|---|---|
| Sex | Male | 328 | 57.2% |
| Female | 245 | 42.8% | |
| Age sections | -- | Mean = 29.7, SD = 10.1, Range = 14–63 | |
| Youth (<35 years) | 387 | 67.5% | |
| Middle aged group (35–55 years) | 161 | 28.1% | |
| Seniors group (>55 years) | 25 | 4.4% | |
| Marital status | Unmarried | 320 | 55.8% |
| Married | 253 | 44.2% | |
| Educational level | Junior high or below | 146 | 25.5% |
| Secondary school | 183 | 31.9% | |
| College degree or above | 244 | 42.6% | |
| Motor vehicle driving experience | Yes | 196 | 34.2% |
| No | 383 | 66.8% | |
| E-bike type | Pedal-type | 142 | 24.8% |
| Light motor-type | 431 | 75.2% | |
| Experience in e-bike riding | Riding time (year) | Mean = 3.8, SD = 2.9, Range = 0.5–17 | |
| Riding frequency (sub-/weekly) | Mean = 4.78, SD = 2.0, Range = 1–7 | ||
| 1–2 | 78 | 13.6% | |
| 3–5 | 254 | 44.3% | |
| 6–7 | 241 | 42.1% | |
| Average riding distance per day (km) | Mean = 12.2, SD = 10.7, Range = 1–42 | ||
| <5 | 237 | 41.3% | |
| 5–10 | 123 | 21.5% | |
| >10 | 213 | 37.2% | |
| Main uses | |||
| Work | 303 | 52.9% | |
| Go to school | 93 | 16.2% | |
| Daily routines | 137 | 23.9% | |
| Business/freight | 39 | 6.8% | |
| Been punished or warned for violations in the past three years | Yes | 95 | 16.6% |
| No | 478 | 83.4% | |
| Had a traffic crash in the past three years | Uninjured crash | 81 | 14.1% |
| Minor injury crash | 164 | 28.6% | |
| Severe crash | 19 | 3.3% | |
| Total | 264 | 46.0% | |
| Had primary responsibility crash in the past three years | Yes | 108 | 18.8% |
| No | 465 | 81.2% | |
| Model | Definition | Index Results | Evaluation Standard |
|---|---|---|---|
| DF | Degrees of freedom | 68 | - |
| CMIN | Chi-squared | 257.266 | - |
| CMIN/DF | - | 3.378 | 1–5 |
| RMSEA | Root Mean Square Error Approximation | 0.107 | <0.050 |
| CFI | Comparative Fit Index | 0.879 | >0.900 |
| GFI | Goodness of Fit Index | 0.873 | >0.900 |
| NFI | Normed Fit Index | 0.846 | >0.900 |
| IFI | Incremental Fit Index | 0.881 | >0.900 |
| Model | Index Results | Evaluation Standard |
|---|---|---|
| CMIN | 155.295 | - |
| CMIN/DF | 2.250 | 1–5 |
| RMSEA | 0.028 | <0.050 |
| CFI | 0.922 | >0.900 |
| GFI | 0.948 | >0.900 |
| NFI | 0.913 | >0.900 |
| IFI | 0.925 | >0.900 |
| Dimension | |||
|---|---|---|---|
| Direct effect | |||
| Risk perception () | (−0.47) | ||
| Safety attitude () | (−0.81) | (0.34) | |
| Risky riding behavior () | (−0.76) | (−0.51) | |
| Indirect effect 1 | |||
| Safety attitude () | (−0.47 × 0.34) | ||
| Risky riding behavior () | (−0.47 × −0.76) | (0.34 × −0.51) | |
| (−0.81 × −0.51) | |||
| Indirect effect 2 | |||
| Risky riding behavior () | (−0.47 × 0.34 × −0.51) | ||
© 2020 by the authors. Licensee MDPI, Basel, Switzerland. This article is an open access article distributed under the terms and conditions of the Creative Commons Attribution (CC BY) license (http://creativecommons.org/licenses/by/4.0/).
Share and Cite
Wang, T.; Xie, S.; Ye, X.; Yan, X.; Chen, J.; Li, W. Analyzing E-Bikers’ Risky Riding Behaviors, Safety Attitudes, Risk Perception, and Riding Confidence with the Structural Equation Model. Int. J. Environ. Res. Public Health 2020, 17, 4763. https://doi.org/10.3390/ijerph17134763
Wang T, Xie S, Ye X, Yan X, Chen J, Li W. Analyzing E-Bikers’ Risky Riding Behaviors, Safety Attitudes, Risk Perception, and Riding Confidence with the Structural Equation Model. International Journal of Environmental Research and Public Health. 2020; 17(13):4763. https://doi.org/10.3390/ijerph17134763
Chicago/Turabian StyleWang, Tao, Sihong Xie, Xiaofei Ye, Xingchen Yan, Jun Chen, and Wenyong Li. 2020. "Analyzing E-Bikers’ Risky Riding Behaviors, Safety Attitudes, Risk Perception, and Riding Confidence with the Structural Equation Model" International Journal of Environmental Research and Public Health 17, no. 13: 4763. https://doi.org/10.3390/ijerph17134763