Field Investigations of Underwater Mounds Formed by Hopper Dredge Discharges in a Coastal Environment


1
College of Water Conservancy and Hydropower Engineering, Hohai University, Nanjing 210098, China
2
State Key Laboratory of Hydrology-Water Resources and Hydraulic Engineering, Nanjing 210098, China
3
Nanjing Hydraulic Research Institute, Nanjing 210029, China
4
Division of Fluid and Experimental Mechanics, Luleå University of Technology, 97187 Luleå, Sweden
*
Author to whom correspondence should be addressed.
J. Mar. Sci. Eng. 2020, 8(6), 395; https://doi.org/10.3390/jmse8060395
Submission received: 11 May 2020
/
Revised: 27 May 2020
/
Accepted: 29 May 2020
/
Published: 30 May 2020
Abstract
:In a coastal environment, this paper investigated the formation process and the cumulative shape of subaqueous mounds formed by hopper dredged discharges. Hydrological observations and field tests were performed to examine the flow features and ultimately generated morphology characteristics. A high-precision digital elevation model (DEM) was established by multi-beam depth sweeping (MBDS) in the experiment. Particular attention was paid to the formation of the mounds, the three-dimensional shape and the influence factors. The field measurements showed that the mounds were roughly symmetrical in space, and the tidal current, though of weak strength, played a certain role in shaping the profiles. Cone and volcanic cone mound tops were observed, featuring the main top shapes. The height and covered area of the mounds were proportional to the amount of dumped sediment, and they were also affected a lot by the water depth. The results of superimposed tests showed that the second placement over the existing mound resulted in a similar overall shape, but there was pronounced movement around the mound; additional discharged volumes at the same location mainly increased the mound height. The field tests provided a reference for understanding the sediment dumping in other similar coastal areas.
1. Introduction
In coastal areas, driven by rapid international trade development and economic globalization, construction of ports and widening of waterways has led to the rapid expansion of the dredging industry. Dredged soil, an available resource, is commonly used for ecological restoration and land reclamation [1]. Usually, dredged soils are dumped directly by suction dredgers in designated dumping areas [2,3,4,5]. As required by environmental protection and design optimization, higher dumping standards, in terms of smoothness or gradient of underwater sediment mounds, have been put forward. To form an ideal morphology and meet requirements after dumping, the traditional method is to map the accumulated topography by multi-beam measurement, and then to shape the topography by excavation-filling construction. However, the remedial shaping measures create a need for additional investment in the process of secondary earthwork handling. During the dumping, it is thus valuable to predict the shape of the resulting mound so that the expected morphology is achieved with the minimal workload.
Many researchers have carried out a lot of work on sediment dumping. In the early stage, the features of sediment transport and diffusion after sediment dumping were studied through prototype observations. The investigation was firstly carried out in the Thames River in Britain in 1954, and in the following years, scholars from more than 20 countries [6,7,8,9,10], developed the observations in the disposal scheme of dredged materials. It was acknowledged that convective diffusion occurred when sediment particles enter the water body under the interaction of buoyancy, gravity, resistance and turbulence of transverse flow. The transverse flow was the governing force for the convective transport of sediment. The turbulent action strengthened the mixing effect of flow and sediment, and it destroyed the double-eddy structure in still water, and significantly increased the width of subaqueous sediment mounds in transverse and longitudinal directions [11].
Chen et al. [12] and Pupienis et al. [13] studied the morpho-dynamics of the dumping area and the morphology of the subaqueous sediment mounds. Their results showed that, under the interplay of the ebb tide and particle gravity, there existed both transport-diffusion and settlement behaviors in the process of sediment dumping; the sediment mounds formed by dredged soil were mainly affected by waves and tidal currents. In addition to the sediment diffusion during the dumping, the currents and waves also resulted in the particles’ horizontal movement.
Existing studies mainly focused on the temporal and spatial distribution of sediment concentration and sediment transport in the process of sediment dumping. To study the physical impact of secondary or long-term handling, Du et al. [14] carried out the research in a quantitative way in the Belgian coastal zone. From 1995 to 2004, Wienberg et al. investigated in the Wessel Estuary (Gulf of Germany, North Sea of Southeast China), aiming to reveal the impact of long-term tidal energy on the morphological change of sediment mounds [15,16].
In coastal environments, imposed by practical constraints, prototype observations and measurements are challenging to make; available data are fragmented and relatively incomplete. Limitations do exist for the examination of morpho-dynamic processes in the dumps of dredged materials and further research needs to be carried out. Therefore, the study deals, through on-site tests, with the morphology characteristics of underwater sediment mounds. The main purpose of the study is to examine the formation process and cumulative shape of underwater sediment shape and its influencing factors. In the experiment, a high-precision digital elevation model (DEM) is performed by multi-beam depth sweeping (MBDS). Two scenarios are tested including sediment dumping in one time and second placement over the existing mound. The results provide a reference to behaviors of sediment dumping in similar situations. The paper includes the description of the experimental site, hydrological observations of flow and sediment, experimental tests and data analyses, and the examination of major morphological features.
2. Experimental Site
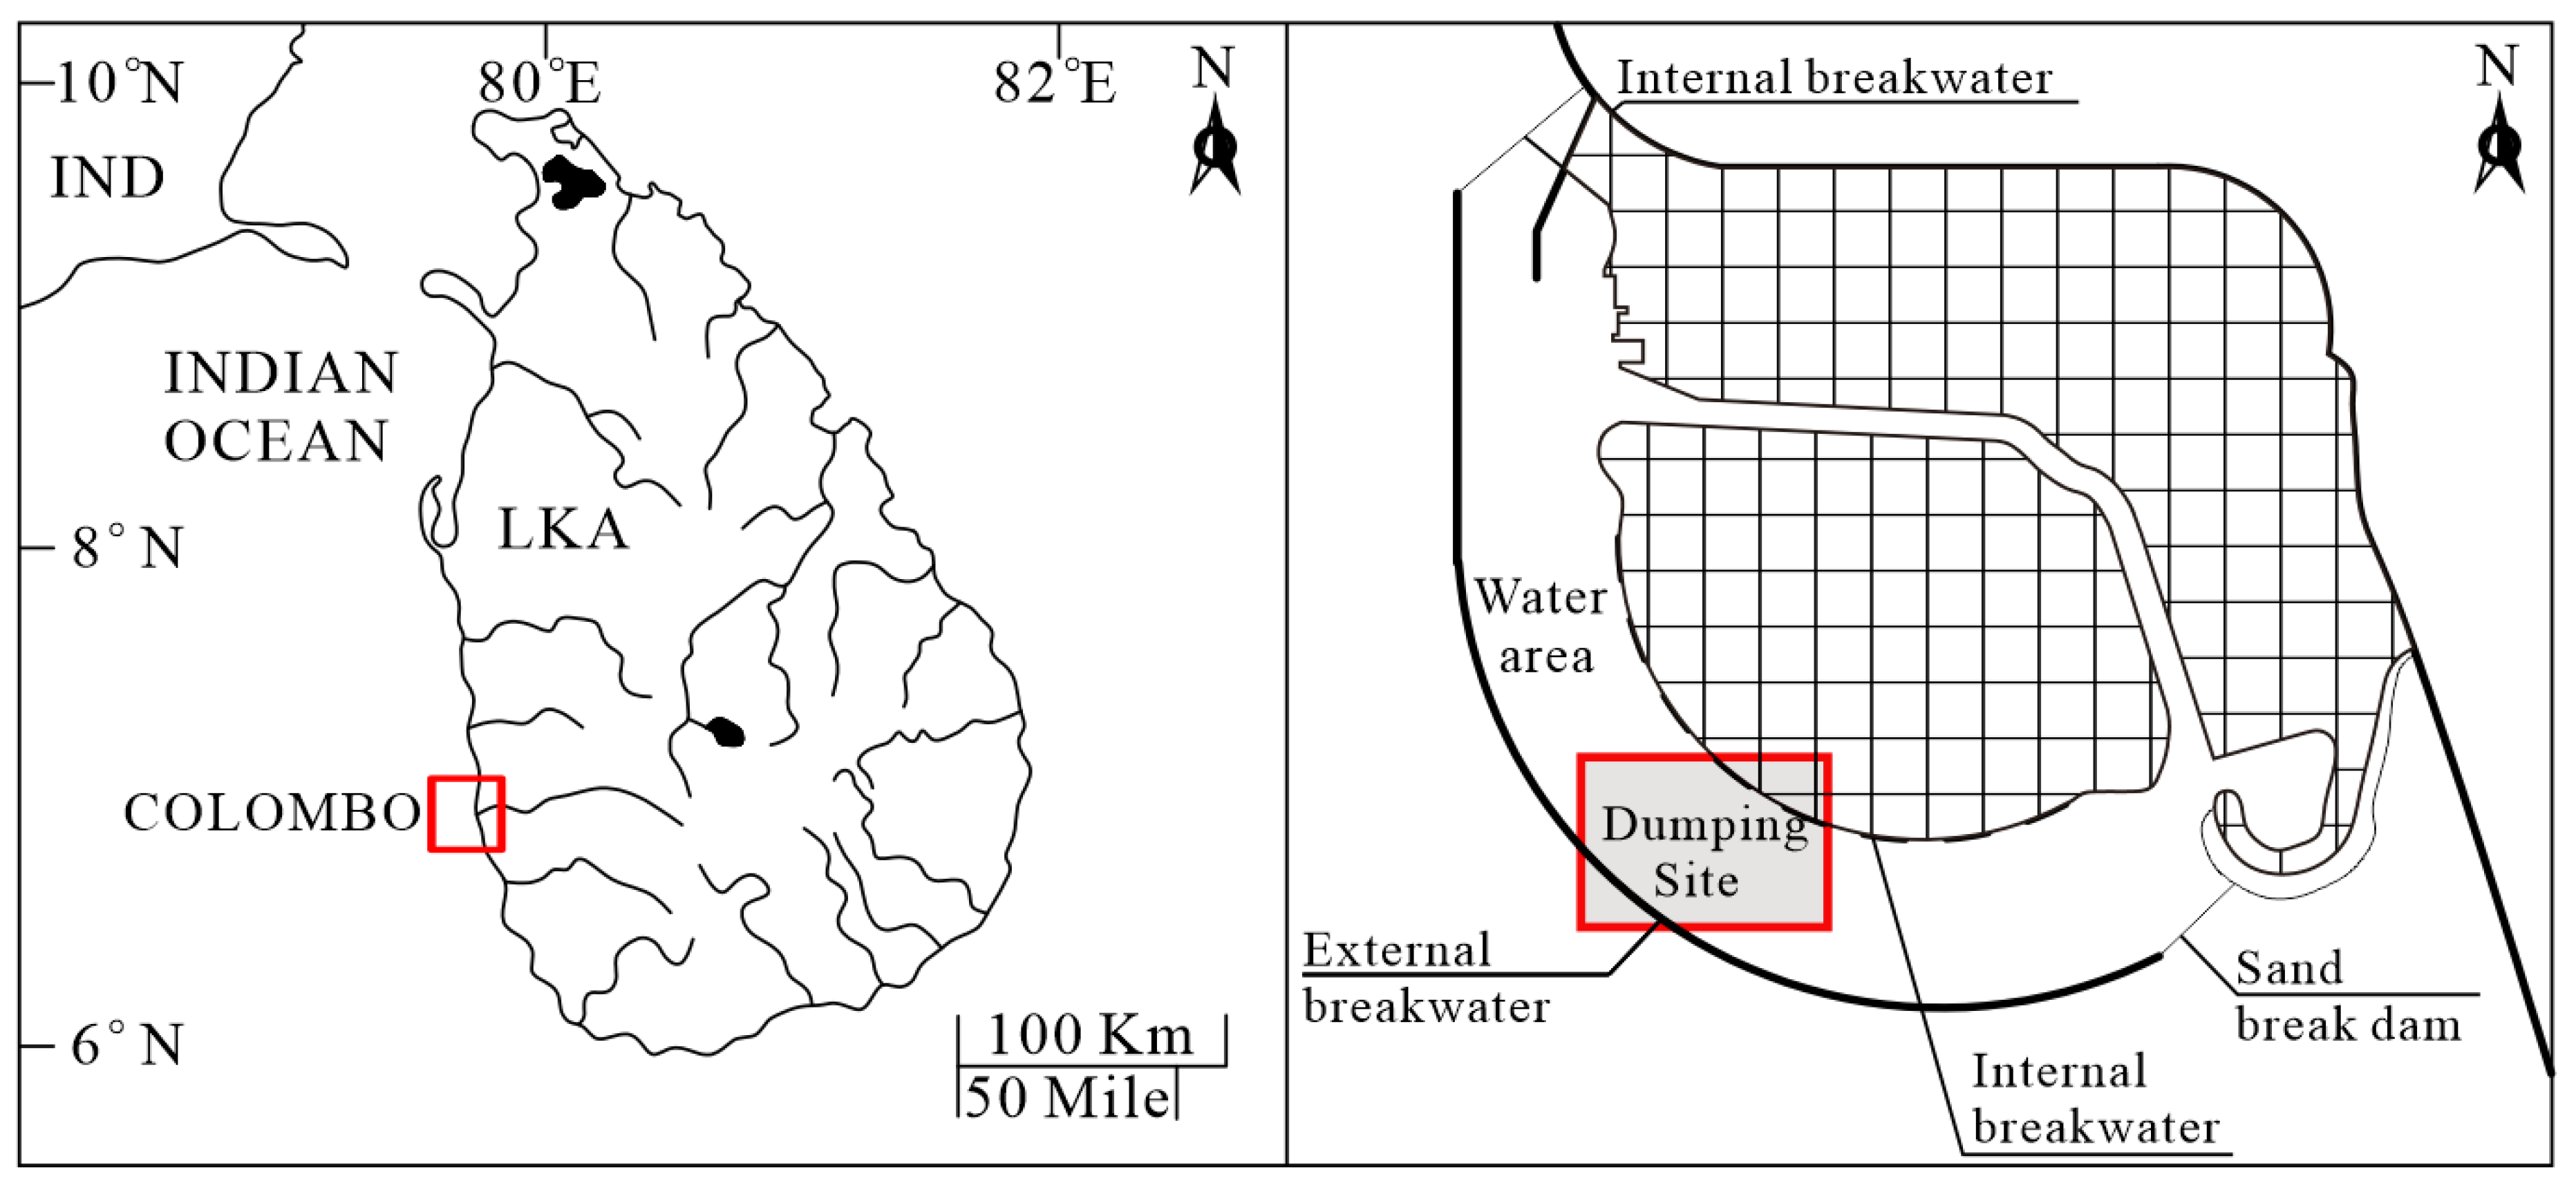
Sri Lanka is an island country, located in the northeast of the Indian Ocean. Colombo Port, Sri Lanka’s largest port, resides on the southwest of Ceylon Island, south of the Kelani River (Figure 1). The offshore area is mainly affected by the southwest monsoon and ocean currents. Inshore, the port is lined by extensive tidal flats, surrounded by subtidal shoals with water depths between 10−20 m. A breakwater, 3445 m long, situates outside of the port. The tidal effect is relatively weak. In the interior of the port city, two tidal channels are subsequently generated, a result of artificial reclamation. They have the function of facilitating water exchange. The west channel is the main water-course with a large depth. The test site resides in the west channel, between the internal revetment and the external breakwater, as shown in Figure 1. Protected by the external breakwater, the site is not exposed to strong tidal currents and wave effects.
The curved beach of Colombo Port is characterized by sandy coast. There are no obvious sand sources and traces of sediment transport and accumulations. The trend of sediment transport along the coast is not obvious. Even in the case of wind and waves, the suspended sediment concentration is relatively small. The sediment is considered to be supplied by Clani River runoff, 6.0 km north of the Colombo Port and the beaches near the coastal area also make contributions. However, sand mining in the upper reaches of the Karani River, results in a reduced amount of sediment significantly. A sandy barrier exists at the entrance of the breakwater, and the near-shore sediment transported is currently the main source of sediment [17].
3. Field Measurements
3.1. Hydrological Observations
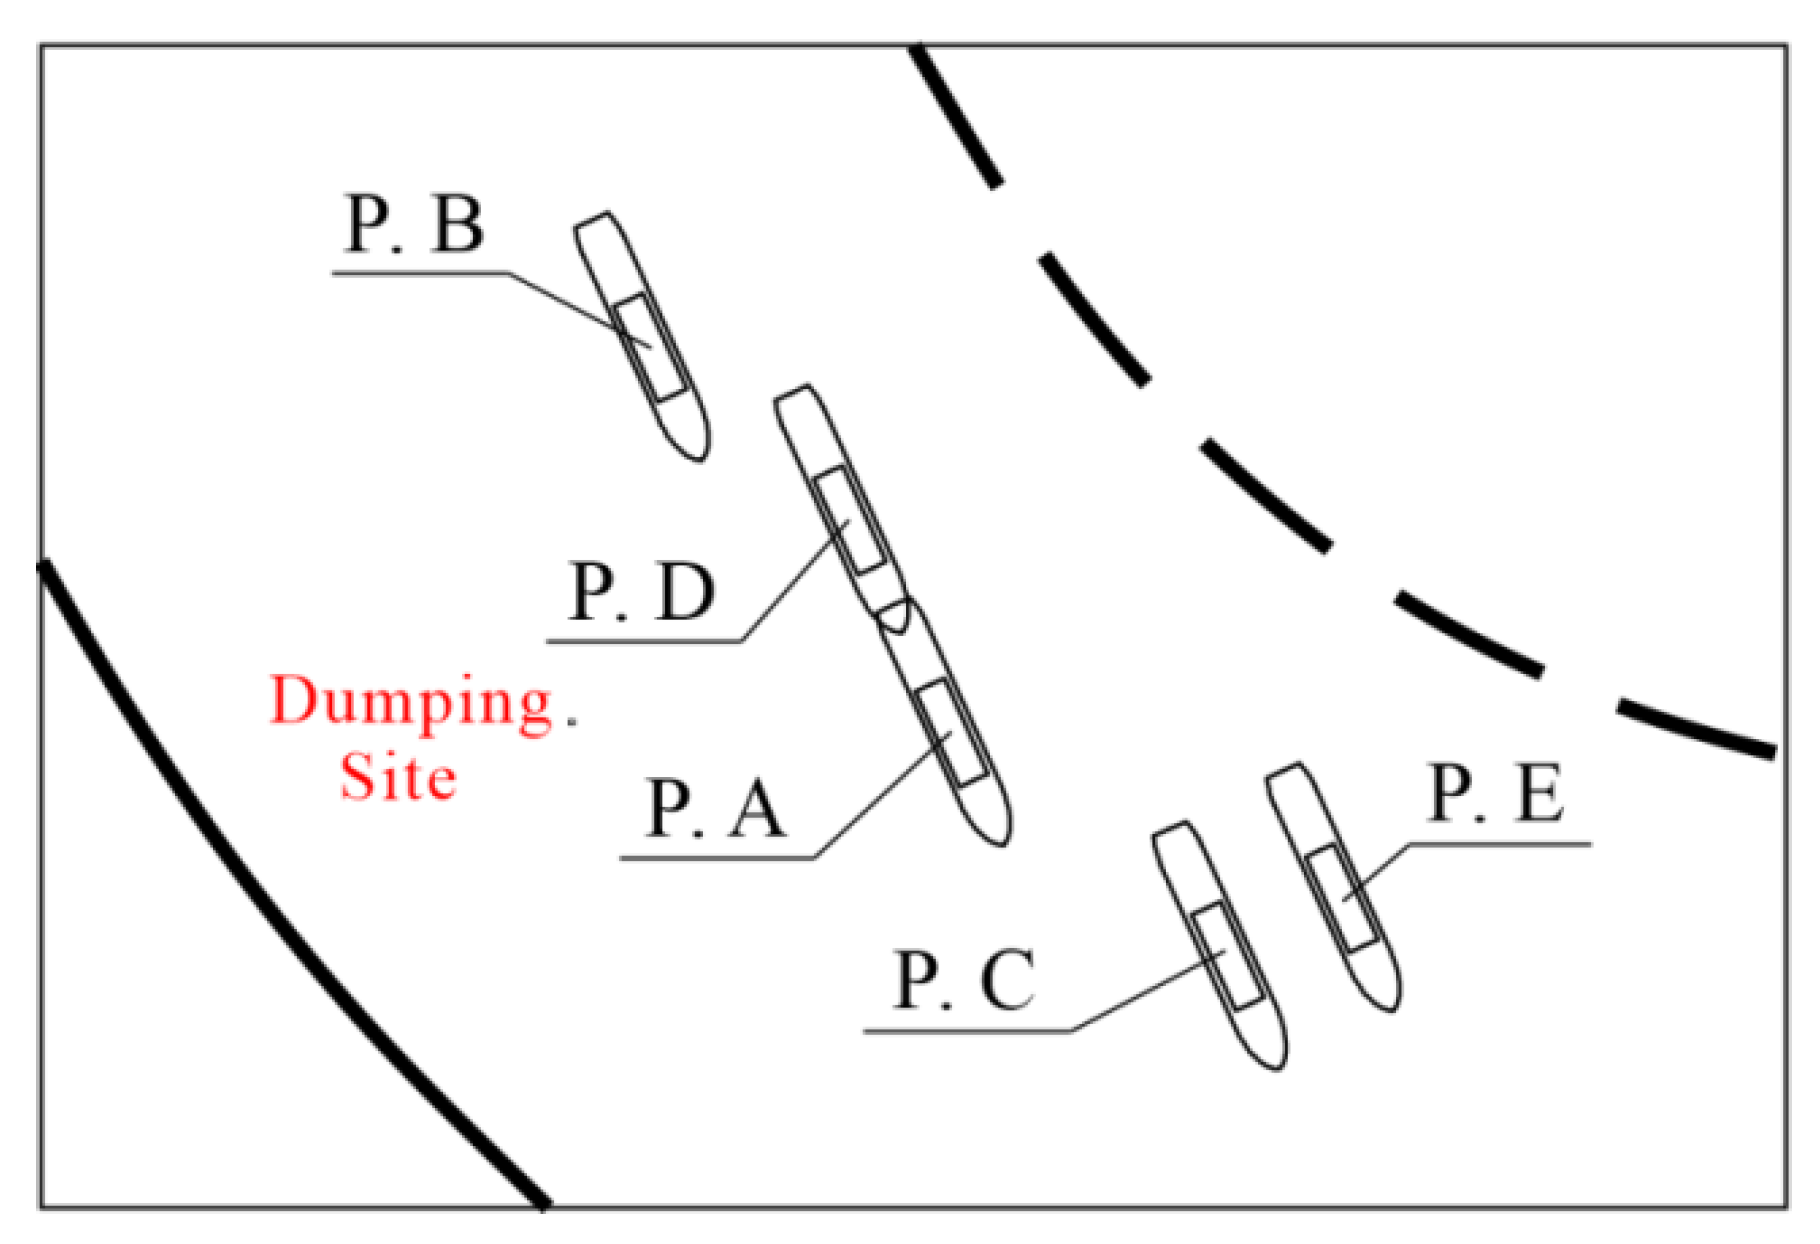
At the test site, the experiment was carried out under calm weather conditions. To examine the influence of different hydrological conditions, five sites were selected to perform the experiment, as shown in Figure 2. The five sites are denoted as P.A−P.E. The measured hydrological data included the flow velocity, water level, water depth and sediment distributions.
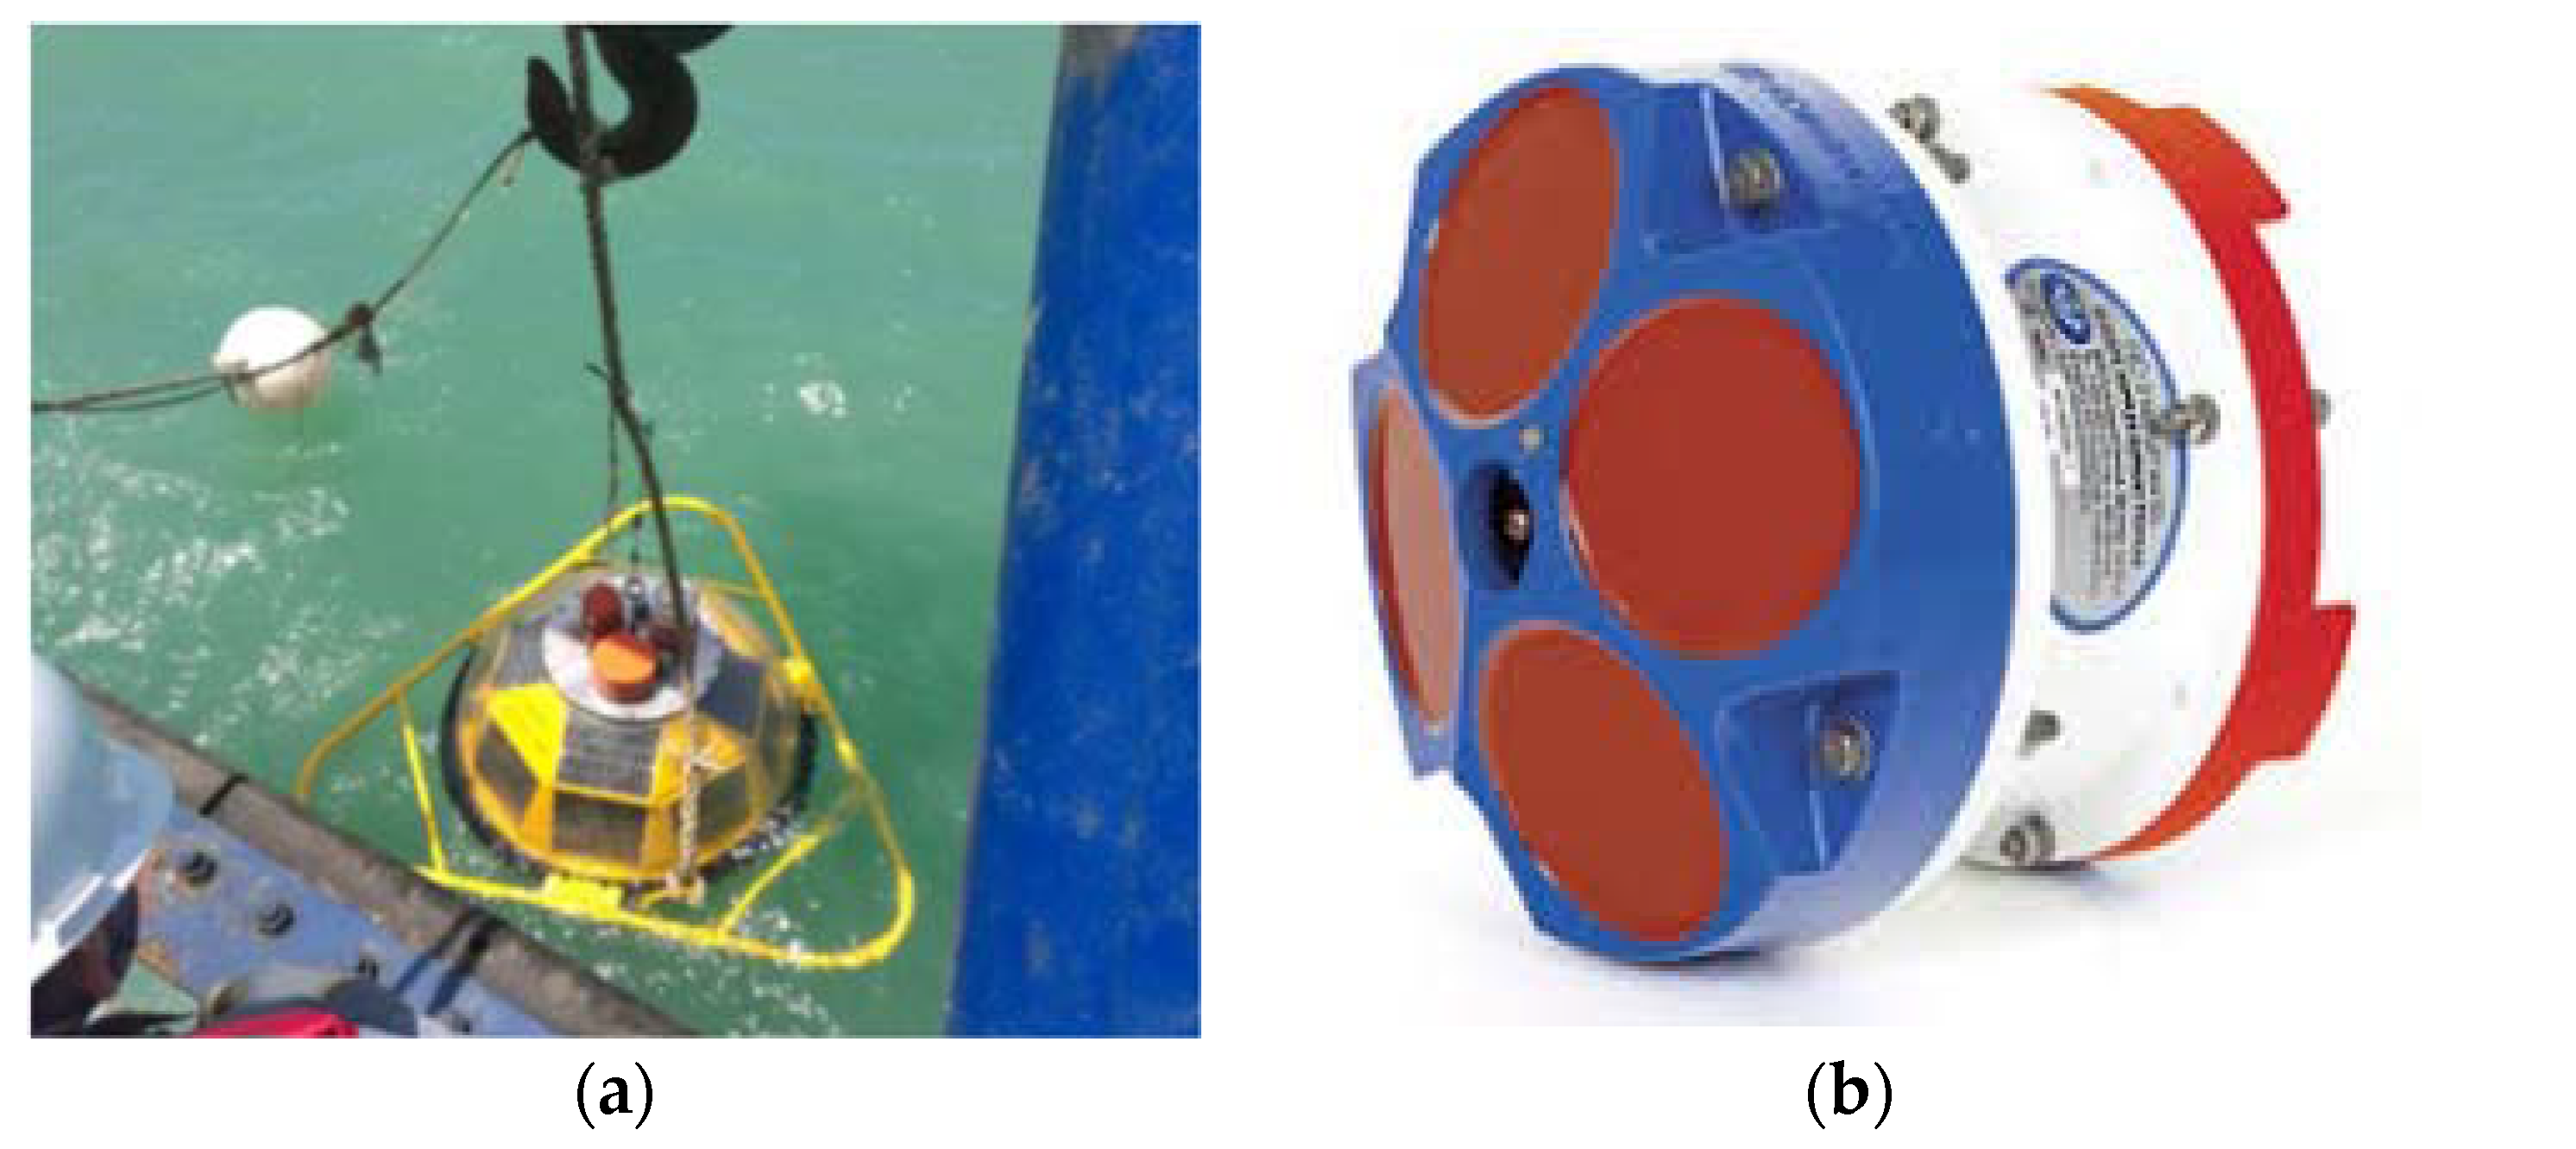
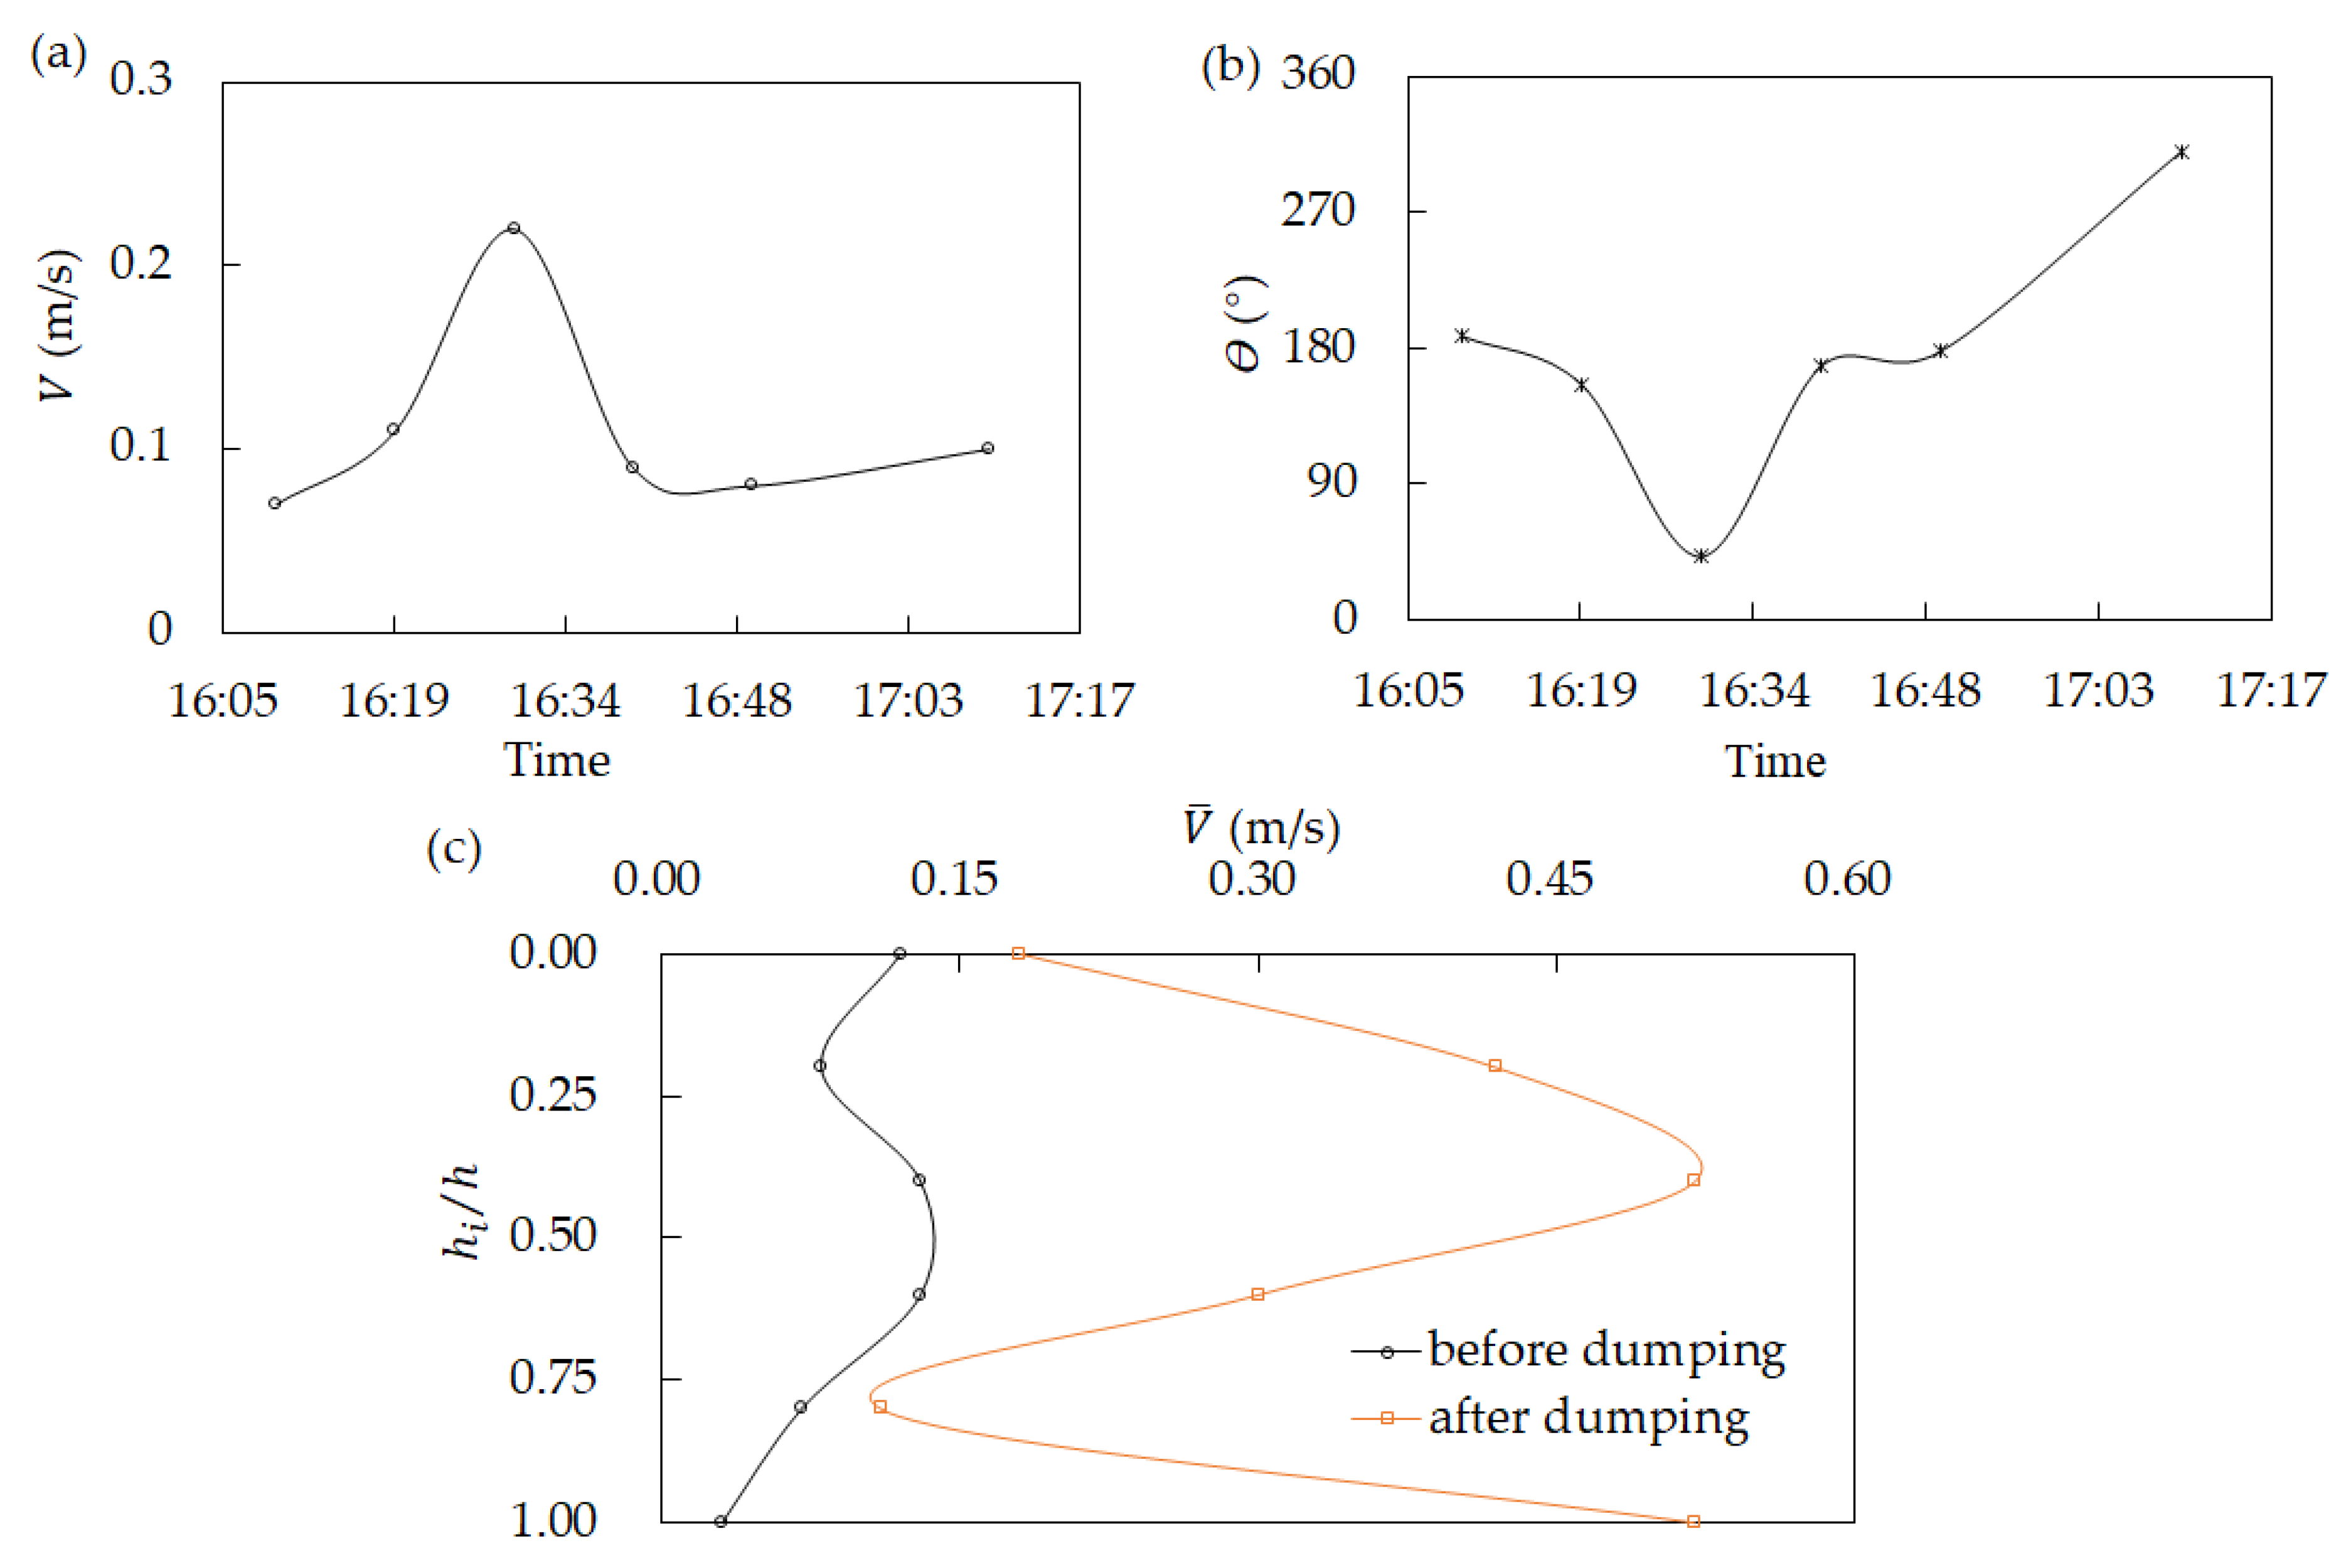
Flow velocities and water depths of these points (each with one plumb line) were measured with four-beam 300 kHz SeaWatch Acoustic Doppler Cassent Profilers (ADCPs) (P-Nav Scientific Instruments Co., Ltd., Shanghai, China). They were attached to recording equipment that was anchored on a customized motorboat, with Global Positioning System (GPS) positioning. The four-beams were at 20° from each other (Figure 3a). The uncertainty of the flow velocity measurements was below ±2%. SBF6-2 type wave observation instrument measured water-levels, with ±1 cm accuracy (Figure 3b). To ensure the accuracy of the results, along each line, the sampling was made at six depths from the water surface, i.e., hi = 0, 0.2 h, 0.4 h, 0.6 h, 0.8 h, and 1.0 h, where h(m) is the water depth at each line.
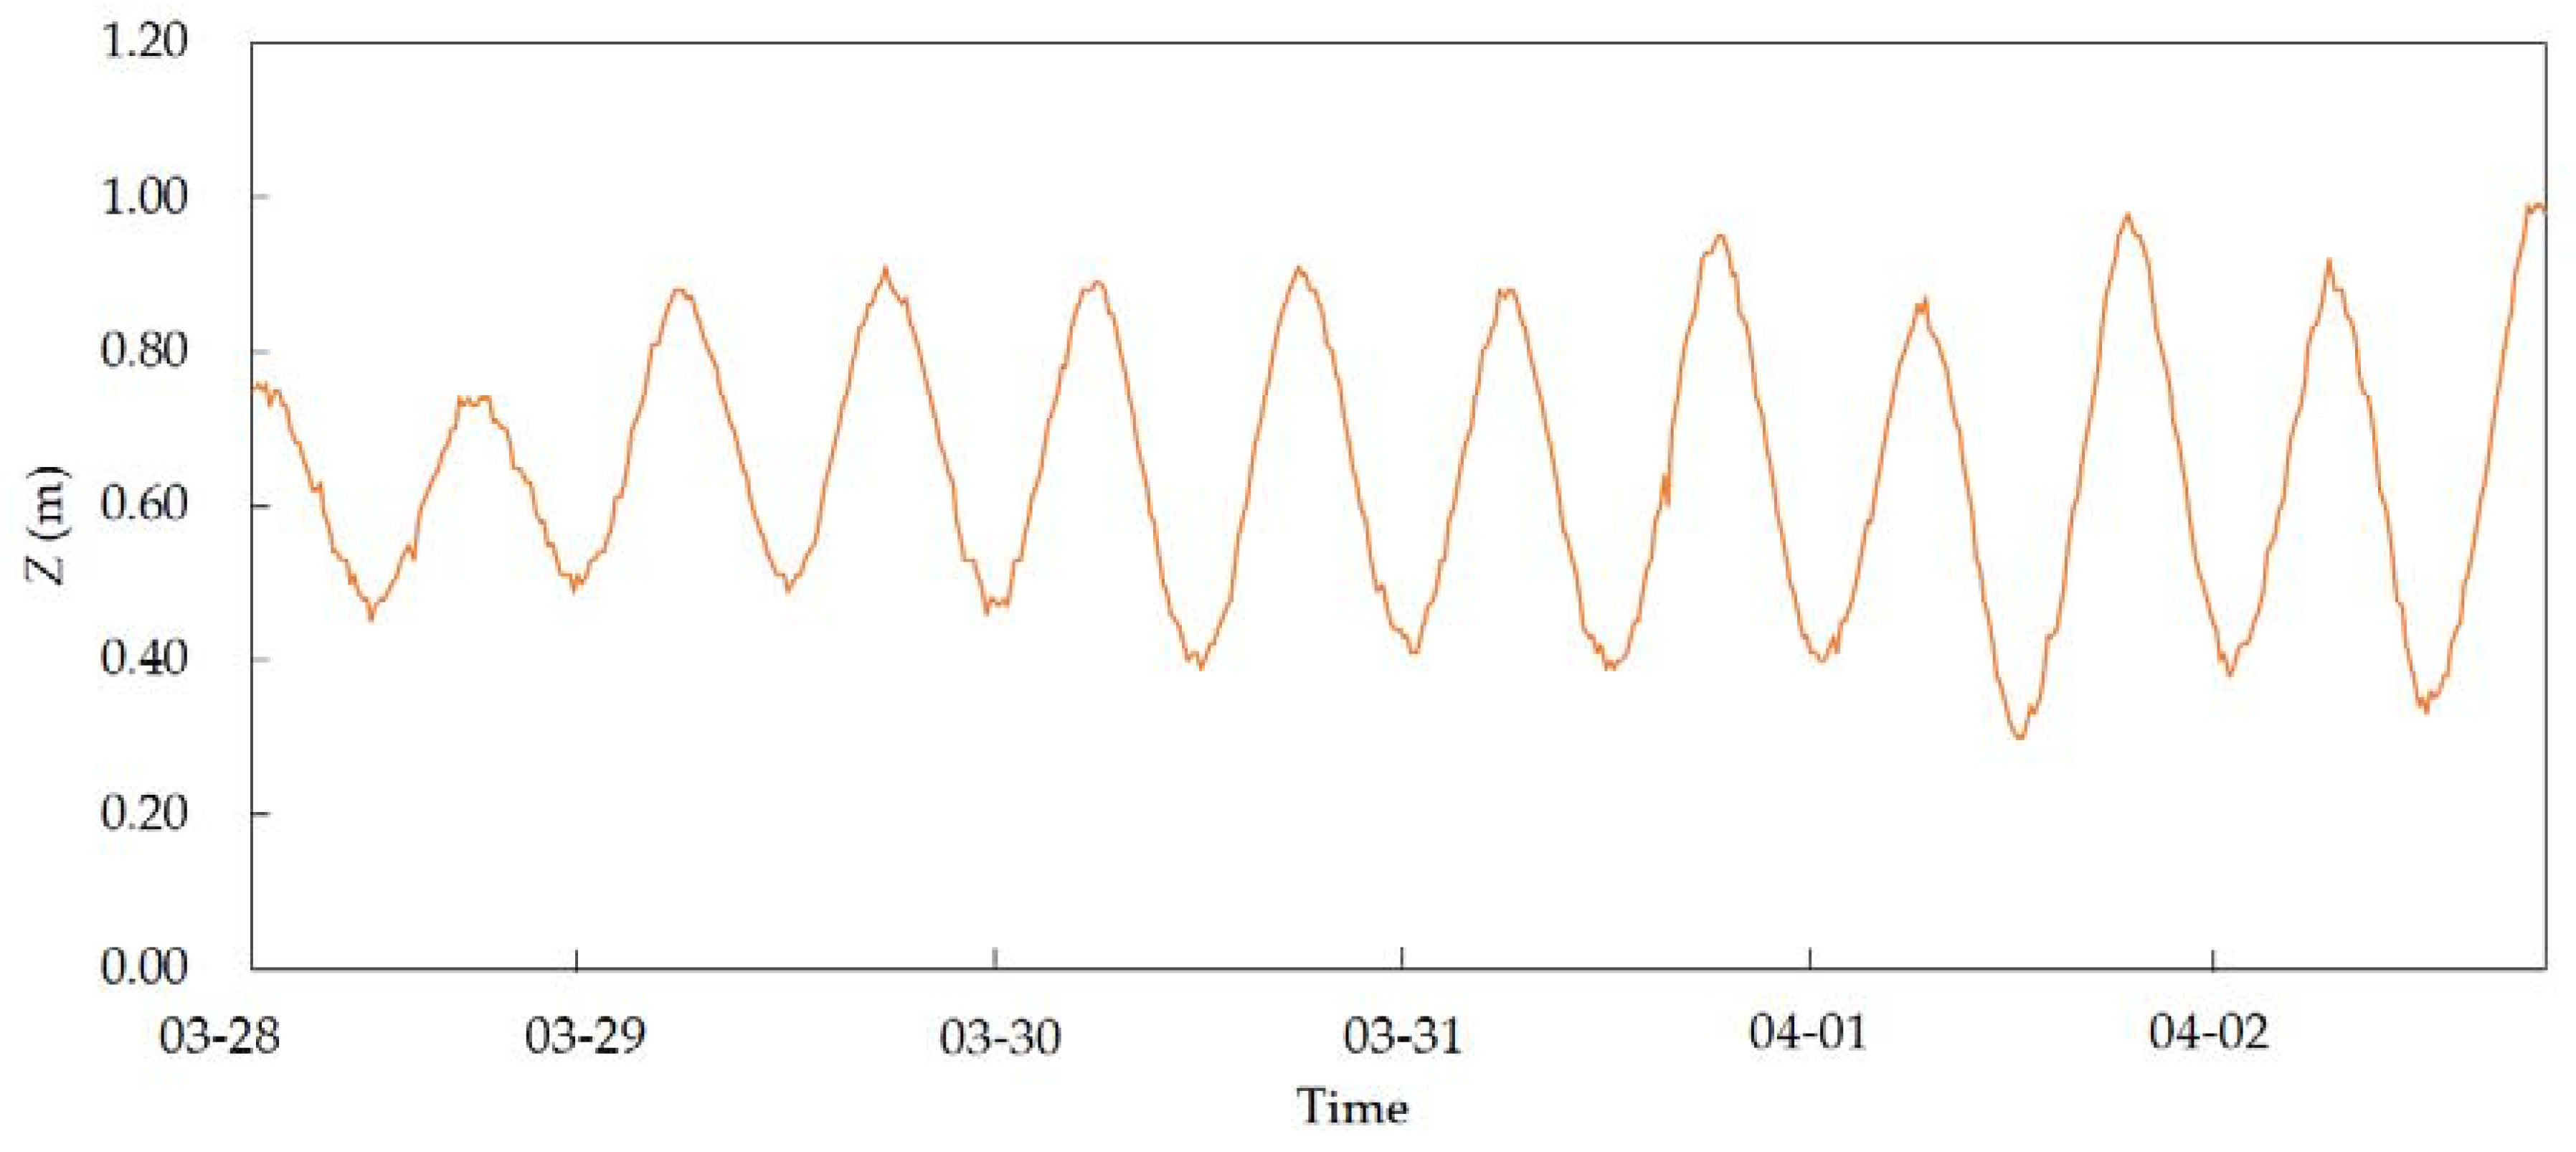
According to the measurements at the five positions, the velocity at different hi is displayed in Table 1, showing asymmetry distributions from the surface to seabed. The velocity values were relatively small (0.02−0.20 m/s), indicating a weak flow motion inside the breakwater. The observed tidal levels are presented in Figure 4. During the test, the lowest Z was 0.30 m and the highest Z was 1.00 m, where the Z denoted the tidal water level. The mean tidal range was ~0.30 m, implying that the experiments were performed during neap tides. The average water depth, measured at normal water level, was ~15 m.
At the experimental site, a detailed survey of the bed materials was performed with Shipek grab samplers; suspended sediment, although limited in amount, was also sampled with point-integrative water samplers and its amount was calculated. The grain-size distribution was analyzed using an automated laser particle-size analyzer (Bettersize 2000 W) (Bettersize Ltd., Dandong, China). The bed material components and particle distributions are displayed in Table 2, where d (mm) is the diameter of particles. The results revealed that the sediment near the sea area was mainly composed of sand and gravel; there was almost no silt and clay.
The sampling results also showed that the spatial distribution of sediments was not in a regular way, and the coarse grains were widely distributed in the south of the port. The fine-grained areas of samples over 0.5 mm were also monitored in the coastal beaches, mainly in the south of the breakwater.
3.2. Experimental Tests
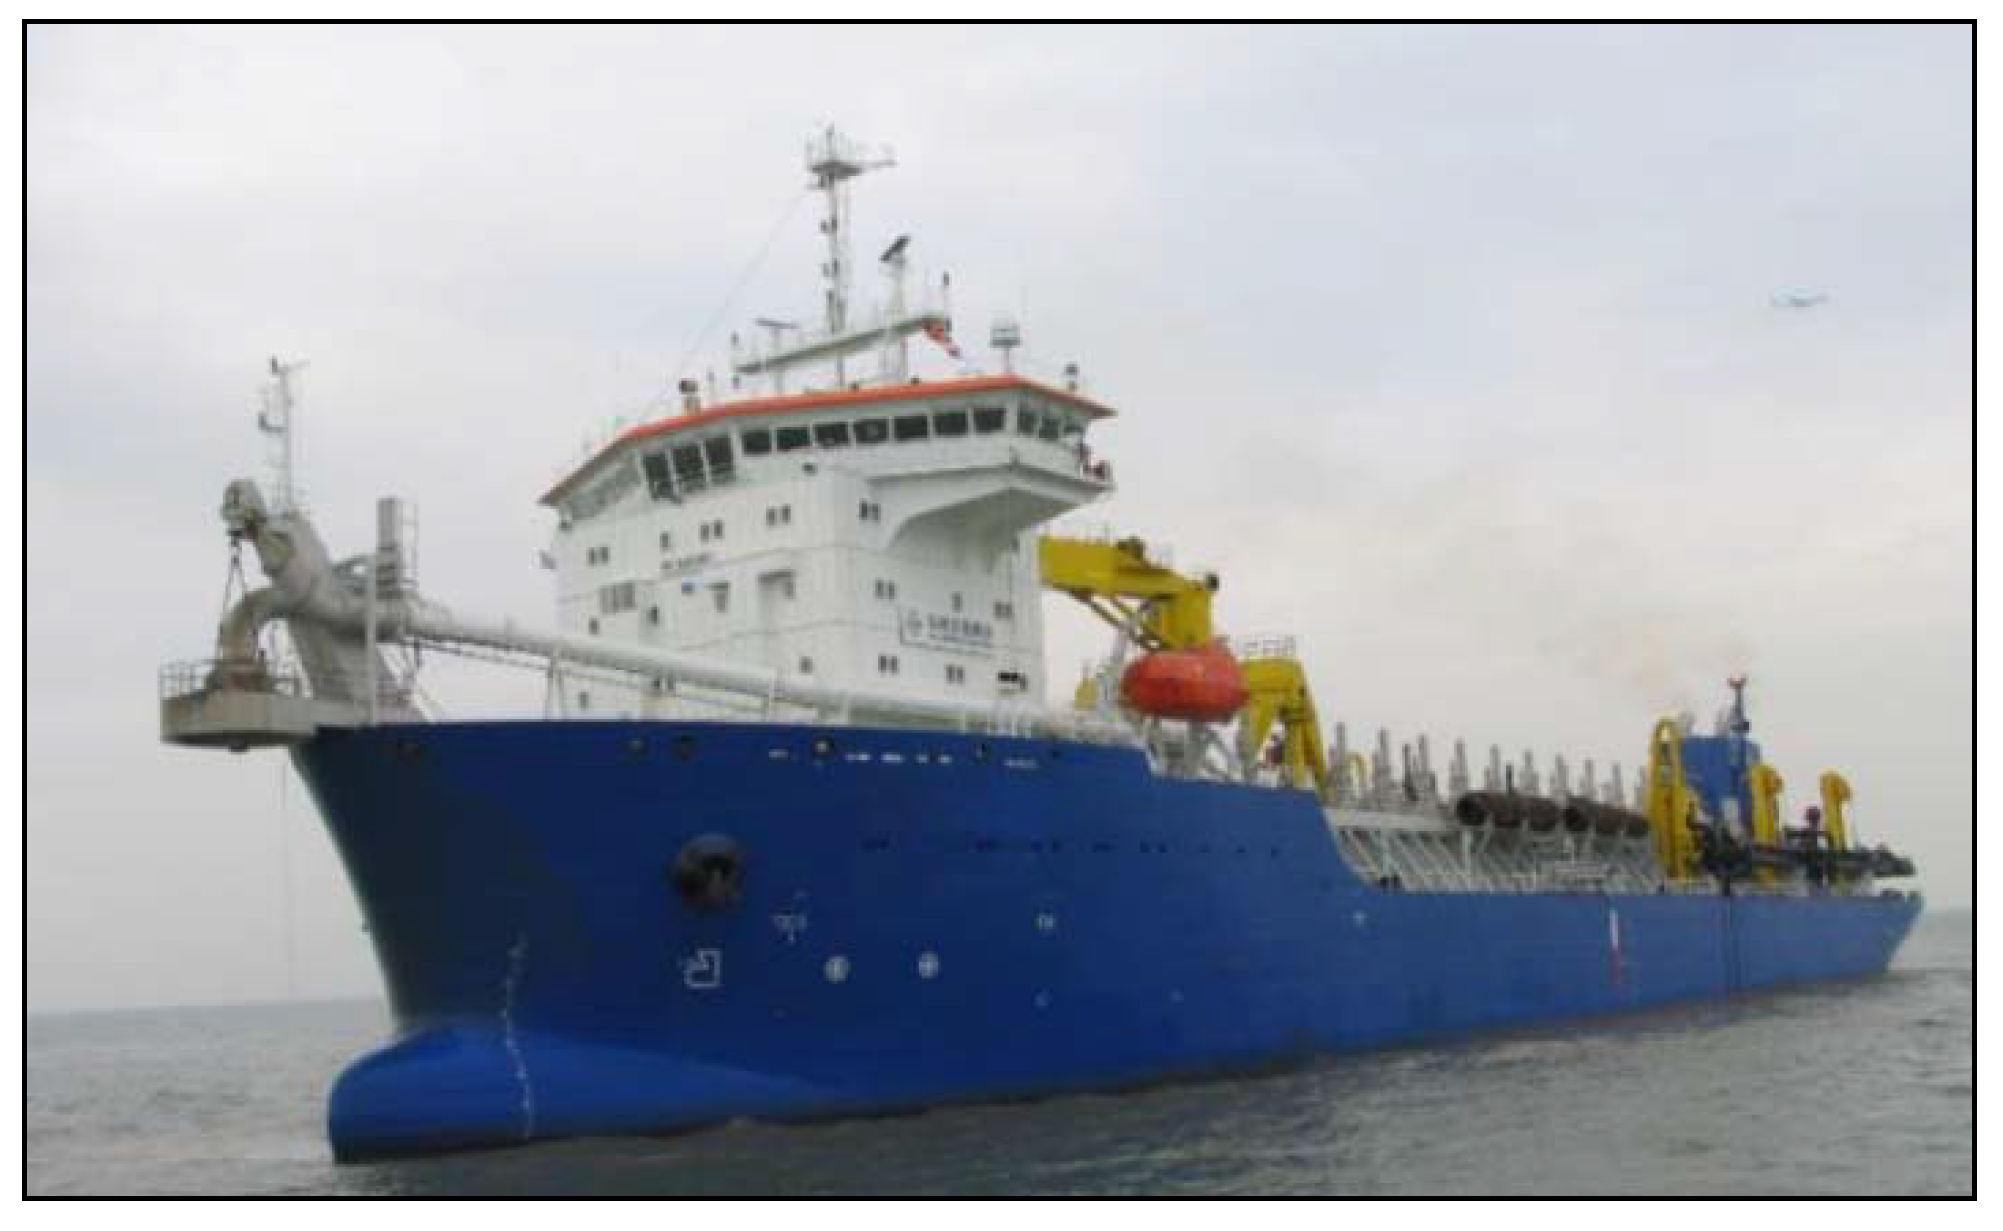
To investigate the features of subaqueous sediment mounds, a 5-day bottom-dump test was carried out; the measurements were investigated five times between 28 March and 1 April 2018, with the assistance of CHEC Dredging Co. Ltd. A rake suction dredger, with the maximum hopper capacity of 50,000 m3, was used to dump the sediment. The photo of the dredger, employed during the test, is shown in Figure 5. During the dumping, the dredger was not allowed to move. The distance between the bottom-door and the sea bed was ~10 m, increasing gradually with the release of sediment.
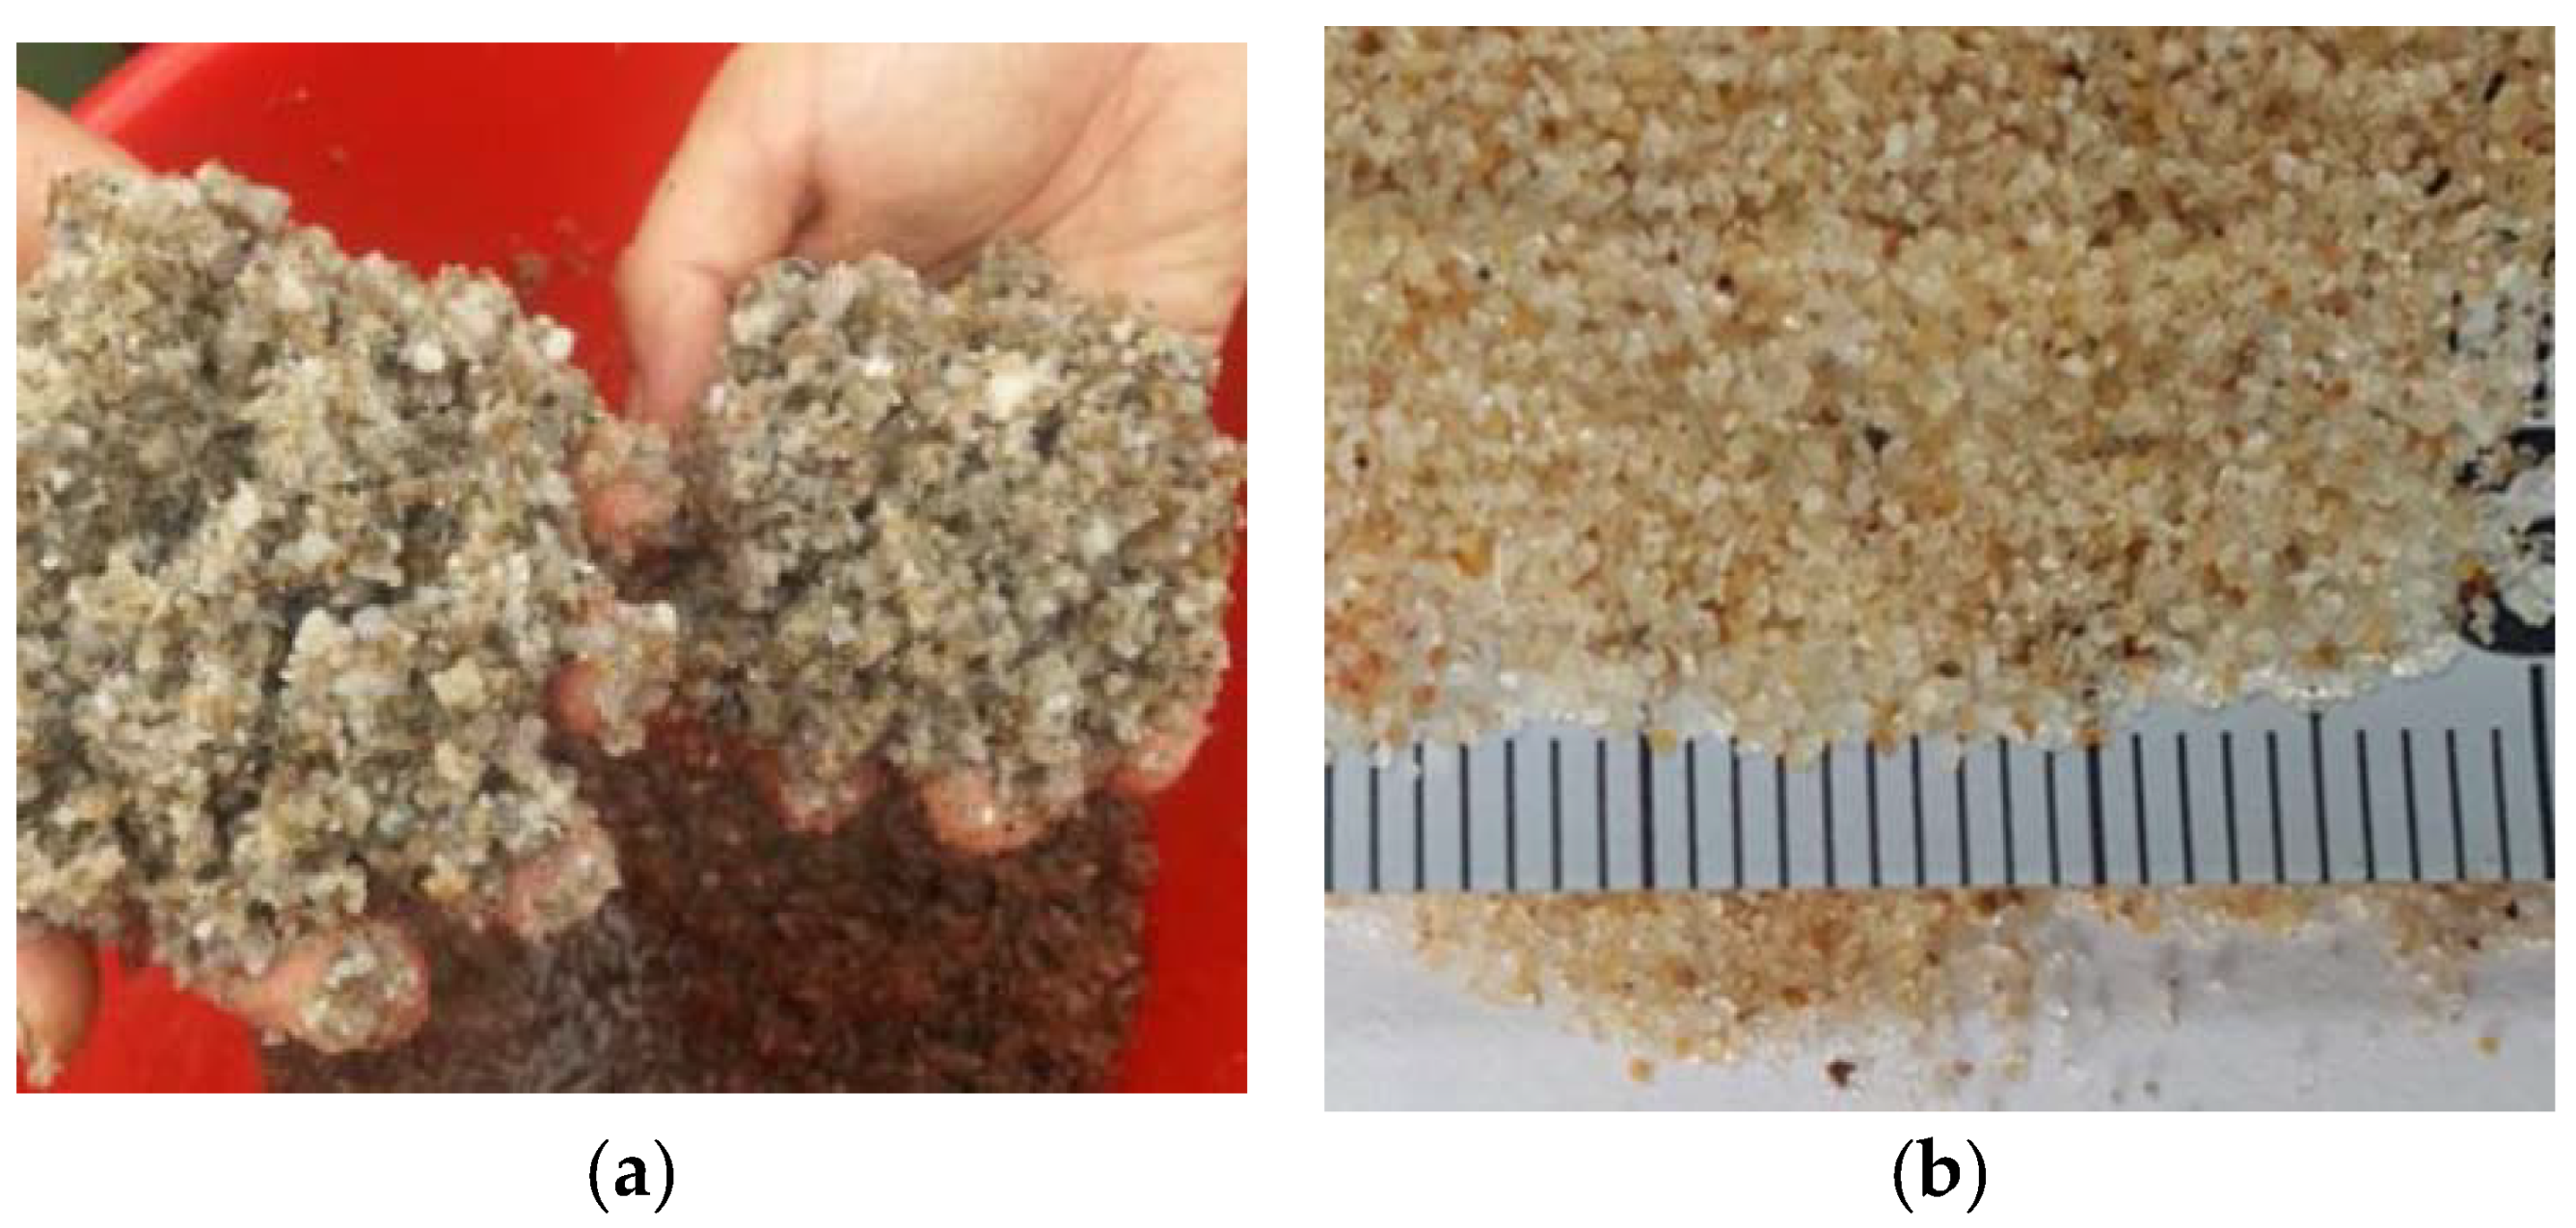
The dredged soil as an available resource is widely used for ecological restoration and land reclamation. In consideration of the local soil characteristics, the dredged sand was used for dumping. The dredged sediment before and after sieving is shown in Figure 6. The dumping materials were mainly composed of medium-coarse sand particles and the percentage of suspended sediment was limited. The amount of sediment dumped in Position A, B, and C was 10,000 m3, 7000 m3 in Position D, and 3000 m3 in Position E, respectively. For each test, the dumping process continued 6~12 min. After each process, the observations lasted 0.5−1.0 hour until the mounds were stable. During the dumping process, although some of the sediment was suspended in the water column and exhibited convection and diffusion behaviors, it was regarded that the loss of suspended sediment accounted for ~2%, which was very little and could be neglected.
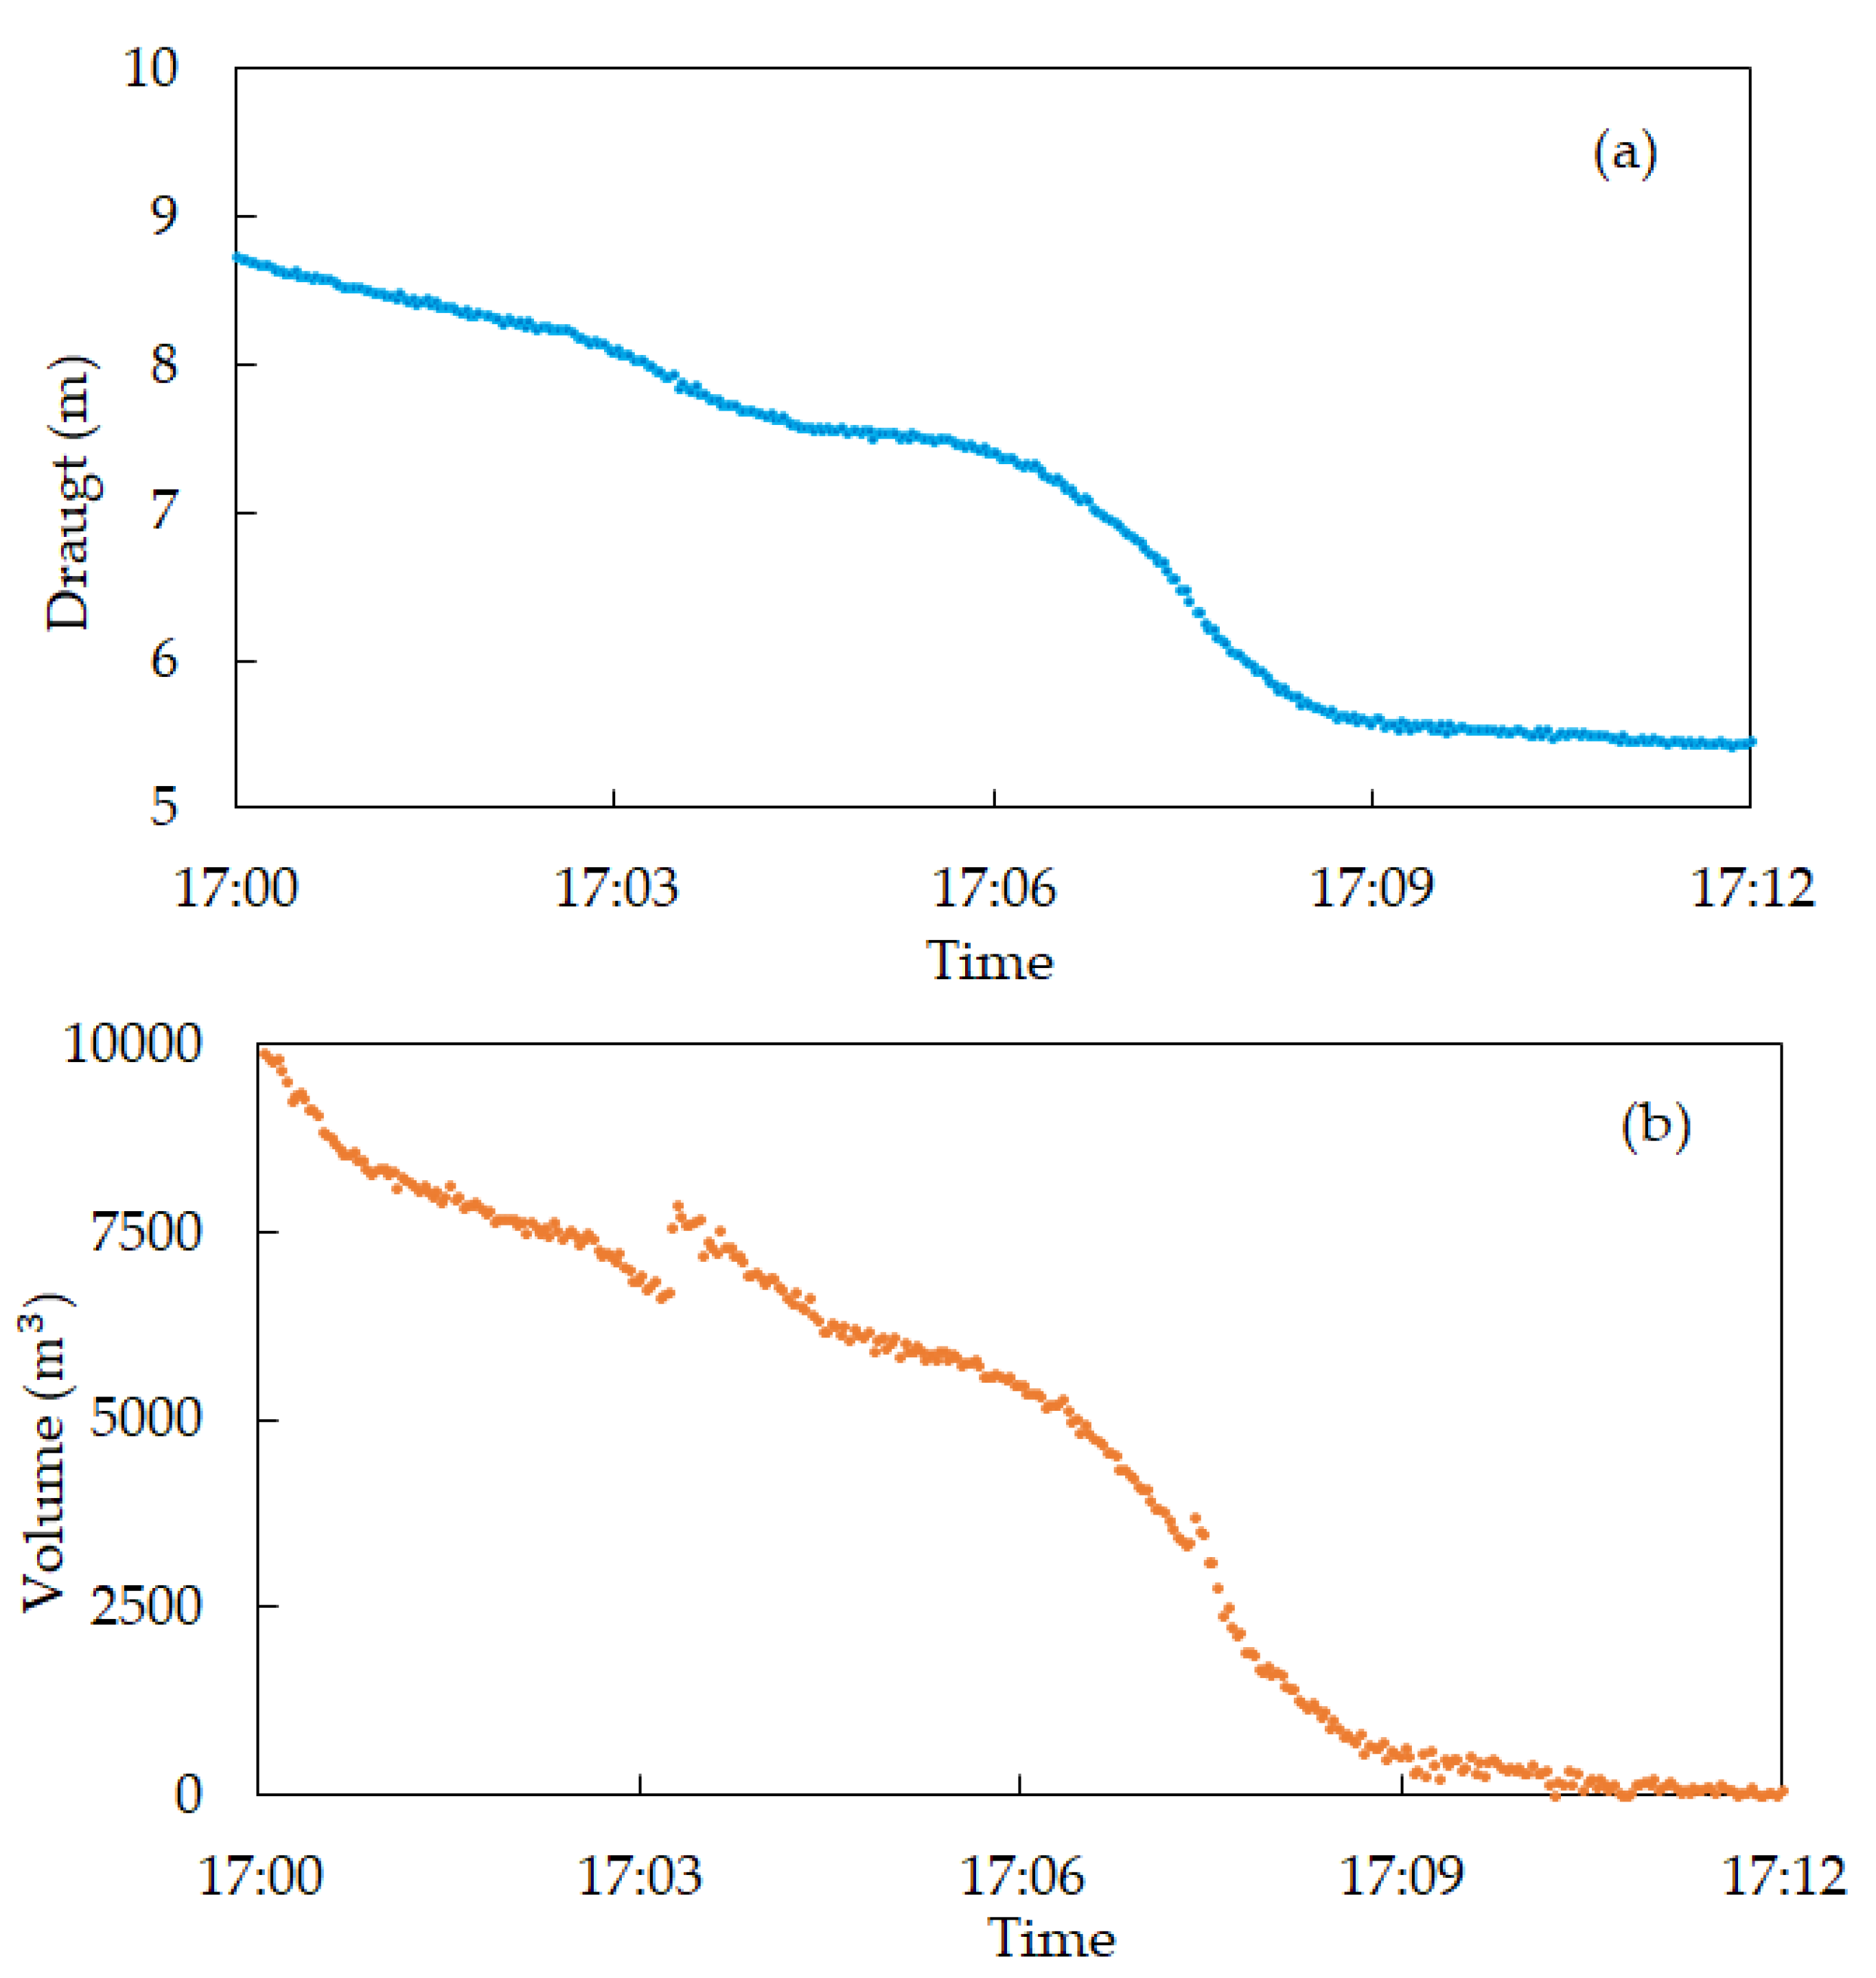
In the process of dumping, the draught of the ship changed with the volume of sediment left in the hopper. Figure 7 presents the changes of draught and sediment volume over time. It shows the process continued 12 min to dump a volume of 10,000 m3 sediment. The ship rose basically at a constant speed with the gradual release of sediment. The draught was 8.7 m in the beginning and ended with 5.5 m, having a change of 3.2 m.
Multi-beam depth sweeping equipment was used to map the topography before and after the dumping. The topographic survey range was a rectangular area centered on the bottom outlet of the dredger, 500 m in length and 200 m in width. The obtained bathymetric data were processed by Surfer Package (Golden Software Ltd., Colorado, USA).
For each test, a 200 × 150 m digital elevation model (DEM) was established. With regard to the sediment deposition profile, it was micro-topography and the analysis needed relatively high accuracy. The triangle surface (TIN) produced directly by the elevation point was not of high precision. In this paper, the grid surface was firstly produced by linear interpolation of elevation points, and with the produced grid surface, the contour profiles were then generated. Finally, the DEM generated with the TIN method from the contour line was consistent with the actual topography [18]. The DEM had a highly precise grid with 1 m node spacing in the N-S and E-W directions, in which the elevation data in each grid was linearly averaged. The vertical resolution amounted to 5−10 cm in each case. Before and after sediment dumping, the topography changes were quantified by comparing the depth values of two identical bathymetric elements.
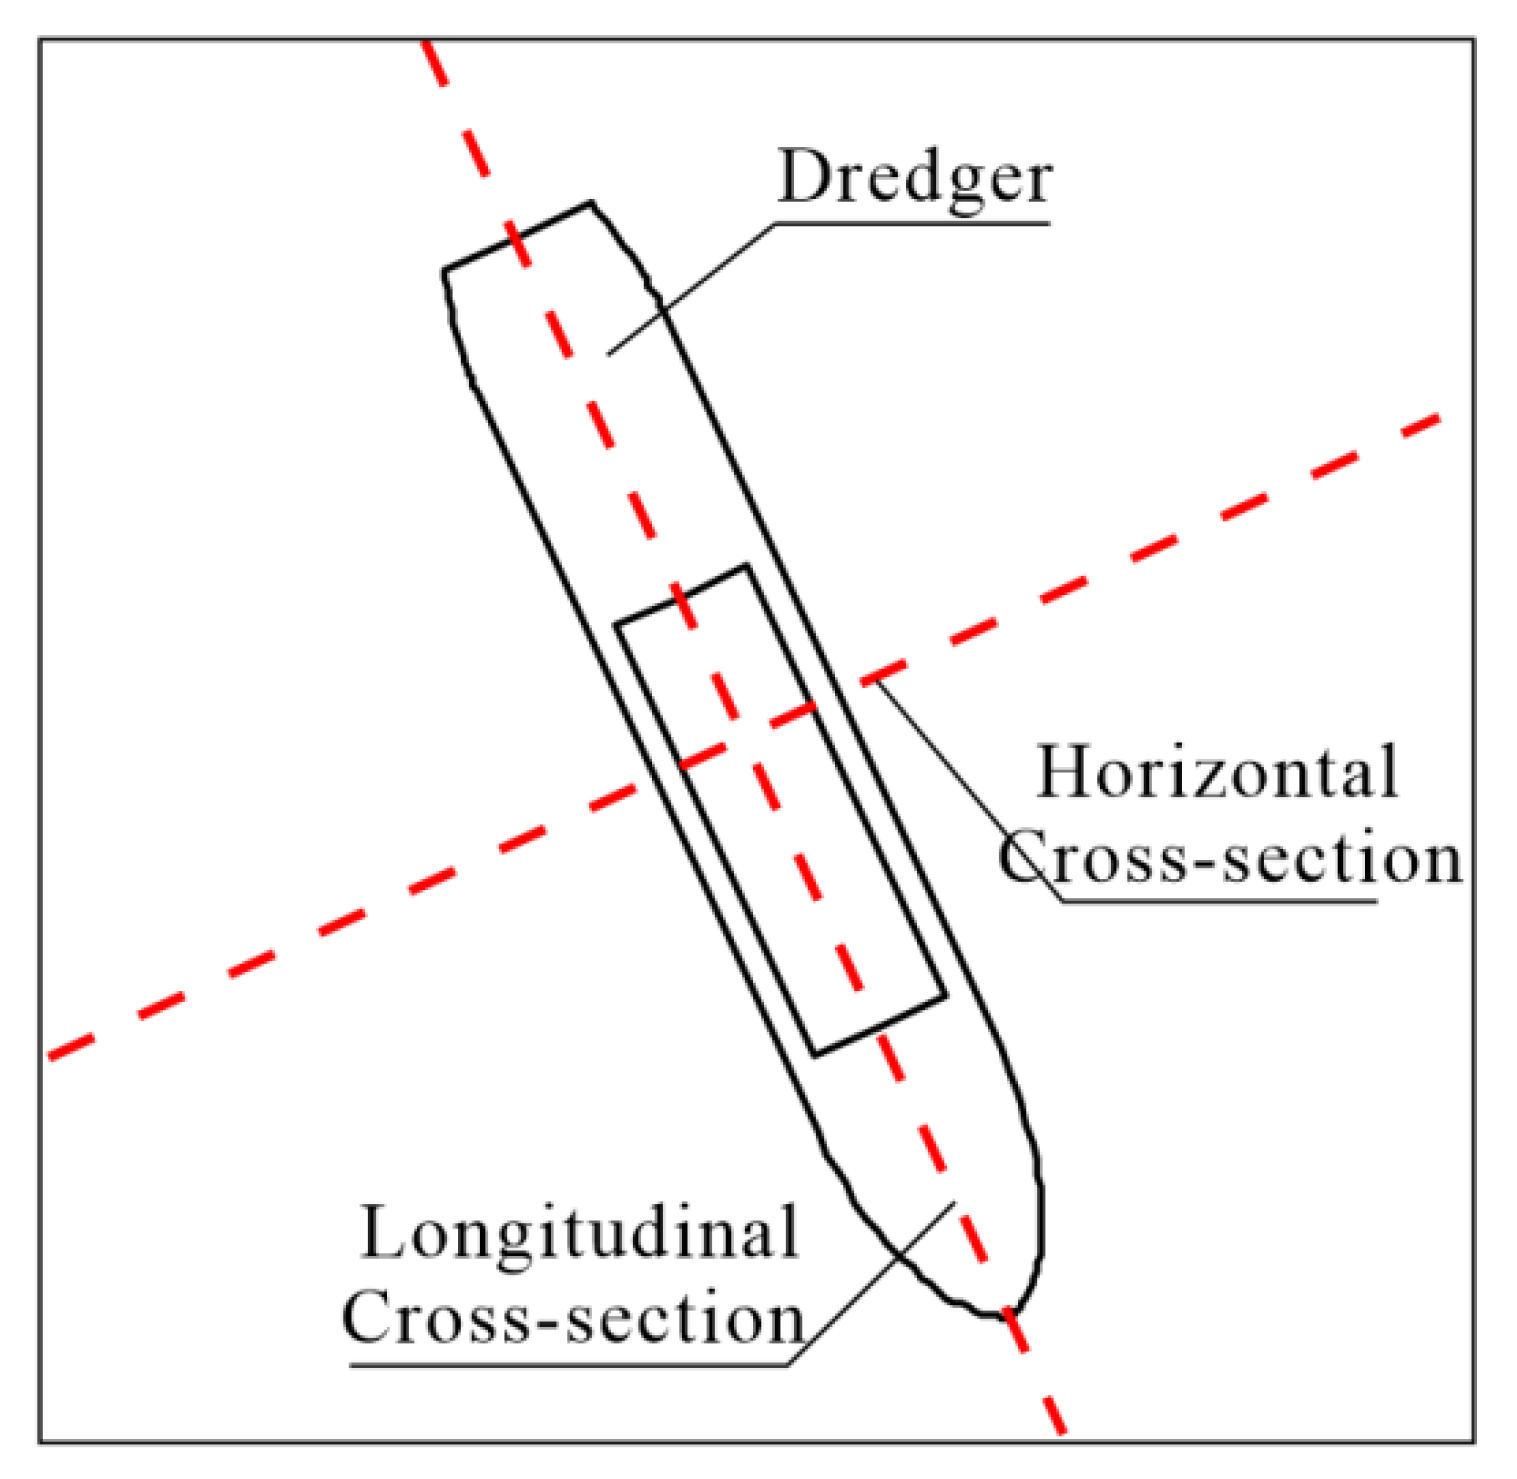
To simplify the analysis, two typical cross-sections, i.e., horizontal and longitudinal cross-sections, were defined for each DEM. They were parallel to the ship’s driving direction and perpendicular to its normal direction, respectively, as marked in Figure 8. To classify the subaqueous sediment mounds, this study referred to the descriptive method of dune morphology as proposed by Al-Masrahy and Montney [19]. Three-dimensional morphology and the following shape parameters were measured and calculated: mound height H (m), water depth h (m), width along with horizontal direction a (m), width along longitudinal direction b (m), slope S, symmetry index of sediment mounds SI (calculated by a/b). By comparing the cross-sections of each DEM, the morphological changes and the related influence factors were quantitatively achieved.
4. Results and Discussion
4.1. Flow Features during the Tests
As aforementioned, influenced by the external breakwater, the flow motion in the water-way was relatively weak. At the study site, to examine the flow features subjected to sediment dumping, Figure 9a,b showcases the flow velocity magnitude (m/s) and direction θ (°) for position A, where 10,000 m3 sediment was dumped into the water in 10 mins (16:20–16:30). Figure 9c displays the corresponding vertical flow velocity before and after the test. The other four cases display similar patterns. It was observed in Figure 9a,b that the before and after the test was <0.15 m/s and induced by the tides, the range of θ was between 180°–360°; during the dumping, the was relatively large, with a peak value of 0.22 m/s and the θ was between 0°–180°, implying that the sediment stirred the flow a lot in both magnitude and direction.
In the vertical direction, Figure 9c shows that before and after the test, the flow velocity exhibited a general large value on the surface and small value at the bottom. However, during the dumping, no obvious regular flow features were observed in terms of velocity at different hi/h. A large amount of sediment was released in a short time, causing strong turbulence in the surrounding water column and, therefore, generating a vertical flow movement. The finding was also true in channel flow without tides and was evidenced by Bhuiyan et al. [20]. The flow and sediment mixed and interacted with each other, presenting irregular patterns.
4.2. Morphological Characteristics of One-Time Dumping
Limited by the experimental conditions, the tests were performed by using the clearance of the dredger. The morphology survey was mainly carried out under different water depth and dumping quantity conditions. Based on the real-time recording of the water depth, tests were performed in three different depths, i.e., 14 m, 15 m and 16 m, and the ultimately resulting mounds patterns were examined. Three locations with similar water depths (h = 15 m) were selected to test the influence of throwing quantities. To distinguish them, the dumping volumes were 10,000 m3, 7000 m3 and 3000 m3, respectively.
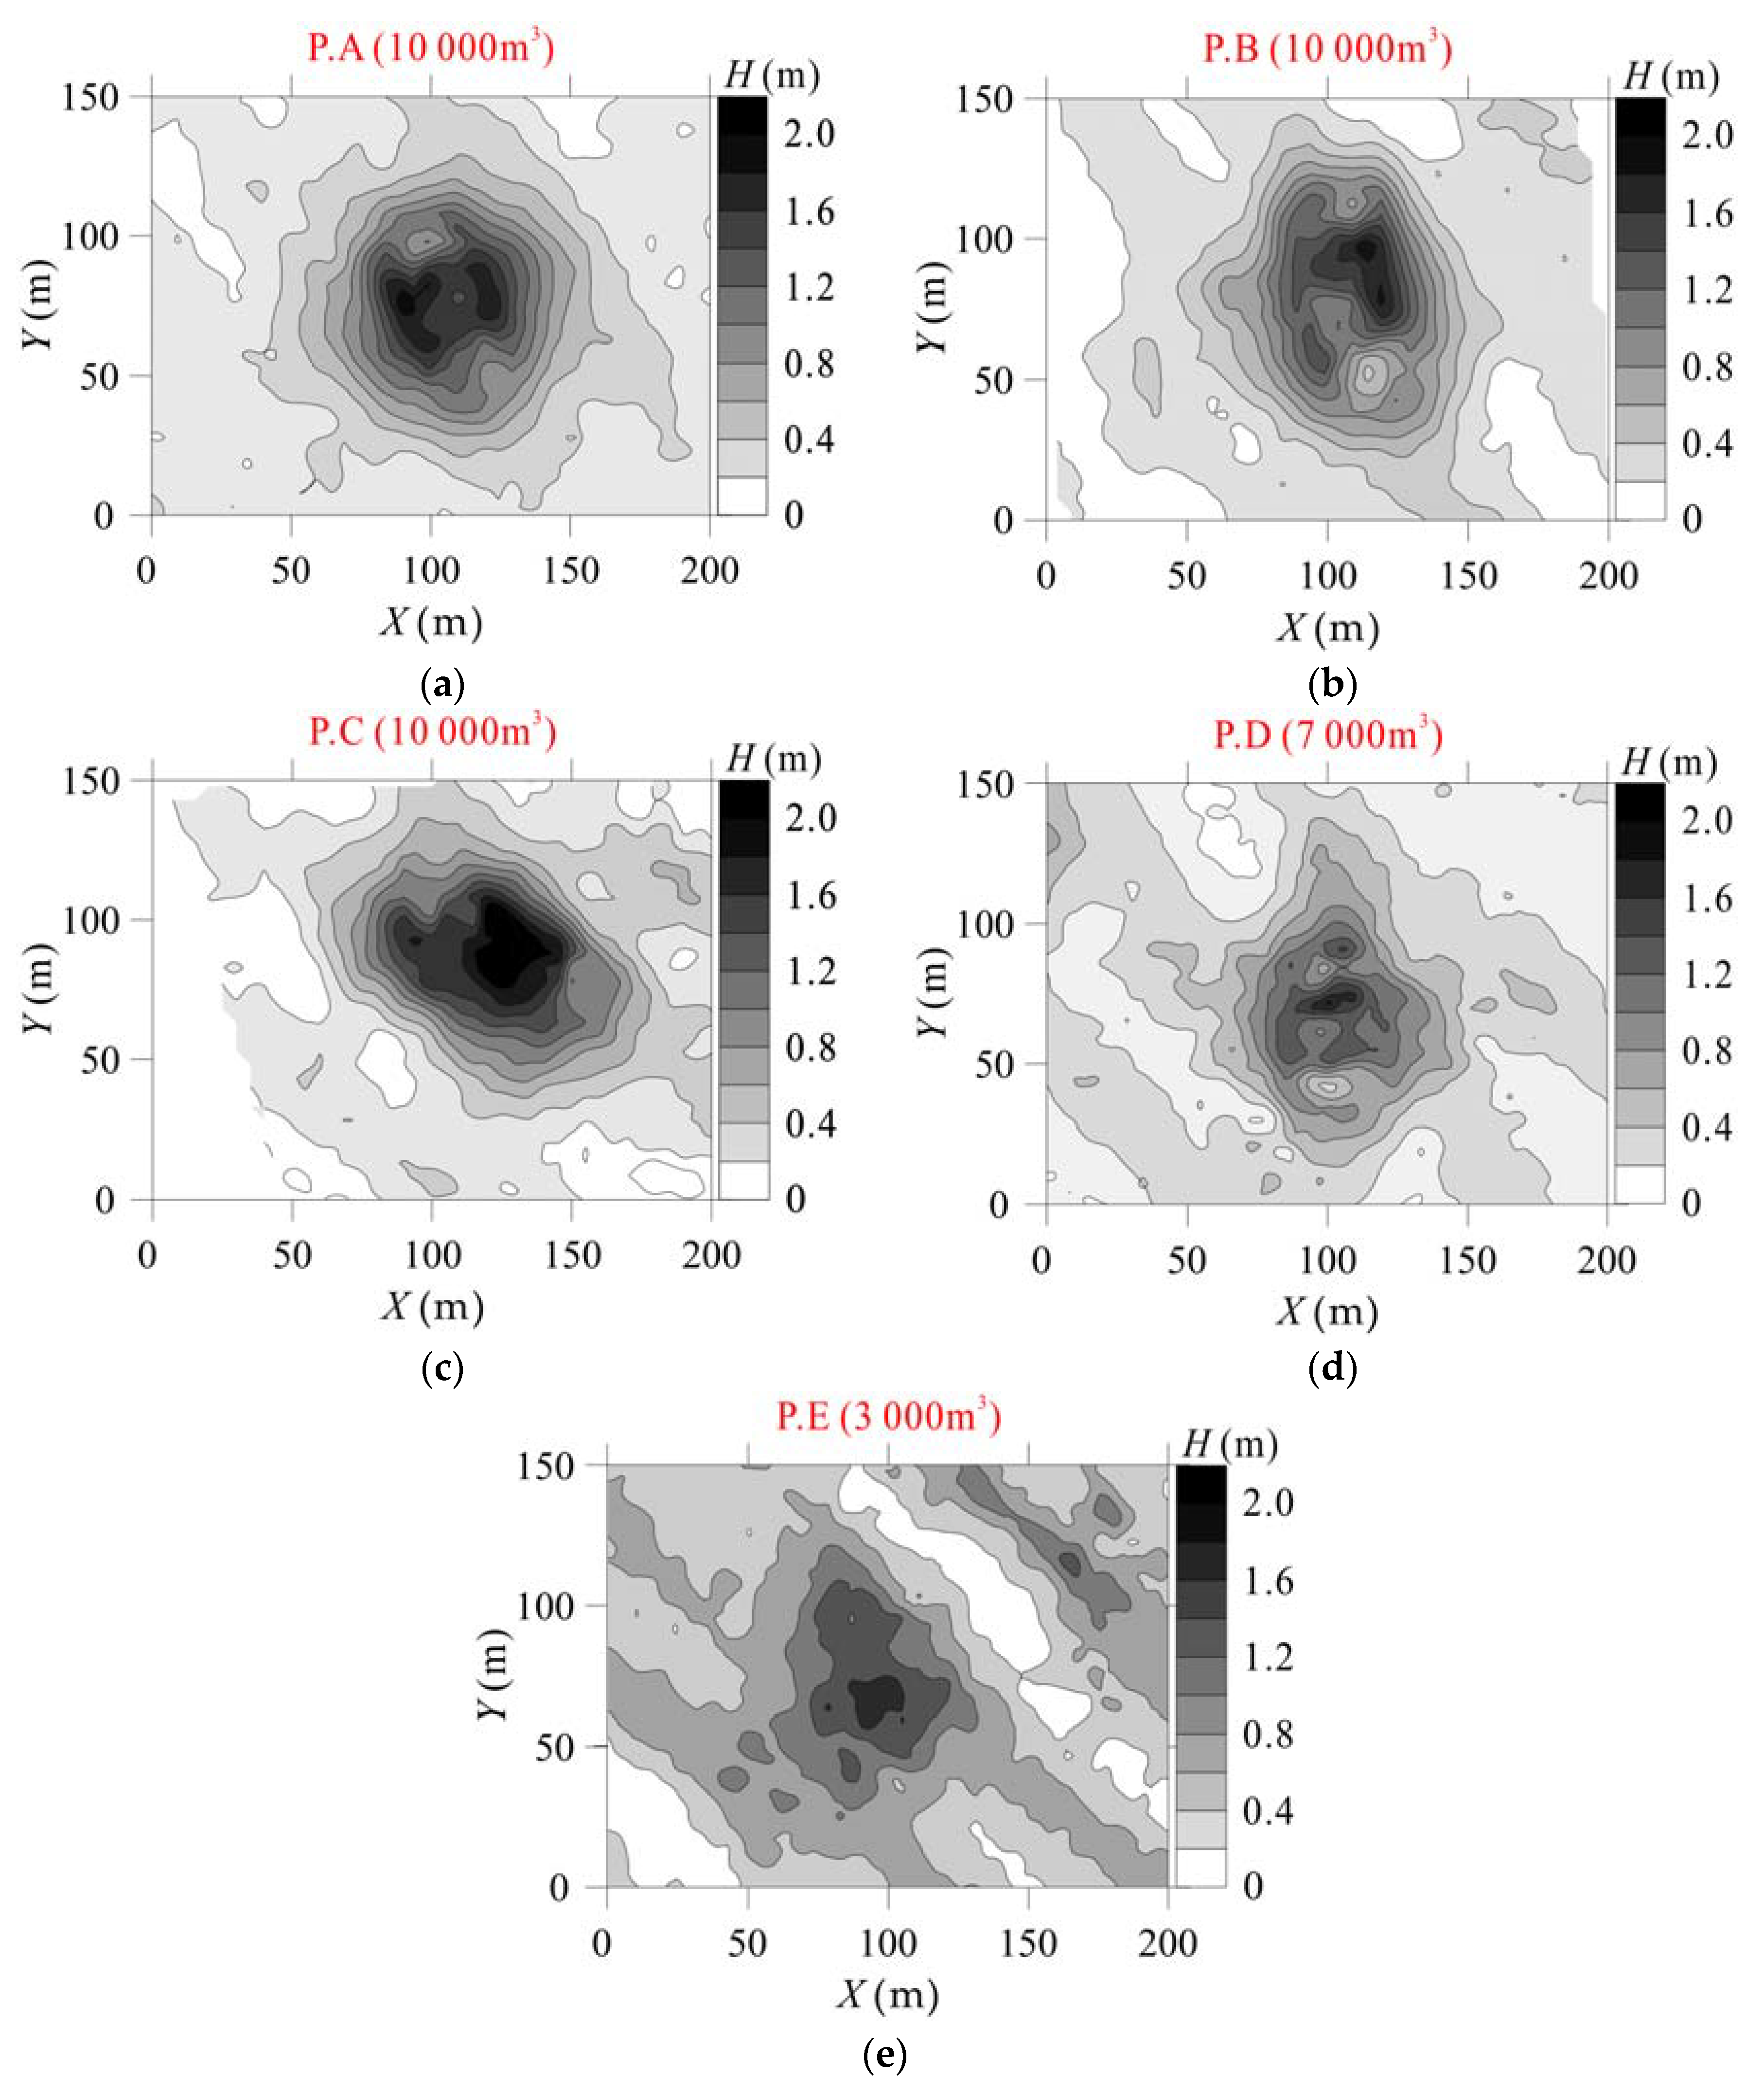
The shape of subaqueous sediment mounds formed by hopper dredge discharges at five positions is shown in Figure 10. The contour map displays that the overall shape of the mounds was similar, less affected by the amount of discharged sediment; the mounds were nearly symmetrical in space and had certain randomness in shape; also, the basic geometric characteristics of the mounds had relatively good repeatability. Generally, it appeared as multiple concentric circles. With different amounts of sediment dumped into the water column, the bottom diameter of the generating mounds was about 100–150 m; the slope S, as an indicator of topographic fluctuation, was in a range of 0.015–0.044; the height of the mound H is about 1–2 m. At position C, where the water depth was slightly shallow, the shape of the mound was similar to that at points A and B, but it was much thinner and taller.
Subjected to the same hydrological conditions, the top of the mounds did not show a similar shape. It was divided into two forms; one was a similar cone, the other was a volcanic cone. For the latter, its center was an inverted cone and the mound on the local top seemed to be pounded during the sediment dumping. The shape was distinct from the results observed by Rajaratnam et al. (2006) and Bhuiyan et al. in the experimental flume [20,21]. The shape of the underwater mound was basically the standard cone, and there was no groove on the top of the cone. In their experiments, the test water depth was fixed with a certain value, and the amount of dumping was not enough, resulting in no volcanic cone. To summarize, the shape of the generating mound resulted from sediment dumping, varied with the water depth and the dumped amount. When the tide was relatively weak, the morphology features were similar to those in channels without tidal and wave effect.
To examine the effect of dumped sediment volume and water depth h on the resulting morphology, Table 3 displays the measured morphological parameters at the five test positions. There was a clear positive correlation between the dumped volume and the height of the resulting mound. At a given dumped volume (10,000 m3), the larger h corresponded to a smaller S. With the same water depth (h = 15 m), the more sediment was dumped, the larger S was obtained. The average SI of each resulting mound was in the vicinity of 1.0.
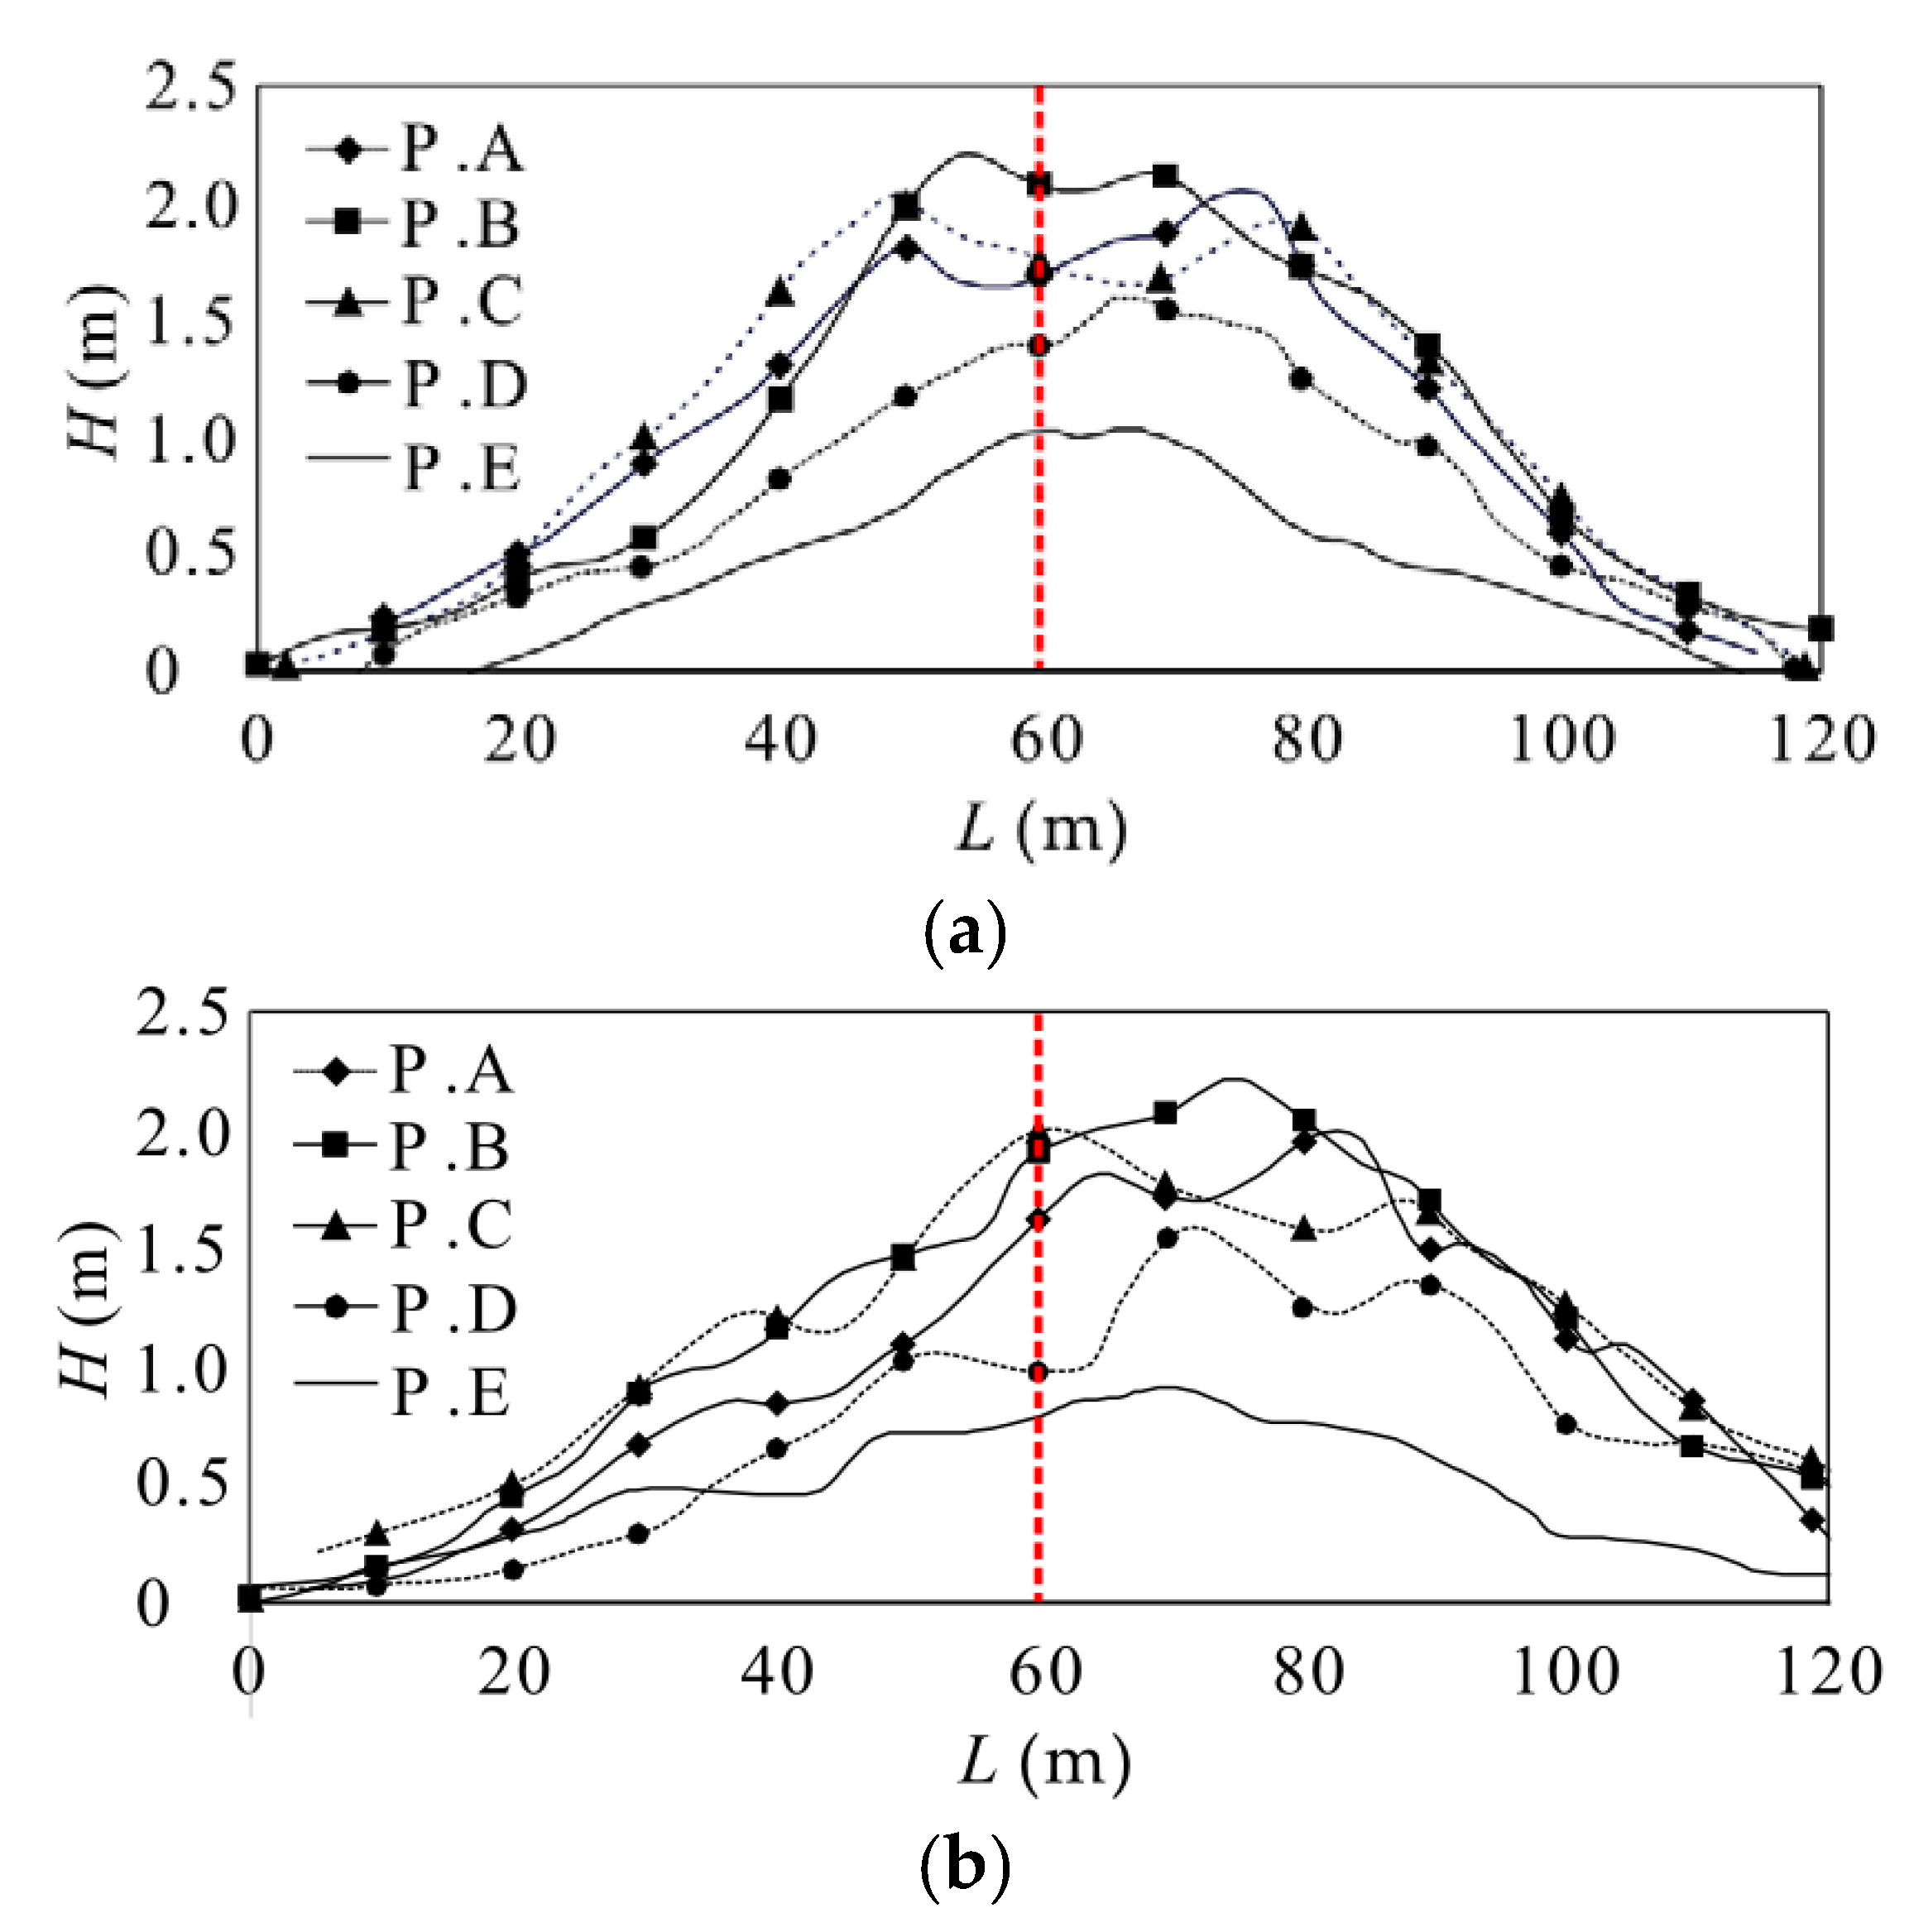
To further illustrate the features, in horizontal direction, Figure 11a presents the corresponding cross-sectional mound profiles. With different dumped volumes, the mounds covered a range of 90−140 m and differed a lot in height. Relative symmetrical distributions were also observed. Figure 11b shows the cross-sectional mound profiles in longitudinal direction, which was also consistent with the residual ebb tide. The covered areas in this direction were larger than those in the horizontal direction and asymmetrical distributions, as a result, were formed. It was illustrated that both the amount of dumped sediment and the water depth dominated the overall shape of the formed mound, and the ebb current caused the local migration of the mound shape, although the ebb velocity was comparatively low. Also shown in Figure 11, the volcanic cone characteristics were observed at the three positions (P.A, P.B and P.C) with the dumped volume of 10,000 m3; the other two positions (P.D and P.E) with smaller dumped volumes exhibited roughly conical features, without grooves on the top.
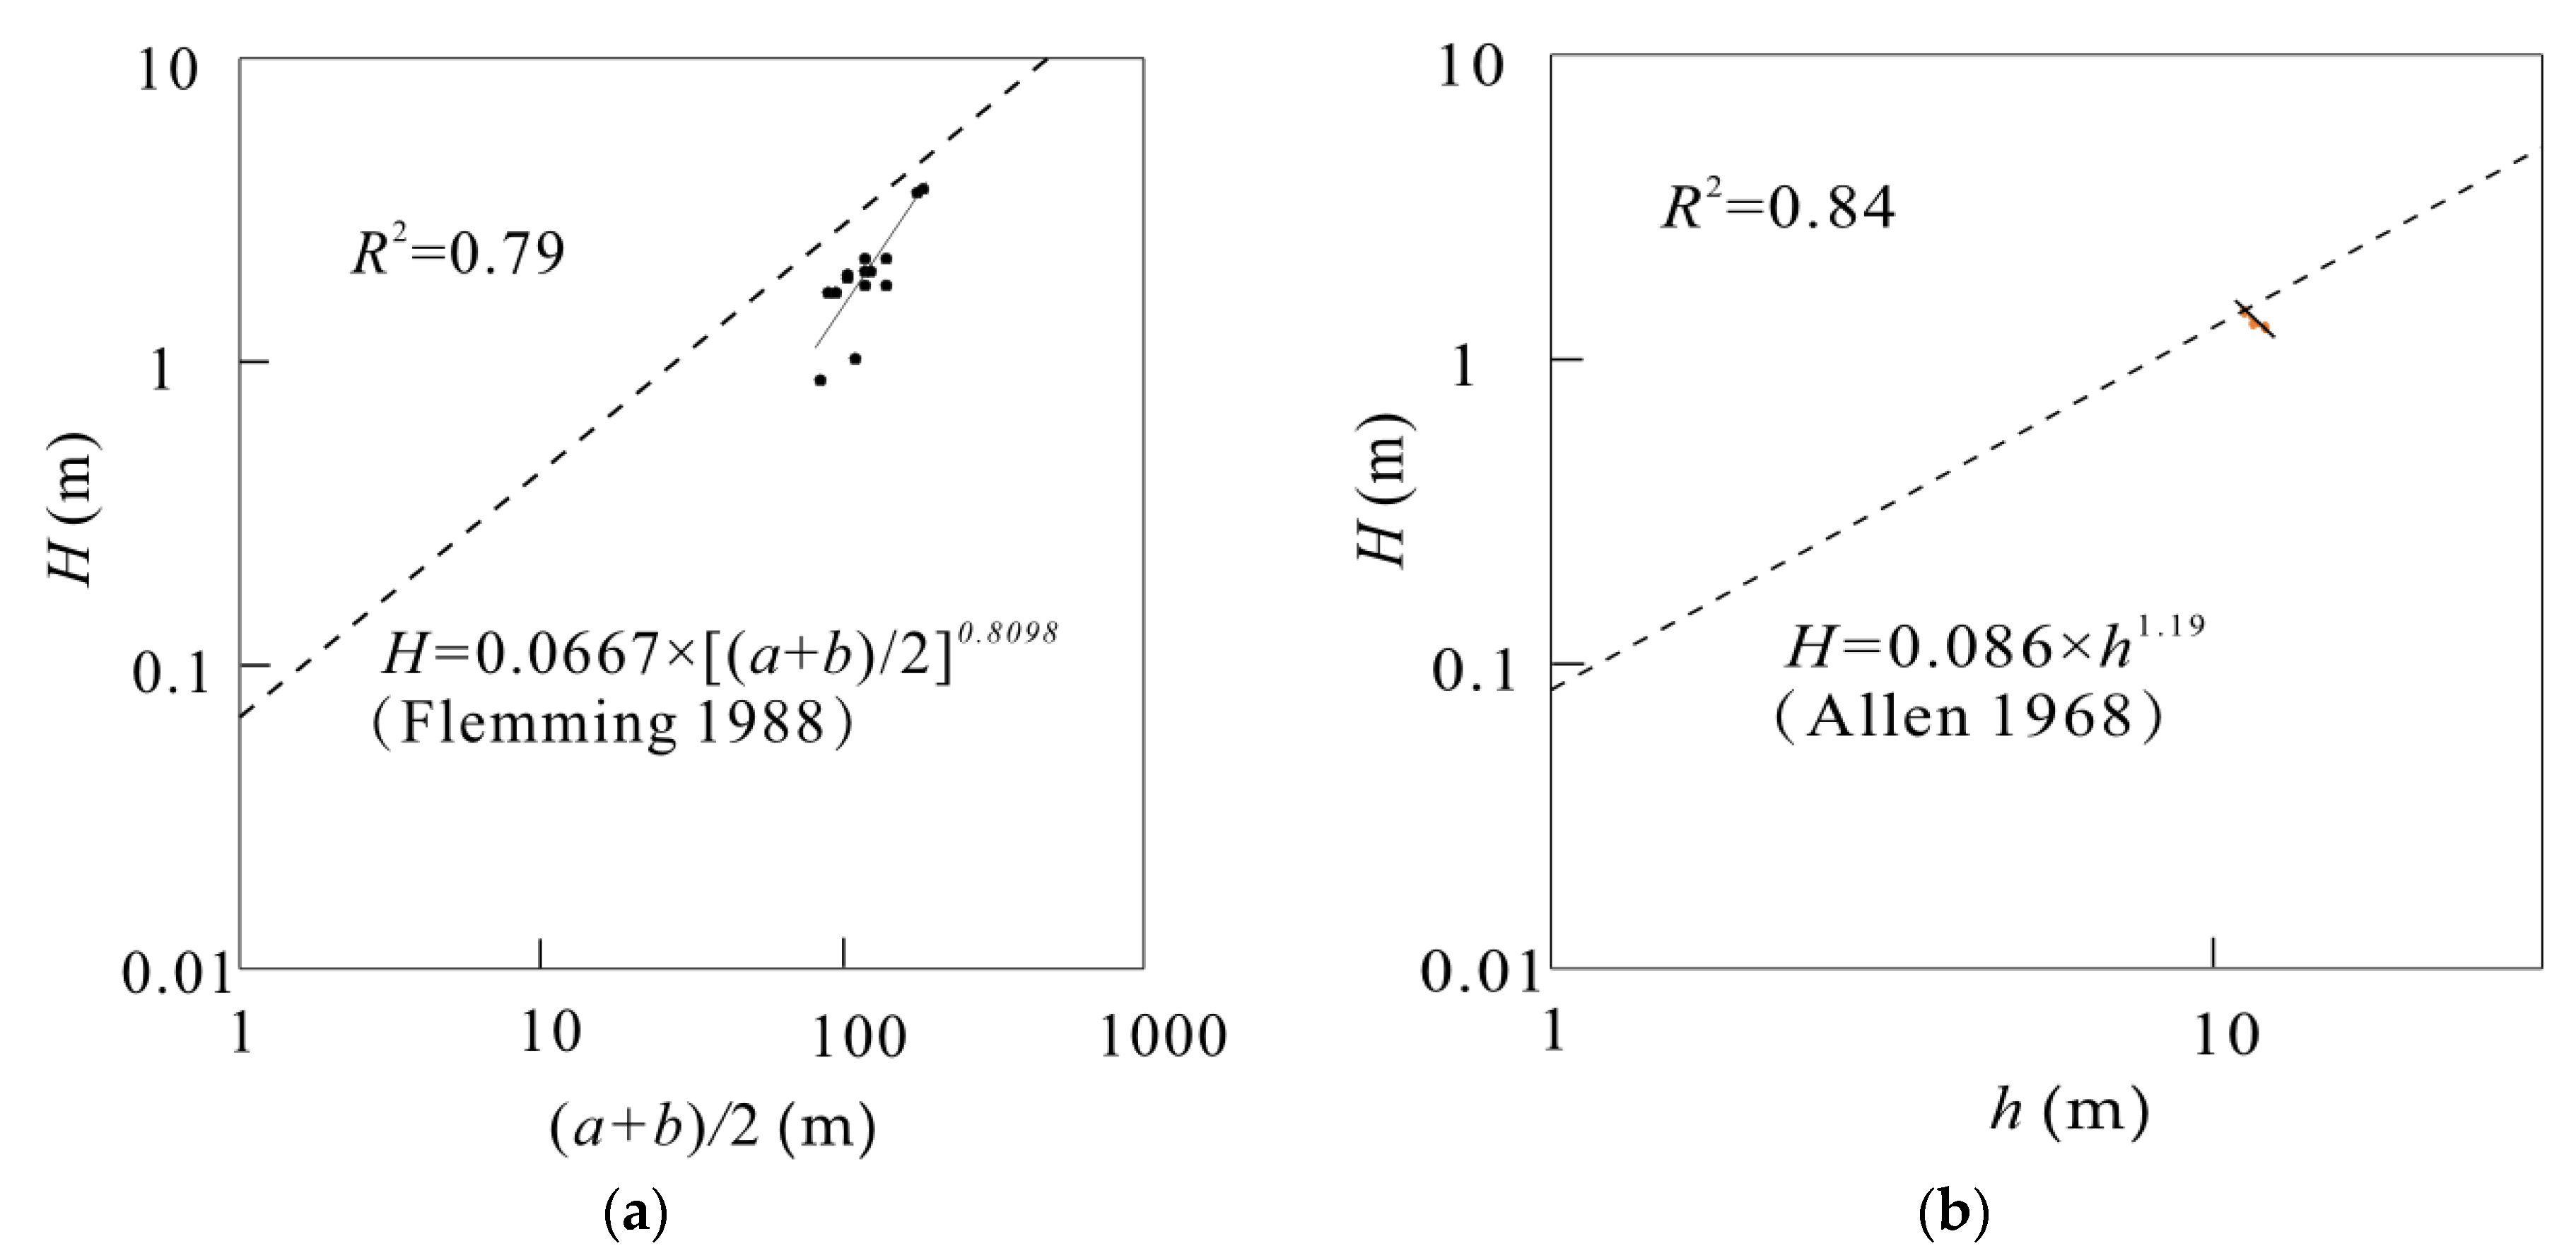
There exist certain relationships between H and (a + b)/2, H and h. To look into the relationship in a quantitative way, the coefficient R2 is adopted to evaluate the fitting degree of the trend line. The R2 measures the overall fitting degree of the regression equation, expressing the overall relationship between dependent variables and all independent variables. Its numerical value reflects the fitting degree between the estimated value of the trend line and the corresponding actual data. A higher R2 value (close to 1.0) represents the good reliability of the trend line. The expression of R2 reads as:
where, , represent the mean value and standard deviation of x; , represent the mean value and standard deviation of y; xk and yk represent the measured values, respectively.
Figure 12 plots the relationships in logarithmic coordinate and compares with the findings from Flemming [22] and Allen [23], respectively. Figure 12a shows there was a good linear relationship between the H and (a + b)/2, and the R2 = 0.79. The values obtained in this test were slightly lower than those in Flemming’s experiments [22]. This is mainly because the relationship described by Flemming reflected the global average trend; it was not entirely appropriate for the local specific scenarios. Allen [23] as a pioneer firstly recorded the dependence of H on h in 1968 and he also proved that the H was significantly affected by the h. Figure 12b presents a good correlation between the H and h, and the R2 = 0.84. However, it is not the same as the relationship proposed by Allen [19]. The reason is that, in the coastal environment, the observed shapes of the mounds were undergoing a dynamic adjustment subjected to variation of flow currents. The studies of Wewetzer and Duck [24] also showed that the relationship proposed by Allen was not applicable in all cases, especially in the natural environment with complex hydrological conditions. In the field tests, there were too many uncertain factors and the measurements were challenging, it was not easy to characterize the shape and size of underwater accumulations strictly.
4.3. Morphological Characteristics of Second Dumping
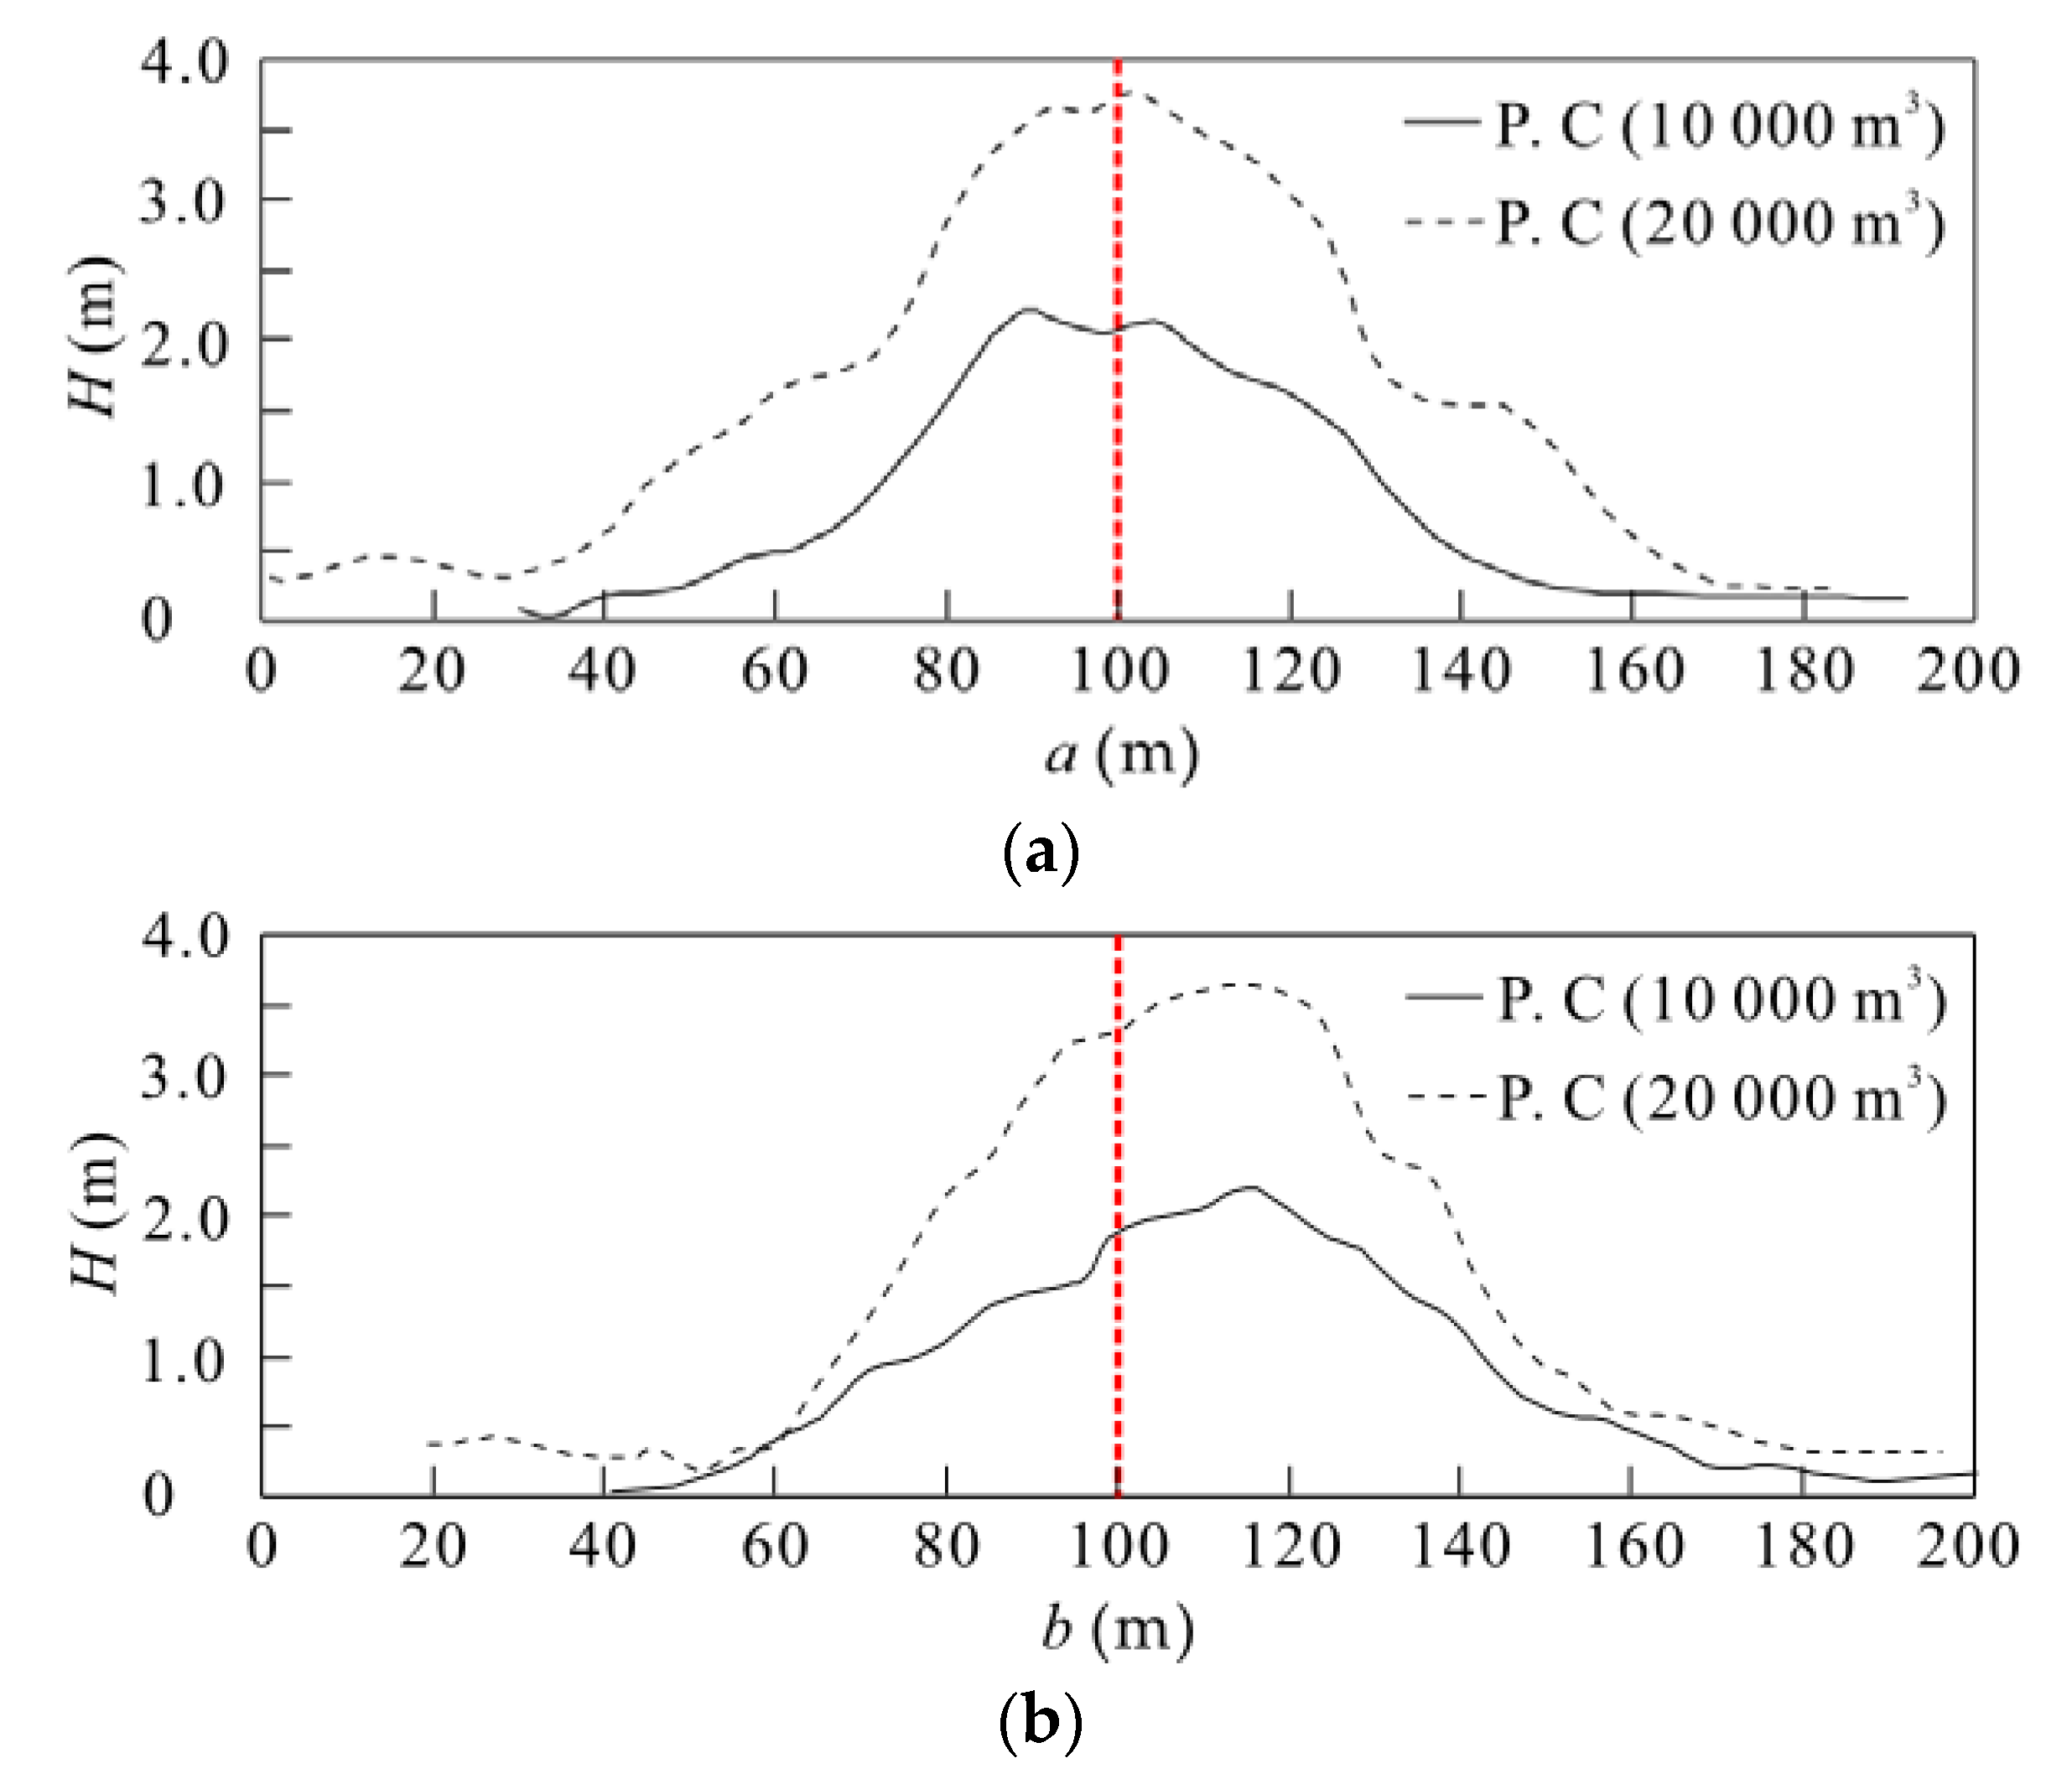
The morphological feature of second placement over the existing mound is also of great concern in practical. To test the cumulative effect, P.C. was selected to carry out the experiment. On the basis of 10,000 m3 sediment, an additional 10,000 m3 sediment was placed to the site in 12 mins. The resulting morphology was compared with the original one as shown in Figure 13. The contour map shows that the overall morphology of the mound did not change a lot, but it had a significant spreading towards the surrounding area. The top of the mound also presented a volcanic cone pit. Comparing with the original one, the depth of the pit is deeper and the scope is more compacted, implying the impact force induced by the sediment dumping on the top is larger and more concentrated.
Figure 14 plots the cross-sectional profiles along with the horizontal and longitudinal directions. It shows the “repairing” effect of second placement over the existing mound. Compared with the original profile, the H changed from 2.0 to 3.6 m and the covered area extended from 9500 m2 to 16,000 m2, a result of the additional sediment dumping; the slope S became steeper in both cross-sections; the change of SI was small, implying that the symmetry of the mound shape did not change a lot.
4.4. Long-Term Morphology of the Mounds
To assess the viability of repeat dumping in future, the long-term development of morphology, e.g., inter-seasonally or annually, is also of great concern for the maintenance of dredging projects. Although the measurements were challenging to make, investigations after the sediment dumped for half-year, were made again to track the morphological changes. In terms of the H and the (a + b)/2 at five positions, the initial observations and the measured results after the half-year are displayed in Table 4.
The results show that the H decreased and the (a + b)/2 increased as the time elapses. It is understandable that the generating mounds were exposed to settlement in the vertical direction and enlargement in the horizontal direction. The trend was relatively slow and exhibited in a unpronounced manner after a certain period.
According to the measurements, it is recommended to use the medium-coarse sand particles as a priority of the dumping materials, especially in a coastal environment subjected to tides and waves. This is because they have comparatively fast settling speed, large repose angle and satisfied dredging performance. However, the fast settling speed also leads to some uneven stacking thickness. It is thus essential to keep stable speed to discharge the particles into the water column. Additionally, it is advantageous to dump the sediment on the occasion of neap tides, so as to minimize the particle convections and diffusions.
5. Conclusions
This paper investigated the formation process and final shape of under-water sediment mounds formed by hopper-dredged discharges in the coastal environment. Hydrological observations and field experiments were carried out to help understand the flow behaviors and the resulting morphology features. The main conclusions were summarized as follows:
- (1)
- The sediment, which was dumped into water, stirred the flow a lot in both magnitude and direction. During the dumping, a large amount of sediment was released in a short time, leading to strong turbulence in the surrounding water column and, therefore, generating a vertical flow movement. The flow and sediment mixed and interacted with each other, presenting irregularly instant patterns.
- (2)
- The formed mounds were nearly symmetrical in space and had certain randomness in shape. Cone and volcanic cone mound tops were observed. The tidal current, although weak in strength, had an effect on shaping the profiles. The height and covered area of the mounds were proportional to the dumped amount, and they were also affected by the water depth. There existed certain relationships among the mound height, covered area and water depth.
- (3)
- The results of superimposed tests showed that the second placement over the existing mound resulted in a similar overall shape, but there was obvious movement around the mound; additional discharged volumes at the same location mainly increased the height of the mound.
During the field tests in the marine area, there were too many uncertain factors and it was challenging to perform the observations and measurements. In a way, the combination of the hydrological observations and experimental tests revealed the flow behaviors and the resulting morphology features of sediment dumping, providing general insights to similar situations.
Author Contributions
W.D. (Wei Ding), C.L. and Q.X. conceptualized and formulated the research and were responsible for the field measurements and results analyses, with participation and assistance from X.L. and W.D. (Wenhong Dai) The original manuscript was written by W.D. (Wei Ding) and Q.X., with comments and modifications from W.D. (Wenhong Dai), C.L. and X.L. All authors have read and agreed to the published version of the manuscript.
Funding
The research is funded by the National Key R&D Program of China (No.2016YFC0402501), the National Natural Science Foundation of China (51479071), the “111 Project” (B17015 and B12032) and the Jiangsu Colleges and Universities Academic Building Engineering Project (YS11001). Q.X. is funded in a form of four-year Ph.D. scholarship by the Chinese Scholarship Council (CSC) and the Swedish StandUp for Energy project.
Acknowledgments
The authors would like to thank CHEC Dredging Co. Ltd. for assistance with the field measurements and investigations. Q.X thanks David R. Fuhrman at Denmark Technical University for the host and assistance during the visit as a guest researcher. The two anonymous reviewers are acknowledged for their suggestions that have led to improvements in the quality of the article.
Conflicts of Interest
All authors declare no conflict of interest.
References
- Liu, J.; Zhao, D.Z.; Yuan, Y.H. Investigation and Study on Comprehensive Utilization of Dredged Soil. 8th National Academic Seminar on Basic Theories of Sediment; Hohai University Press: Nanjing, China, 2011; pp. 656–660. [Google Scholar]
- Wang, D.; Fan, Q.J. Beneficial use of dredged materials in Japanese ports and typical case study. Port Waterw. Eng. 2009, 12, 6–9. [Google Scholar]
- Nakamura, Y. Current status of subaqueous borrow pits and their restoration in Japan. J. Adv. Mar. Sci. Technol. Soc. 2009, 12, 43–50. [Google Scholar]
- Fu, G.; Zhao, D.Z.; Cheng, H.F. Comparison and analysis of comprehensive utilization of dredged materials at home and abroad. Port Waterw. Eng. 2011, 3, 90–96. [Google Scholar]
- Wang, H.B.; Tang, C.; Lou, F.; Qiao, F. Disposal scheme of dredged material in Yangtze Estuary deepwater navigation channel after 2020. China Harb. Eng. 2017, 10, 29–33. [Google Scholar]
- Massie, W.W. Coastal Engineering: Vol II. Harbor and Beach, 1st ed.; Tu Delft: Delft, The Netherlands, 1976. [Google Scholar]
- Foster, G.A.; Healy, T.R.; De Lange, W.P. Presaging beach renourishment from a nearshore dredge dump mound, Mt. Maunganui beach, New Zealand. J. Coast. Res. 1996, 12, 395–405. [Google Scholar]
- Li, Z.S.; Chen, H.S.; Cao, G.X. Study on sediment movement in Huangbaizui mud-dumping area of Dalian port with radioactive tracer sand. J. Coastal Res. 1990, 7, 10–14. [Google Scholar]
- Wu, J.X.; Zhang, S.Y.; Ren, L.F. Suspended sediment concentration profiles and dispersion patterns under sediment disposal conditions in the Changjiang river estuary. Oceanol. Et Limnol. Sin. 2003, 1, 83–93. [Google Scholar]
- Mathew, J.; Healy, T.R.; Lange, W.P.D. Monitoring of a large inner shelf dump mound offshore Tauranga, New Zealand. In Proceedings of the Combined Australasian Coastal Engineering & Ports Conference, Christchurch, New Zealand, 7–11 September 1997. [Google Scholar]
- Gu, J.; Huang, J.; Li, Z.W. Experimental study on dispersion of instantaneous discharging sediment cloud in cross-flow. Adv. Water Sci. 2008, 4, 83–93. [Google Scholar]
- Chen, D.C.; Tang, Y.D.; Yu, Z.Y. Dispersion of waste mud in dumping ground of Lianyungang harbour and its effects on siltation in outer navigable channel. J. East. China Norm. Univ. (Nat. Sci.) 1998, 2, 69–78. [Google Scholar]
- Pupienis, D.; Zilinskas, G. Specific features of morphodynamic processes in the dumps of the Lithuanian offshore. Baltic 2005, 4, 29–37. [Google Scholar]
- Du Four, I.; Van Lancker, V.R.M. Physical impact of dredged material disposal sites and their recovery after cessation of dumping: A case study in the Belgian coastal zone. Int. Acad. Bus. Econ. 2007, 4, 780–781. [Google Scholar]
- Wienberg, C.; Dannenberg, J.; Hebbeln, D. The fate of dumped sediments monitored by a high-resolution multibeam echosounder system, Weser Estuary, German Bight. Geo-Mar. Lett. 2004, 1, 22–31. [Google Scholar] [CrossRef]
- Wienberg, C.; Hebbeln, D. Impact of dumped sediments on subaqueous dunes, outer Weser Estuary, German Bight, southeastern North Sea. Geo-Mar. Lett. 2005, 25, 43–53. [Google Scholar] [CrossRef]
- Gao, F.; Li, S.; Li, S.Z.; Zhao, P.; Zhang, J. Analysis on coastal evolution characteristics and sediment environment of Colombo Harbor sea beach in Sri Lanka. J. Waterw. Harb. 2015, 2, 105–111. [Google Scholar]
- Ren, L.L.; Liu, X.R. A review of the digital elevation model extraction and digital hydrological modeling. Adv. Water Sci. 2010, 4, 463–469. [Google Scholar]
- AI-Masrahy, M.A.; Mountney, N.P. Remote sensing of spatial variability in aeolian dune and interdune morphology in the Rub’ AI-Khali, Saudi Arabia. Aeolian Res. 2013, 11, 155–170. [Google Scholar] [CrossRef]
- Bhuiyan, F.; Rajaratnam, N.; Zhu, D.Z. An experimental study of mounds formed by dumping coarse sediment in channel flow. J. Hydraul. Res. 2010, 3, 283–291. [Google Scholar] [CrossRef]
- Rajaratnam, N.; Mazurek, K.A. An experimental study of sand deposition from sediment laden water jet. J. Hydraul. Res. 2006, 4, 560–566. [Google Scholar] [CrossRef]
- Flemming, B.W. Zur klassifikation subaquatischer, strömungstrans versaler transPortkörPer. Bochumer Geologische und Geotechnische Arbeiten 1988, 29, 44–47. [Google Scholar]
- Allen, J.R.L. Current Ripples: Their Relation to Patterns of Water and Sediment Motion, 1st ed.; North Holland Publishing Company: Amsterdam, The Netherlands, 1968. [Google Scholar]
- Wewetzer, S.F.K.; Duck, R.W. Bedforms of the middle reaches of the Tay Estuary, Scotland. Int. Assoc. Sediment. Spec. Publ. 1999, 28, 33–41. [Google Scholar]
Figure 1.
The study area and the sediment dumping site.

Figure 2.
Arrangements of the dumping locations.

Figure 3.
(a) Wave observation instruments SBF6-2; (b) Velocity measurement device, Acoustic Doppler Cassent Profilers (ADCP).
Figure 3.
(a) Wave observation instruments SBF6-2; (b) Velocity measurement device, Acoustic Doppler Cassent Profilers (ADCP).

Figure 4.
Tidal-level observations.

Figure 5.
Photo of the rake suction dredger during the test.

Figure 6.
(a) Dredged sediment before sieving. (b) Dredged sediment after sieving.

Figure 7.
The process of dumping sediment over time (a) change of draught (b) change of sediment volume.
Figure 7.
The process of dumping sediment over time (a) change of draught (b) change of sediment volume.

Figure 8.
Definition of the two cross-sections.

Figure 9.
The flow features for Position A: (a) depth-averaged flow velocity magnitude during the test, (b) flow direction during the test, (c) vertical flow velocity before and after the test.
Figure 9.
The flow features for Position A: (a) depth-averaged flow velocity magnitude during the test, (b) flow direction during the test, (c) vertical flow velocity before and after the test.

Figure 10.
Morphology of sediment mounds after dumping at five positions: (a) P.A (b) P.B (c) P.C (d) P.D (e) P.E.
Figure 10.
Morphology of sediment mounds after dumping at five positions: (a) P.A (b) P.B (c) P.C (d) P.D (e) P.E.

Figure 11.
The cross-sectional profile along (a) horizontal direction and (b) longitudinal direction.
Figure 11.
The cross-sectional profile along (a) horizontal direction and (b) longitudinal direction.

Figure 12.
The relationship between mound height H and (a) mound width (a + b)/2; (b) water depth h.
Figure 12.
The relationship between mound height H and (a) mound width (a + b)/2; (b) water depth h.

Figure 13.
The morphological feature of second placement over the existing mound at P.C, (a) 10,000 m3; (b) 20,000 m3.
Figure 13.
The morphological feature of second placement over the existing mound at P.C, (a) 10,000 m3; (b) 20,000 m3.

Figure 14.
The cross-sectional profiles along (a) horizontal direction and (b) longitudinal direction.
Figure 14.
The cross-sectional profiles along (a) horizontal direction and (b) longitudinal direction.


Table 1.
Measured velocities at five test sites (P.A−P.E).
| Positions | Surface | 0.2 h | 0.4 h | 0.6 h | 0.8 h | Seabed |
|---|---|---|---|---|---|---|
| P.A | 0.12 | 0.08 | 0.13 | 0.13 | 0.08 | 0.03 |
| P.B | 0.20 | 0.18 | 0.17 | 0.13 | 0.07 | 0.06 |
| P.C | 0.16 | 0.08 | 0.12 | 0.11 | 0.07 | 0.03 |
| P.D | 0.08 | 0.02 | 0.02 | 0.03 | 0.03 | 0.06 |
| P.E | 0.18 | 0.12 | 0.16 | 0.12 | 0.12 | 0.08 |
Table 2.
Bed materials components and particle distributions.
| Samples | Particle Distributions d (mm) | Representative d (mm) | |||||||
|---|---|---|---|---|---|---|---|---|---|
| >2.0 | 0.50−2.0 | 0.25−0.50 | 0.075−0.25 | <0.075 | d10 | d30 | d50 | d60 | |
| 1 | 8.8% | 46.6% | 35.2% | 9.2% | 0.2% | 0.255 | 0.390 | 0.550 | 0.669 |
| 2 | 7.8% | 46.9% | 34.6% | 10.5% | 0.2% | 0.245 | 0.382 | 0.547 | 0.678 |
Table 3.
Morphological parameters of the mound at five positions.
| Positions | Volume (m3) | h/m | H/m | Averaged S | SI |
|---|---|---|---|---|---|
| P.A | 10,000 | 15 | 2.00 | 1:24.4 | 0.96 |
| P.B | 10,000 | 16 | 1.95 | 1:28.6 | 0.93 |
| P.C | 10,000 | 14 | 2.20 | 1:22.7 | 0.92 |
| P.D | 7000 | 15 | 1.70 | 1:28.3 | 0.94 |
| P.E | 3000 | 15 | 0.93 | 1:67.5 | 0.95 |
Table 4.
Long-term morphology changes of the mound at five positions.
| Positions | Volume (m3) | H (m) | (a + b)/2 (m) | ||
|---|---|---|---|---|---|
| Initial | Half-Year | Initial | Half-Year | ||
| P.A | 10,000 | 2.00 | 1.90 | 132 | 135 |
| P.B | 10,000 | 1.95 | 1.84 | 135 | 139 |
| P.C | 20,000 | 3.70 | 3.40 | 180 | 189 |
| P.D | 7000 | 1.70 | 1.61 | 120 | 122 |
| P.E | 3000 | 0.93 | 0.86 | 99 | 102 |
© 2020 by the authors. Licensee MDPI, Basel, Switzerland. This article is an open access article distributed under the terms and conditions of the Creative Commons Attribution (CC BY) license (http://creativecommons.org/licenses/by/4.0/).
Share and Cite
MDPI and ACS Style
Dai, W.; Ding, W.; Lu, C.; Luo, X.; Xie, Q. Field Investigations of Underwater Mounds Formed by Hopper Dredge Discharges in a Coastal Environment. J. Mar. Sci. Eng. 2020, 8, 395. https://doi.org/10.3390/jmse8060395
AMA Style
Dai W, Ding W, Lu C, Luo X, Xie Q. Field Investigations of Underwater Mounds Formed by Hopper Dredge Discharges in a Coastal Environment. Journal of Marine Science and Engineering. 2020; 8(6):395. https://doi.org/10.3390/jmse8060395
Chicago/Turabian StyleDai, Wenhong, Wei Ding, Chuanteng Lu, Xiaofeng Luo, and Qiancheng Xie. 2020. "Field Investigations of Underwater Mounds Formed by Hopper Dredge Discharges in a Coastal Environment" Journal of Marine Science and Engineering 8, no. 6: 395. https://doi.org/10.3390/jmse8060395
Note that from the first issue of 2016, this journal uses article numbers instead of page numbers. See further details here.