
Abstract
Objective. In this report we present the fEEGrid, an electrode array applied to the forehead that allows convenient long-term recordings of electroencephalography (EEG) signals over many hours. Approach. Twenty young, healthy participants wore the fEEGrid and completed traditional EEG paradigms in two sessions on the same day. The sessions were eight hours apart, participants performed the same tasks in an early and a late session. For the late session fEEGrid data were concurrently recorded with traditional cap EEG data. Main results. Our analyses show that typical event-related potentials responses were captured reliably by the fEEGrid. Single-trial analyses revealed that classification was possible above chance level for auditory and tactile oddball paradigms. We also found that the signal quality remained high and impedances did not deteriorate, but instead improved over the course of the day. Regarding wearing comfort, all participants indicated that the fEEGrid was comfortable to wear and did not cause any pain even after 8 h of wearing it. Significance. We show in this report, that high quality EEG signals can be captured with the fEEGrid reliably, even in long-term recording scenarios and with a signal quality that may be considered suitable for online brain-computer Interface applications.
Export citation and abstract BibTeX RIS

Original content from this work may be used under the terms of the Creative Commons Attribution 4.0 license. Any further distribution of this work must maintain attribution to the author(s) and the title of the work, journal citation and DOI.
1. Introduction
Electroencephalography (EEG) is a widely-used tool for the study of human brain function. In research settings, short-term EEG data acquisition is common (< 2 h), for instance to capture transient neural event-related brain responses. In contrast, for clinical applications such as the diagnosis and monitoring of epilepsy, continuous EEG acquisition over much longer time scales may be required (e.g. 24 h). In both cases, EEG electrodes need to be attached to the scalp and are then connected to a stationary amplifier. Most of the time, EEG recordings are conducted using wet electrodes mounted on caps, which secure them in place. EEG caps are relatively comfortable to wear for brief periods of time, but with longer usage, they may cause headaches [1, 2].
Therefore, in long-term EEG recordings, other solutions for data acquisition are necessary. Flex-printed electrode arrays encompassing a small number of electrodes have been introduced as an alternative to cap-based setups and their development has been largely driven by the mobile EEG community and the ear-EEG community, respectively. Flex-printed electrode grids are affixed directly to the participant's skin and therefore, they prevent displacement of the electrodes. Several solutions exist and some have been reported to be comfortable to wear over long periods of time [3–5]. Flex-printed solutions do not only fix the electrodes securely, they also prevent the conductive gel from evaporating and therefore can lead to stable impedances over the course of many hours [6]. Due to their fixation to hair-free parts of the head, the material can be thin and lightweight. Compared to using single elctrodes, electrode arrays can offer a convenient and simple way to attach several electrodes at the same time, which might be especially important in settings like user's homes or care homes. The sensors are placed equidistantly and in standardized positions, thereby facilitating data analysis and the reproducibility of results.
Flex-printed electrodes can be attached around and behind the ears and have been evaluated for long-term use and in various traditional paradigms [3, 4, 7]. Several groups showed that sensors placed at the ear capture ongoing brain oscillations [6, 8], as well as traditional auditory and visual evoked potentials [9–13]. They can provide sufficient information for sleep staging [4, 14], and for the decoding of auditory selective attention [15]. In addition to sensors placed around the ear, other groups have evaluated electrode arrays at the hairline, spanning a larger area of the head. Lin et al evaluated a forehead electrode setup for migraine screening, sleep tracking and depression treatment [16]. Other groups have presented EEG acquisition arrays tailored towards use in emergency settings, where short preparation time and good signal quality are paramount (e.g. [17–20]). However, the long-term feasibility and the range of signals that can be captured from EEG electrodes placed along the hairline were rarely in the focus of investigation.
Combining the promising results regarding the acquisition of data with flex-printed electrode arrays, we developed the fEEGrid array, which is a flex-printed array applied to the forehead.
In this report, we evaluate a flex-printed forehead electrode array (fEEGrid). Specifically, we were interested in the range of signals that can be recorded with the fEEGrid and whether the device was suitable for recordings after long-term usage in healthy individuals. Therefore, we analyzed data recorded during oddball paradigms that were conducted in two sessions, 8 h apart from each other. In the later session, the fEEGrid EEG acquisition was complemented with traditional EEG cap recording which enabled us to quantify the amount of information that may be lost by an incomplete spatial sampling.
2. Methods
2.1. Participants
Twenty-one healthy, young volunteers free of past or present neurological or psychiatric conditions participated in the study. Participants were mostly university students, some had previous experience with EEG experiments. Data from one participant had to be excluded due to technical problems. The final sample therefore consisted of twenty participants (18–35 years of age; mean 25.2 years, sd 4 years; 8 male). Informed consent was obtained from all participants. The study protocol was approved by the Oldenburg University ethics committee. Participants received monetary compensation for participation.
2.2. Stimuli and tasks
Two two-stimulus oddball paradigms and one sentence processing task were presented. In both oddball paradigms, the inter-stimulus interval was 1000 ms and the infrequent stimuli were presented in 25% of the cases, in randomized order. It was ensured that rare stimuli were not presented consecutively. Participants had to silently count the rare stimuli and report the number of rare events to the experimenter. All auditory stimuli were presented binaurally using EAR-Tone 3 A insert earphones (3 M Auditory Systems, Indianapolis, Unites States). Stimulus presentation was controlled using the Presentation software (version 20.1, Neurobehavioral Systems Inc. Albany, CA, United States) and custom-written experimental scripts.
In the auditory oddball paradigm, both the frequent and the rare tone had a duration of 100 ms and participant-controlled, comfortable loudness. The frequent tones were 1000 Hz sine wave tones, the rare tones were synthetically created novel environmental sounds. The stimuli are available upon request.
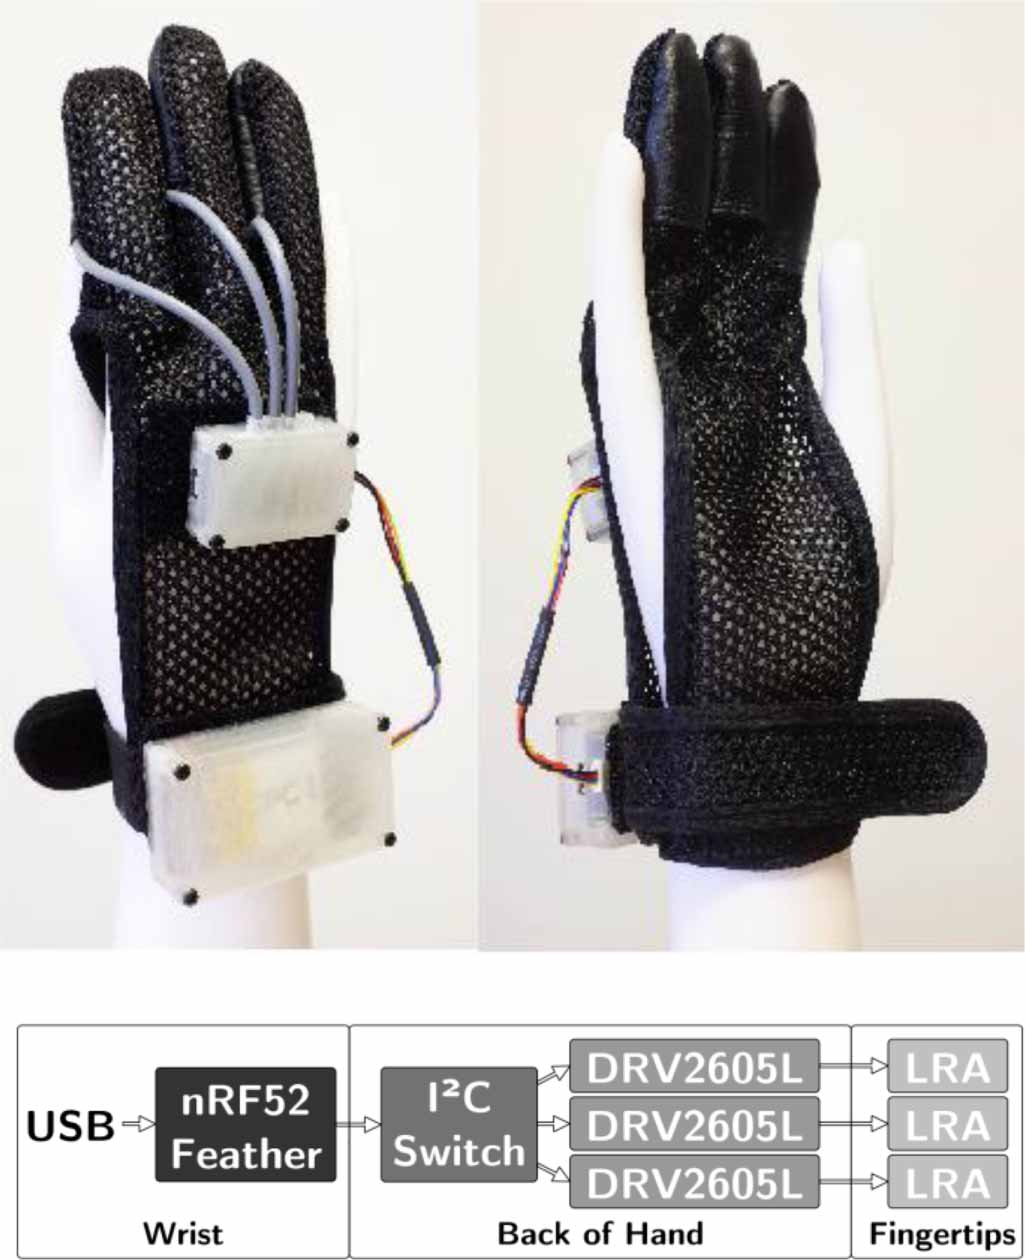
In the vibrotactile oddball, the frequent stimulus was 300 ms in duration and had 100% amplitude (0.8 G with 100 gram test load), the rare stimulus was 300 ms in duration and 16% in amplitude. Stimuli were presented using custom vibrotactile gloves, shown in figure 1. The frequent stimulus was presented on all three fingers of the right hand, the rare stimulus was presented on all three fingers of the left hand. Based on archery gloves, the vibrotactile actuators incorporate Linear Resonant Actuators (LRAs, model Jin Long LVM061530B) that exhibit a shorter ramp-up time compared to traditional eccentric rotating mass motors. Moreover, they allowed for controlling amplitudes and frequencies independently, and they are more durable and power efficient. LRAs operate at a resonance frequency, in this case 200 ± 10 Hz, which is generated by one driver chip per actuator (Texas Instruments DRV2605 L). We built the gloves using a custom modular prototyping system, figure 1 shows our system architecture that is distributed between fingertips, back of the hand and wrist. A microcontroller module (based on an Adafruit Feather nRF52) controlled an LRA driver module, which combined a signal generator and one driver chip (Texas Instruments DRV2605 L) per actuator with an I2 C bus switch. Tubular wire housing provided physical protection to the very fragile actuator lead wires.
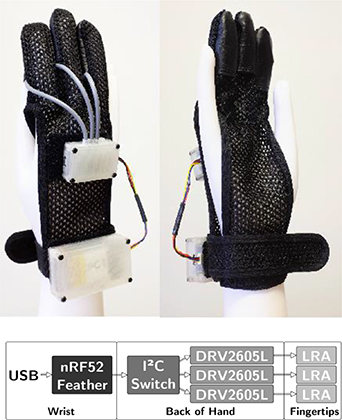
Figure 1. One of two vibrotactile gloves and the system architecture. The actuators are placed in the archery glove's fingertips of the three fingers, the controller hardware is stored in two enclosures on the back of the hand and wrist.
Download figure:
Standard image High-resolution imageIn the sentence processing task, incongruent and congruent sentences were presented, each category had a 50% chance of occurring. It was ensured that incongruent sentences did not follow each other. A total of 200 five-word sentences were presented in German language. The sentences were spoken by a male speaker. A pause of 1500 ms was inserted before the last word of the sentence. The inter-stimulus interval was 3000 ms between sentences (for further paradigm details, please see [21]). In the sentence processing task, participants were instructed to listen carefully to the sentences.
2.3. Procedure
Participants arrived in the morning and were equipped with the fEEGrids. The skin was treated with abrasive gel and alcohol before applying the grids. Under each electrode, a small amount of electrolyte gel (Abralyt HiCl, Easycap GmbH, Germany) was added before attaching the grid to the skin. The fEEGrid was affixed with ring-shaped electrode tape around each electrode on top of the pre-attached foam stickers, in order to secure the fEEGrid in place. Data acquisition started with the recording of impedance values. Electrodes with very high impedances (>20 kΩ) indicated an insufficient contact between electrode and skin and were treated with more gel or adhesive tape. Once good signal quality was ensured, the data recording started and the experiments began. Participants first completed the vibrotactile paradigm, then a passive listening paradigm, afterwards the auditory oddball paradigm and the sentence processing task, followed by an artifact production paradigm. For this report, data from the passive listening and artifact-production paradigm were not evaluated since they are unsuited for the intended comparison between a traditional EEG cap and the fEEGrid. Between each experiment, the experimenter read out instructions for the next task. Every experiment began with the recording of one minute of resting state EEG data. After participants completed all experimental tasks (overall duration approximately 1 h), they had a break of approximately six hours. During this break, they were wearing just the fEEGrid without a connected amplifier and were instructed to not engage in sports activities to ensure a comparable amount of movement for every participant. Otherwise they did not get any instructions or restrictions on how to pass their free time. After the break, participants came back to our laboratory and were equipped with a standard EEG cap in addition to the already positioned fEEGrid. Impedances of the fEEGrid were checked again. In the case of a loose reference or ground electrode, indicated by either no impedance values at all, or high impedance values on all electrodes, the reference or ground electrode was reattached. This reattachment was necessary in two subjects in the afternoon session, and not once in the morning session. The other electrodes were not further treated, even if their impedance values indicated a loosened connection. Then, participants completed the same tasks from the morning session with alternative sentences but otherwise identical stimuli. The data recording ended with another impedance check, during which the impedance values were documented again. The fEEGrid and the cap were then removed and participants filled out a comfort-rating questionnaire in which they rated the wearing comfort of the fEEGrid over the past seven to eight hours.
2.4. EEG recording
The fEEGrid is a sensor grid with 24 channels, two of them are used for reference and ground, leaving 22 channels to record the signal (cf figures 2 and 3). Reference and ground were placed above the nose at the nasal root, the remaining channels were placed along the hairline. Depending on the head size of the subject, the lowest lateral channels recorded at approximtely mastoid-level, directly on the masseter muscle or a little bit higher. The fEEGrid is made of PET film the pre-attached adhesive foam stickers are made of skin-compatible PE with solvent rubber adhesive. Electrodes and the conductive traces are printed onto the flexible material using a silver/silver chloride ink. The fEEGrid ends in a flat-ribbon cable which can be adapted to connect to any consecutive EEG amplifier. The size of the fEEGrid is 14.5 cm cm from the top corner to the lowest electrode, the frontal part is 12 cm cm wide. Every electrode has a diameter of 4 mm and the single electrodes are 1.6 cm apart from each other (center to center).
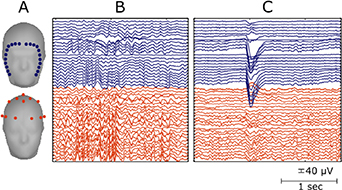
Figure 2. Montage of the fEEGrid and cap setup and raw EEG signals. (A) The headmodels show the averaged digitized electrode positions for both electrode montages. (B) and (C) show a few seconds of raw EEG signals recorded during eyes-closed (B) and during an eye blink (C).
Download figure:
Standard image High-resolution image
Figure 3. Schematic illustration of the fEEGrid and picture of mounted fEEGrid. The arrow on the top indicates the direction of the connector to the amplifier.
Download figure:
Standard image High-resolution imageAll recordings took place in a laboratory environment. Participants sat comfortably in a chair, visual instructions were presented on a 24" monitor, which was placed at a distance of approximately 120 cm from the participants. Data from the fEEGrid and the cap were recorded simultaneously using two connected 16-bit BrainAmp amplifiers (Brain Products, Gilching, Germany). Note that both electrode systems, the fEEGrid and the cap, were recorded against their own reference and ground electrodes. Data were recorded with a sampling rate of 500 Hz, a resolution of 0.1 µV and analog filter bands of 0.0153 to 250 Hz with the BrainVision Recorder software (version 1.20.0506, BrainProducts GmbH).
After recording all data sets, three-dimensional channel locations were recorded for the fEEGrid and the EEG cap using the ANT Xensor Digitizer (Xensor electrode digitizer, ANT Neuro, The Netherlands) and a sample montage on one member of the lab. These individual digitized positions were then imported [22] and transformed into a symmetrical schematic layout which was used for further analyses and illustrations.
2.5. Behavioral analysis: the comfort rating questionnaire
All participants filled out a questionnaire after they wore the fEEGrid for approximately 8 h. The questionnaire assesses the wearing comfort of electrodes. It is based on [23] and contained 26 questions, some regarding the comfort of wearing adhesive sensor grids. It also contained questions regarding the freedom of movement and questions about the security of handling the grid. Answers were provided on a seven-level Likert scale and ranged from 'I do not agree at all' to 'I fully agree'.
2.6. EEG analysis: pre-processing
EEG data were processed using custom Matlab scripts1 running in Matlab 2017b (version 9, The Mathworks Inc. Natick, USA) and EEGLab (version 14.1.2 [24],). Data from the fEEGrid and the cap were analysed identically in all steps. First, data were imported, separated into fEEGrid and cap datasets and morning and afternoon sessions, respectively. Then, channel location information was added. All data sets (3 per subject: fEEGrid morning, fEEGrid afternoon, cap afternoon) were then filtered using a lowpass filter at 40 Hz (zero-phase FIR filter, order 166, cut-off frequency −6 dB) and a high pass filter at 0.25 hz (zero-phase FIR filter, order 6600, cut-off frequency −6 dB).
Subsequently, calibration data for our artifact correction method were extracted by creating one minute epochs, starting at the experimental marker indicating the beginning of the resting period. The calibration data sets for every subject consisted therefore of a total of five minutes of EEG data, each minute recorded in the beginning of one of the experiments. Calibration data were concatenated for the current analysis to enable a more robust estimation of clean data for each participant. Artifact attenuation was performed using Riemannian Artifact Subspace Reconstruction (rASR),2 an adapted method of the ASR algorithm [25–28] which we introduced recently [29]. rASR needs dedicated calibration data to perform a successful artifact attenuation but does otherwise not require any user input or labels. rASR computes a representative model of clean, artifact-free data for every data set and then, during the artifact attenuation phase, compares segments of potentially artifactual data to these presumably clean calibration data. Data segments that potentially contain artifact are corrected using a reconstruction matrix computed from the clean calibration data, so that after using rASR, the data sets have the same length and channel count as before submitting them to the method and theoretically do not contain any artifacts. Usage of rASR followed our procedures as described in [29]. We used the following rASR parameters for both, fEEGrid and cap data: flatline = 5, hp = [0.25,0.85], channel_correlation = 0.9, noisy_channels = 4, burst = 3, window_calibration = 0.5, cutoff = 2, window_processing = 0.3, stepsize = 16, maxdims = 1. After artifact attenuation, data were split into epochs related to the experimental conditions. For classification analyses, we used both the fEEGrid data from the morning and afternoon sessions. For all other comparisons between cap and fEEGrid, we used only data form the afternoon session.
2.7. EEG analysis: event-related potentials (ERP)
For the analysis of event-related potentials (ERP), epochs from −200 ms to 800 ms relative to stimulus onset were created. Baseline correction was based on the −200 to 0 ms prestimulus interval. Epochs containing residual artifact not fully accounted for by rASR were identified using a probability based rejection criterion as implemented in EEGLAB (standard deviation: 3).
On average, the following trial numbers were available for the statistical evaluation: auditory oddball: 212 frequent, 54 rare (15% rejected), vibrotactile oddball: 303 frequent, 77 rare (14% rejected), sentence processing: 50 incongruent and congruent, (14% rejected). Based on [3], we re-referenced our recordings: for the fEEGrid, four averaged frontal channels were referenced to four averaged lateral channels, two combined on the right side, and two combined on the left side. For the EEG cap, we re-referenced centro-parietal channels (P3, P4, Pz) to averaged channels closest to the mastoid points (Tp9, Tp10). ERP condition effects were statistically analysed in a t-test comparison of the condition differences. For these analyses the maximum ERP response amplitude in a window around 300 ms after stimulus onset was compared between the rare (or incongruent) and frequent (or congruent) conditions. The window was determined based on the group average ERP and kept constant for all datasets.
In addition to the voltage amplitude of the responses elicited in all paradigms, we calculated Hedge's g as a measure of effect size for the ERPs. Hedge's g was preferred over Cohen's d as it is adequate for relatively small sample sizes. Effect sizes were alculated for all channels of the fEEGrid and all channels of the cap. Thereby we employed similar analyses as others [30, 31] and were able to report and compare effect sizes in all three paradigms. We used the open-source measures-of-effect-size-toolbox3 for all computations [32].
2.8. EEG analysis: LDA classification
We used a shrinkage Linear Discriminant Analysis (LDA) Classifier implemented in Matlabs Classification Learner Toolbox for the classification of single trials. Data were filtered using a 10 Hz lowpass filter (zero-phase FIR filter, order 660) and then epoched and grouped according to the class labels. No epochs were rejected for this analysis to maintain a comparable number of epochs for every subject. We employed two classification approaches for this report. First, we computed a 10-fold cross validation on all sessions for every subject, that is the morning fEEGrid session, the afternoon fEEGrid session and the cap session separately. In a second, more challenging classification scenario, we evaluated a session transfer classification approach to evaluate the cross-session generalization performance of our classifier. We used the model trained on data from the morning fEEGrid session to classify the afternoon fEEGrid data from the respective subject. In both scenarios, we extracted features from the epochs by first computing the mean amplitude of successive 50 ms windows, and then applying principal component analysis (PCA) for further dimension reduction. The dimensionality of the resulting feature space was determined by retaining those principal components that correspond to 99% of variance.
2.9. EEG analysis: stability of the ERP
To evaluate the effect of artifacts on the morphology of the ERP, we correlated the average ERP of artifact corrected data and filtered, but otherwise uncorrected data for the rare (or incongruent) stimuli. We repeated our analysis steps to compute the ERP on uncorrected and corrected data and finally computed Spearman correlations between the uncorrected and corrected responses.
3. Results
3.1. Behavioral
All participants completed the data recording and filled out the questionnaire afterwards. None of them reported pain or discomfort while wearing the fEEGrid. Figure 4 shows the results of a subset of items from the comfort questionnaire. Subjects indicated favourable results for all items regarding pain or discomfort while wearing the fEEGrid. 100% of all subjects disagreed with the statements 'Sensors are painful' and 'Sensors are heavy', 95% disagreed with the statement 'Skin feels warm' and 81% indicated that they disagreed with the statement 'Sensors tire me'. An additional Figure containing all statements of the questionnaire and their responses can be found in the supplemental material (available online at stacks.iop.org/JNE/17/034003/mmedia).

Figure 4. Subset of comfort questionnaire items and their frequency of rating. Responses were given after approximately 8 h of wearing the fEEGrid. Responses to the full 28 items of the questionnaire are shown in the supplementary material.
Download figure:
Standard image High-resolution image3.2. Impedances
We evaluated the differences of impedance values in the morning and afternoon session. The impedance measurement is implemented in the BrainAmp amplifier. It consists of using a 10 Hz alternating voltage which is send either via the reference or the ground electrode into the electrode hardware. The attenuation of the voltage flowing back into the amplifier can be used to compute the impedance. This measurement is only done in a specific impedance measurement mode, it is not done during the recording of EEG data.
In one subject the measurement did not succeed in the afternoon session (see figure 5) and in five subjects single channels showed values outside of the value range (>100 kΩ). These invalid recordings could indicate either a completely loose channel or a technical problem in the impedance measurement during the affected session. Data from the one subject with an invalid recording in the afternoon were ignored in the statistical comparison. Invalid values were marked as missing in the recording and were substituted by NaN values. Figure 5 shows the impedance values for all subjects and all channels. The averaged impedance values were over all higher in the morning session than in the afternoon session (morning = 26.3 kΩ, afternoon = 11.8 kΩ). A paired t-test confirmed significant differences of the mean impedance values per subject for the two sessions (t(18) = 3.76, p = .002, g = 0.96). This result is in line with previous work reporting that impedances tend to decrease over time when concealed electrodes are used [3, 6, 33, 34].
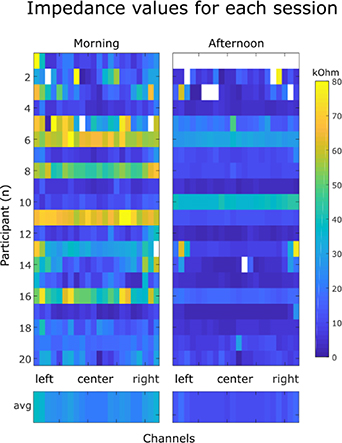
Figure 5. fEEGrid impedance values for the morning and afternoon session for all channels (x-axis) and all participants (y-axis). Invalid measurements are shown in white, low impedance values in blue, high impedance values in yellow. The lower row shows the averaged channel values across subjects. Impedance values were worse for subject 10, all other measurements indicated improved impedances for the afternoon session.
Download figure:
Standard image High-resolution imageIn addition to impedance changes over time, we also found spatial differences between lateral and frontal channels (mean frontal morning: 20.53 kΩ, afternoon: 10.52 kΩ, mean lateral morning: 34.58 kΩ, afternoon 15.41 kΩ) which were more pronounced in the morning than in the afternoon measurement. T-tests confirmed significant differences between the frontal and lateral impedances in the morning and to a lesser degree in the afternoon measurement (morning: t(3) = −9.03, p = .003, g = −5.31, afternoon: t(3) = −5.33, p = .01, g = −2.3).
3.3. Event-related potentials
ERP results were analyzed for the different paradigms separately for fEEGrid and cap data. In all three paradigms, we found condition-specific responses, that is, different ERPs for the rare (or incongruent) and the frequent (or congruent) condition. Those differences were evident in the time domain as well as in the spatial domain.
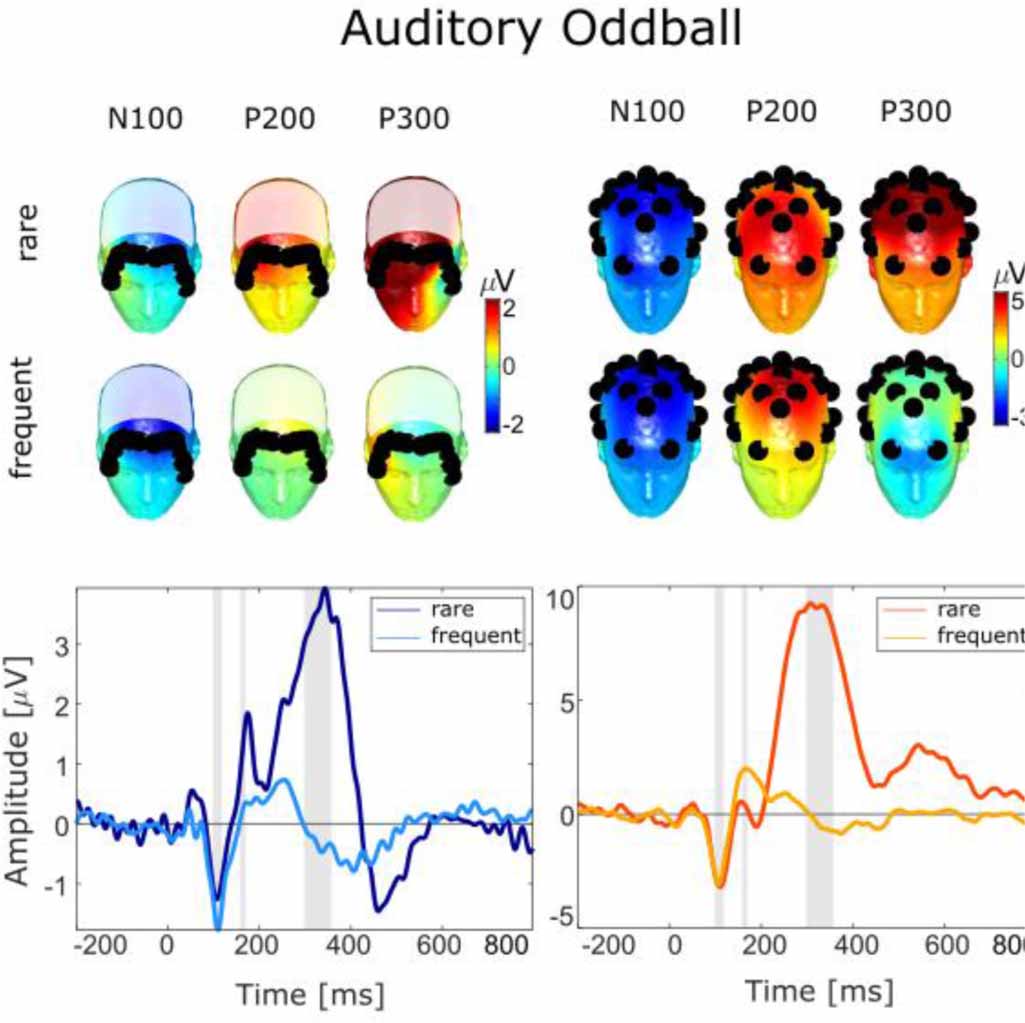
Figure 6 shows the results for the auditory oddball paradigm. For the fEEGrid we found that the rare stimuli elicited a response 100 ms after stimulus onset which resembled an auditory evoked potential N100 component and a later positive deflection 200 ms and 300 ms after the tone onset which resembled a P300 response. Those responses were most pronounced on forehead channels referenced to linked lateral channels and in particular the latest response at approximately 300 ms differed significantly in amplitude between the rare and the frequent condition (frequent: 0.99 µV, rare: 5.32 µV, t(19) = 8.87, p < .001, g = 1.87). For the cap data, we found an N100 deflection 100 ms after the tone onset followed by a P300 reponse which was larger in the rare than the frequent condition (frequent: 1.23 µV, rare: 11.23 µV). A t-test confirmed significant differences between the conditions (t(19) = 12.49, p < .001, g = 3.65).
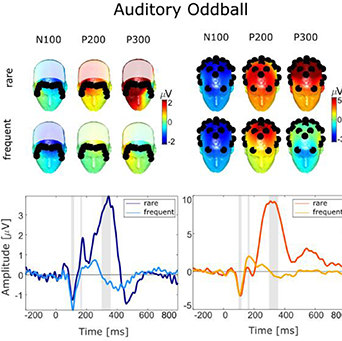
Figure 6. Grand average auditory evoked potentials recorded with the fEEGrid (left) and the cap (right). Headplots show the averaged response for rare and frequent stimuli averaged across samples indicated by grey areas in the time course. Black dots indicate the position of the electrodes. The time courses show the fEEGrid signal and the cap signal. For the fEEGrid, four averaged frontal channels were referenced to four averaged lateral channels, two combined on the right side, and two combined on the left side. For the EEG cap, we re-referenced centro-parietal channels (P3, P4, Pz) to averaged mastoid channels (Tp9, Tp10). The fEEGrid signal shows a bipolar derivation of four averaged frontal channels and four averaged lateral channels. The cap signal shows averaged parietal channels referenced against linked mastoids.
Download figure:
Standard image High-resolution imageFigure 7 shows the results for the vibrotactile oddball paradigm. For the fEEGrid we found that the rare vibration elicited a response approximately 400 ms after stimulus onset which resembled a P300 ERP resonse. This response was again most pronounced on forehead channels referenced to linked lateral channels and differed significantly in amplitude between the rare and the frequent condition (frequent: 1.09 µV, rare: 4.35 µV, t(19) = 2.18, p = .04, g = 0.53). For the cap data, we found a P300 response approximately 400 ms after the simulus onset. It was most pronounced on parietal channels referenced against linked mastoids and it was larger in the rare than the frequent condition (frequent: 0.47 µV, rare 6.65 µV). A t-test confirmed significant differences between the conditions (t(19) = 10.91, p < .001, g = 3.21). The overall rather late P300 deflection in the cap as well as the fEEGrid data is in line with previous vibrotactile oddball reports (e.g. [35, 36]).

Figure 7. Grand average potentials evoked by the vibrotactile paradigm recorded with the fEEGrid (left) and the cap (right). Headplots show the averaged response for rare and frequent stimuli averaged across samples indicated by grey areas in the time course. Black dots indicate the position of the electrodes. The time courses show the fEEGrid signal and the cap signal. For the fEEGrid, four averaged frontal channels were referenced to four averaged lateral channels, two combined on the right side, and two combined on the left side. For the EEG cap, we re-referenced centro-parietal channels (P3, P4, Pz) to averaged mastoid channels (Tp9, Tp10). The fEEGrid signal shows a bipolar derivation of four averaged frontal channels and four averaged lateral channels. The cap signal shows averaged parietal channels referenced against linked mastoids.
Download figure:
Standard image High-resolution imageFigure 8 shows the results for the sentence processing paradigm. For the fEEGrid we found that the incongruent stimuli elicited a negative deflection at approximately 400 ms after stimulus onset which resembled an N400 ERP resonse. This response was overall relatively small in amplitude and did not differ significantly between the incongruent and the congruent condition (congruent: 1.27 µV, incongruent: 0.57 µV, t(19) = −2.07, n.s.). In contrast, for the cap data, we found an N400 response which was larger in amplitude in the incongruent than the congruent condition (congruent: 1.89 µV, incongruent: −0.63 µV) and which differed significantly between the conditions (t(19) = −3.19, p = .004, g = −0.88).
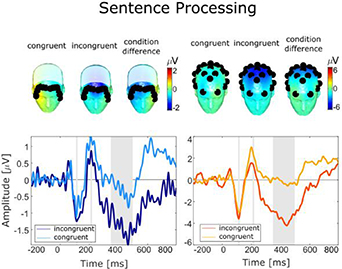
Figure 8. Grand average evoked potentials recorded during the sentence processing task with the fEEGrid (left) and the cap (right). Headplots show the averaged response for rare and frequent stimuli averaged across samples indicated by grey areas in the time course. Black dots indicate the position of the electrodes. The time courses show the fEEGrid signal and the cap signal. For the fEEGrid, four averaged frontal channels were referenced to four averaged lateral channels, two combined on the right side, and two combined on the left side. For the EEG cap, we re-referenced centro-parietal channels (P3, P4, Pz) to averaged mastoid channels (Tp9, Tp10). The fEEGrid signal shows a bipolar derivation of four averaged frontal channels and four averaged lateral channels. The cap signal shows averaged parietal channels referenced against linked mastoids.
Download figure:
Standard image High-resolution imageDue to the low spatial coverage of the head in recordings with the fEEGrid, we refrained from a statistical evaluation of the maps for the different components of the ERP responses. Descriptively, maps for the early negative and late positive deflection, as well as the deflections in the sentence processing task showed a plausible spatial distribution which was similar to the spatial distribution of the cap data in the same time window. The maps indicated lateralizations in some of the responses, namely the ones elicited by the vibrotactile paradigm, in which the rare stimuli were presented on the left hand and the frequent stimuli on the right hand. Accordingly, the maps for the cap data show some asymmetry, especially for the early negative deflection, which could also be seen in the maps of the fEEGrid data at similar latencies. This pattern may reflect contralaterally stronger responses, elicited by the rare stimulation.
3.4. Effect size
Averaged condition data for all channels were used to evaluate which channels captured discriminative information between conditions. Following the literature, successive samples on neighboring channels were expected to reveal larger effect sizes around 300–400 ms after stimulus onset than at other time windows (e.g. [3, 30]).
Figure 9 shows the results for data recorded in the auditory oddball paradigm separated by fEEGrid and cap. A clear segment of large effect sizes on 5 of the 6 forehead channels was evident at approximately 300 ms after stimulus onset. For the cap data, we identified segments of large effect sizes between conditions on frontal, central and parietal channels. These segments were largest at approximately 300 ms after stimulus onset and then again large at approximately 500 to 800 ms after the stimulus. This late effect is likely due to a late contribution to the P300, which was only captured by the cap [37, 38].

Figure 9. Absolute values of effect size of condition differences in the auditory oddball paradigm data recorded by the fEEGrid (left) and the cap (right). In the two upper plots, channels are displayed on the y-axis, time on the x-axis. Effect sizes are shown in blue for small values and yellow for high values. In the lower plots, Hedge's g values are plotted for all channels in the time domain, a red line indicates an effect size value for 'large effect size'.
Download figure:
Standard image High-resolution imageFigure 10 shows the results for data recorded in the vibrotactile oddball paradigm. Although the values in fEEGrid data exceeded the Hedge's g threshold of 0.8 for large effect sizes on frontal channels, no clear systematic segment of large effect size on neighboring channels or successive samples as in the auditory oddball paradigm was observed. For the cap data, segments of large effect sizes between conditions were found on frontal, central and parietal channels. These segments were largest at approximately 300 ms after stimulus onset and then again large, but less pronounced than in the auditory oddball paradigm, at approximately 500 to 800 ms after the stimulus onset.
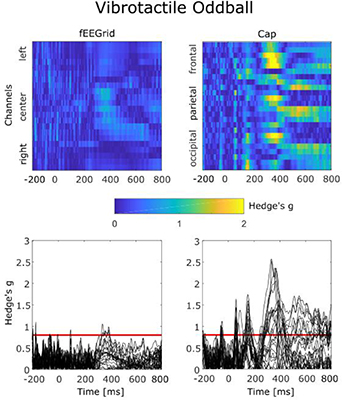
Figure 10. Absolute values of effect size of condition differences in the vibrotactile oddball paradigm data recorded by the fEEGrid (left) and the cap (right). In the two upper plots, channels are displayed on the y-axis, time on the x-axis. Effect sizes are shown in blue for small values and yellow for high values. In the lower plots, Hedge's g values are plotted for all channels in the time domain, a red line indicates an effect size value for 'large effect size'.
Download figure:
Standard image High-resolution imageFigure 11 shows the results for the sentence processing paradigm. Here, both for the fEEGrid and the cap, the result was less clear. While we found small segments of marginally large effect size on parietal channels in the cap data, no such plausible segments were found in the fEEGrid data.

Figure 11. Absolute values of effect size of condition differences in the sentence processing task data recorded by the fEEGrid (left) and the cap (right). In the two upper plots, channels are displayed on the y-axis, time on the x-axis. Effect sizes are shown in blue for small values and yellow for high values. In the lower plots, Hedge's g values are plotted for all channels in the time domain, a red line indicates an effect size value for 'large effect size'.
Download figure:
Standard image High-resolution image3.5. LDA classification
Figure 12 shows the single-trial classification results as area under the curve (AUC) measures for both, the cross-validation classification and the session-transfer classification analyses. The AUC measure was obtained by expressing the number of true positives of the classifier as a function of the number of true negative values in a Receiver Operator Characteristic (ROC) [39]. Results are shown for fEEGrid and cap data separately for all three paradigms.
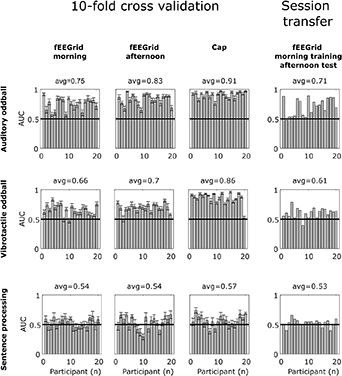
Figure 12. LDA classification results for the cross validation and the session-transfer evaluation. Shown here are AUC values for every participant as single bars, the error bars show the standard error across cross-validation iterations. The average value denotes the average of all subjects.
Download figure:
Standard image High-resolution imageAs could be expected, we found large inter-individual differences in cross-validation classification performance. Group averaged performance was above chance level for the auditory and vibrotactile oddball for the fEEGrid in both the morning and the afternoon session (auditory oddball: AUC morning = .75, AUC afternoon = .83, vibrotactile oddball: AUC morning = .66, AUC afternoon = .7) as well as for the cap (auditory oddball: AUC = .91, vibrotactile oddball: AUC = .86). However, in the sentence processing task, classification performance did not exceed chance level for the two fEEGrid sessions (AUC morning = .54, AUC afternoon = .54) and chance level was exceeded only marginally for the cap data (AUC = .57).
In the session-transfer analysis, a classifier trained on the fEEGrid morning session and evaluated in the fEEGrid afternoon session was used. The results were above chance level for the auditory oddball paradigm (AUC = .71) and the vibrotactile oddball paradigm (AUC = .61), suggesting stable classifier performance over time, but at chance level for the sentence processing task (AUC = .53).
3.6. Stability of ERP in the presence of artifacts
It was expected that the fEEGrid signal would be more sensitive to artifactual influences since many typical artifacts recorded in the EEG signal originate from either eye movements, eye blinks, or muscle activity produced by face muscles (e.g. jaw clenching, swallowing). The resulting artifactual signals should be captured with a larger amplitude by the fEEGrid than by most channels of the cap, especially by parietal channels which were used for the ERP comparisons in this report. Figure 13 shows a similarity measure, namely squared Spearman correlation values (R2) as a measure of shared variance in the signals. Results are shown between corrected and uncorrected signals recorded in all three paradigms by the fEEGrid and the cap separately.

Figure 13. R2 values between artifact-corrected and uncorrected data for the fEEGrid and the cap in all paradigms. Shown here are only the averaged data elicited by rare (or incongruent) stimuli. The first column shows the correlation between corrected and uncorrected fEEGrid signals. The center column shows uncorrected and corrected cap signals. The right column shows correlation of corrected signals captured by the fEEGrid and the cap. Not shown, but reported are correlation values of uncorrected signals for the two electrode hardwares.
Download figure:
Standard image High-resolution image
As can be seen, the fEEGrid signals showed overall low R2 values in all three paradigms when uncorrected and corrected ERPs were compared (auditory oddball: R2 = .00, vibrotactile oddball: R2 = .52, sentence processing task: R2 = .00). The values for the cap data, however, indicated stronger similarity between uncorrected and corrected ERP signals (all paradigms: R2 = .99). Artifact correction restored the ERP morphology in the fEEGrid signal, which was then higher correlated with corrected cap signals than with uncorrected fEEGrid signals (auditory oddball: R2 = .16, vibrotactile oddball: R2 = .95, sentence processing task: R2 = .64).
A correlation of uncorrected ERPs recorded by the fEEGrid and the cap yielded lower values than the same comparison on corrected data for the vibrotactile and the sentence processing task (vibrotactile oddball: R2 = .50, sentence processing task: R2 = .15), while for the auditory oddball task the uncorrected signals correlated higher than corrected signals (auditory oddball: R2 = .54).
4. Discussion
Comfortable long-term EEG recordings may provide important data for clinical applications. For these purposes, data may be needed that are recorded over the course of many hours using traditional EEG recording setups consisting of EEG caps and a large number of electrodes. However, the signals acquired by these setups may decrease in quality over time, due to the evaporation of gel and modest wearing comfort. In recent years, the development of comfortable flex-printed electrodes has led to promising alternatives to lab-based recording hardware, which have, however, mainly been evaluated for short-term recording scenarios [16–19]. With the development of the fEEGrid, we aim to add to the growing research body of lightweight electrode hardware and want to extend their evaluation to long-term recording scenarios. We evaluated the fEEGrid in a divided recording setup, in which data were recorded in the morning and then again after 7 h. We found that it captured ERPs elicited by traditional oddball paradigms reliably, both in the morning and the afternoon session, while being comfortable to wear throughout the 8 h of usage in total.
Flex-printed electrodes have been presented for different clinical use cases, like emergency EEG recording [18–20] and sleep staging [4, 14], but also for various traditional use cases in laboratory and mobile settings [3, 10, 12, 16, 18, 40–43]. Usually, adhesive printed electrodes are attached directly to the user's skin on hairless regions like behind the ear or on the forehead. These adhesive electrode stripes usually contain fewer channels than traditional EEG setups and cover a smaller region of the head. Despite this reduced spatial coverage, they may capture far-field signals generated in distant cortical regions due to the effect of volume conduction [6, 44, 45]. In this investigation, we found the forehead-mounted fEEGrid capturing ERPs that are typically prominent over centro-parietal scalp sites, elicited by auditory and vibrotactile oddball paradigms. Interestingly, fEEGrid ERPs were to some degree comparable in morphology to those recorded with a traditional EEG cap, albeit severely decreased in amplitude and effect size. Above-chance classification of single trials into rare or frequent stimuli was nevertheless possible for both the auditory and the vibrotactile oddball paradigm. This suggests that fEEGrid, while capturing far field signals with a lower amplitude, also captures far-field noise contributions with reduced amplitude, leaving a sufficient signal-to-noise ratio for single-trial analysis.
The fEEGrid was evaluated not only in terms of signal quality, but also in terms of wearing comfort. Participants were asked to report wearing comfort after 8 h of non-stop wearing the fEEGrid. The results were unanimously favorable: although most participants did respond that they felt the presence of the grid the whole time (66%), none of them indicated pain or discomfort due to wearing the fEEGrid.
This result combined with the reliability of capturing EEG signals even after many hours indicates that the fEEGrid may be used for long-term recording and monitoring sessions. In future studies we hope to use fEEGrids in patients with disorders of consciousness (DOC), vulnerable users who may not reliably express discomfort or pain during the measurement. For this and other applications, it is beneficial to keep good signal quality over the recording duration. In line with results reported for the cEEGrid [3], we found decreased impedance values in the later measurement which leads us to conclude that it might be possible to record high-quality EEG signals even throughout long-term measurements.
In assessing the robustness of the recording, it has to be taken into account that the fEEGrid in the present study was fixed with ring-shaped electrode tape. This was done because the pre-attached foam stickers did not provide a secure fixation for a long-term application. In pilot work it was found that single channels could lose contact to the skin. The use of adhesive conductive gel should be another way to secure flex-printed electrodes in place and could also reduce electrodes application time. Even though an additional step was necessary in the fEEGrids used in this study, we conclude that fEEGrid setup and removal takes little time and may be even less error-prone than the handling of a traditional EEG cap. We are confident that its usage can be incorporated into the routines in a care home or a user's home.
With the fEEGrid, we present a novel flex-printed electrode array for comfortable high-quality data recording. While this solution may be interesting only for some applications, we think that it can be interesting in particular for clinical, laboratory and mobile settings, including passive brain-computer interface developments for DOC patients.
Acknowledgments
We want to thank Lisa Straetmanns for the help with the data collection and valuable input to this manuscript. The development of the fEEGrid was funded by the Bundesministerium für Bildung und Forschung in the project NeuroCommTrainer. The authors SB, RE, JA, AF and SD declare no conflict of interest. FM is General Manager of the company Easycap, which has a commercial interest in distributing fEEGrids. The authors have confirmed that any identifiable participants in this study have given their consent for publication.
Author contributions
SB and SD collected the data. SB, SD and AF analyzed the data. JA developed the vibrotactile stimulation hardware. FM, SD and SB developed the fEEGrid. RM validated the hardware. All authors wrote and reviewed the manuscript.
Footnotes
- 1
(available at https://github.com/s4rify/fEEGrid_paper)
- 2
https://github.com/s4rify/rASRMatlab.
- 3
https://github.com/hhentschke/measures-of-effect-size-toolbox.