Are Wheat Hybrids More Affected by Weed Competition than Conventional Cultivars?


Dipartimento di Scienze Agrarie, Forestali e Alimentari, Università di Torino, Largo Paolo Braccini 2, 10095 Grugliasco (TO), Italy
*
Author to whom correspondence should be addressed.
Agronomy 2020, 10(4), 526; https://doi.org/10.3390/agronomy10040526
Submission received: 27 February 2020
/
Revised: 3 April 2020
/
Accepted: 4 April 2020
/
Published: 7 April 2020
(This article belongs to the Special Issue Herbaceous Field Crops Cultivation)
Abstract
:Seeding rates of hybrid wheat varieties are typically much lower than conventional varieties due to their higher seed costs, which could potentially delay canopy development leading to greater weed pressures. To test whether hybrid wheat crops are more affected by weed pressure than conventional cultivars, a conventional variety (“Illico”) and a hybrid (“Hystar”), were compared in a three-year (2012–2016) field study at two sites in Northern Italy. Weed infestation was mainly characterized by weeds with an early growth pattern, and in only a few seasons did the hybrid crops show a higher weed density than the conventional cultivar. Despite the lower sowing rate, hybrids were able to achieve a similar crop density to the conventional cultivar even in years of delayed sowing or dry weather conditions. Normalized Difference Vegetation Index values were generally similar between cultivars across the years, regardless of the presence of weeds, except during the springtime. Occasionally, the test weight was significantly higher in weeded plots than un-weeded plots. Overall, the two cultivars showed similar yields within the same year. These results indicate that on fields with a low weed burden, and where these weeds emerge early, cultivars may not be significantly affected by productivity losses.
1. Introduction
Modern agriculture relies on the use of herbicides which still represent the most cost-effective tool to control weeds [1,2]. However, in the last decades the sustainability of herbicide use is increasingly threatened by a continued rise in the number of herbicide-resistant weed species [2,3,4,5]. As a result, in the last decades weed management has moved towards more integrated weed control strategies, which include a variety of agronomic, mechanical, ecological, physical, and biological practices [6,7]. In particular, the ability of crops to tolerate weed competition while maintaining high yields can be usefully exploited. Crop competitiveness can be distinguished in weed tolerance and weed suppression [8,9]. Both abilities may help to reduce the development of weeds, diminishing the seed dispersal across the season, replenishing their weed seed bank [10].
Crop competitiveness is linked to different plant characteristics, but in particular it is directly related to the leaf area and the rapidity of canopy closure [11]. The possibility of exploiting crop competitiveness is of particular importance in organic farming, where herbicides are not allowed and the remaining control tools are not as effective as the chemical applications [12,13]. Cereals are generally considered more competitive crops than broadleaved species. However, not all cereals show the same competitive ability against weeds. Barley is more competitive than rye and wheat due to its early season growth vigour and to its more expansive root system [14,15].
Crops that rapidly shade the soil surface with their canopy show a more pronounced competitive ability against weeds [16]. This trait is influenced both by species and varieties, but also by technical-agronomic options. For example, cereals may allow high seeding rates and/or reduced row spacing that can eventually result in a significant decrease of weed density and weed competition [14,17]. Other studies reported a significant effect of row orientation on weed development in cereals such as wheat and barley [18].
Crop and livestock demand will increase worldwide according to the FAO prospects [19]. This represents a great challenge both for developed and developing countries. As cereals are still the main sources of food supply, stakeholders should make great efforts to achieve these objectives. The cereal production increased almost unabated over the last 60 years thanks mainly to breeding technologies, the enlargement of irrigated land area, and the wide use of chemical fertilizers, in particular those based on nitrogen and phosphorus [20]. While in developing countries we can expect an increase in the area under cereal cultivation, in developed countries we will see a further reduction in cultivated area [21]. Breeding technologies allowed very high yields to be gained for certain cereals such as maize and rice, while in other cereals the yield improvement has not been so dramatic. The potential advantages of hybrid wheats are higher biomass production, higher yields, and wider adaptation to different soil and climate conditions [22].
Despite hybrid wheat programs having been carried out over many decades, the impact of hybrid wheat varieties on the total sown area still remains limited [20]. Up to 2019, more than 140,000 ha have been cultivated with hybrid wheat in Europe, half of them in France. A more limited area is nowadays being cultivated in Hungary and Italy (30,000 ha) [23]. Overall, obtaining hybrids from autogamous species is not as easy as in allogamous species and it results in a considerably higher cost of seeds relative to conventional varieties. The systems used in the past to obtain hybrids in other cereal crops were less successful in wheat due to a variety of problems (fertility restoration, toxicity effect of hybridising agents, etc). Recently new hybridising systems have been proposed and followed thus refreshing the interest of certain companies in wheat hybrids [20].
Furthermore, we have also to consider that with wheat, yield benefits are controlled by dispersed dominant alleles [20].
The introduction of hybrid cultivar requires the reconsideration of the cropping system in order to enhance the strength of these genotypes and to minimize their weakness points. In particular, the higher cost of seeds determines the need to reduce the seeding rate, which rate isapproximately one third of the ordinary amount of conventional cultivars. This may lead to delayed canopy development, and a longer period of an open canopy, potentially allows a higher ingress of weeds and, as a consequence, a greater dependence on herbicides.
On the other hand, hybrids could recover the initial disadvantage by means of a higher tillering capacity. Despite the weed suppression ability of certain cereals, no information is available regarding the competitive behaviour of hybrid wheats compared to conventional varieties. The reduced seeding rate adopted in hybrid varieties leaves more bare soil free to be colonized by weeds in the early part of the growing season. This condition could potentially determine some yield reduction due to the high weed pressure. Up to now, these speculations have not yet been thoroughly investigated.
The aim of the present study was to verify whether wheat hybrids are potentially more affected by weed pressure. These hypotheses have not yet been investigated experimentally. For this scope, a conventional and a hybrid variety were compared in a three-year field study carried out in two pedo- climatic conditions. Specific crop and weed assessments were done in order to highlight the differences between the two varieties both in terms of yield performances and weed density.
2. Materials and Methods
2.1. Study Sites
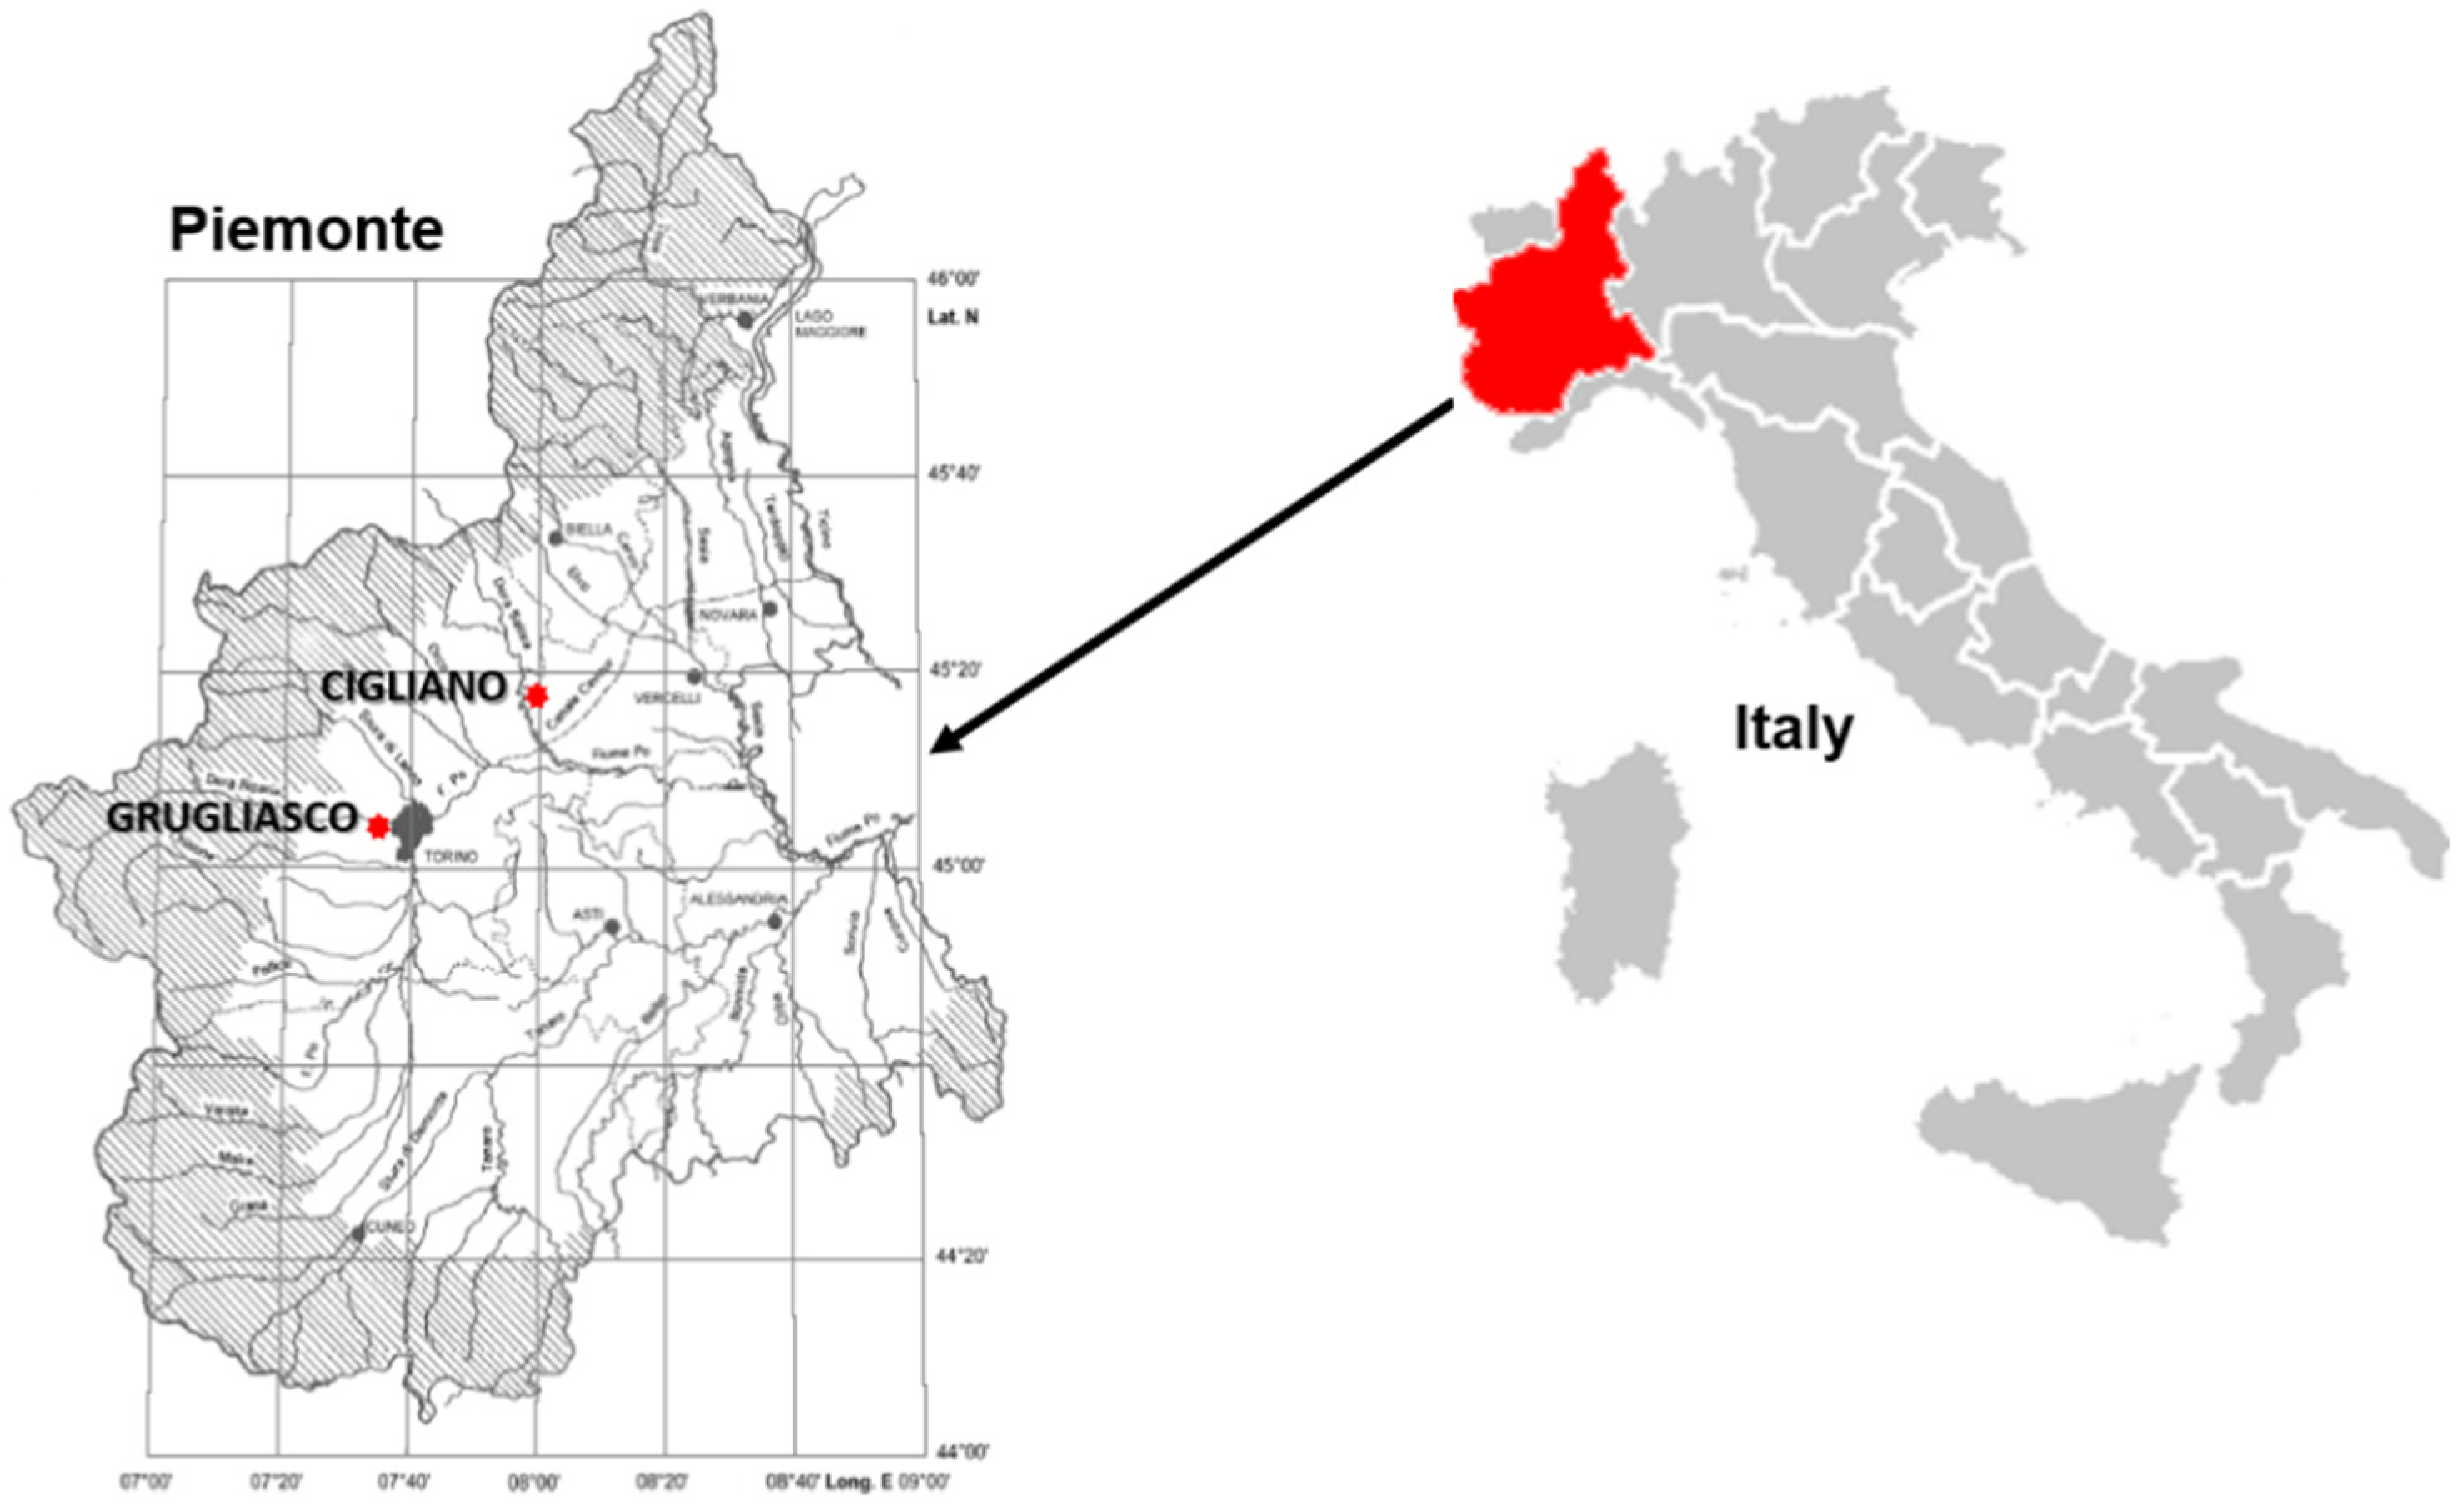
Field experiments were carried out from 2012 to 2016 at two locations in Piemonte (Northern Italy): Cigliano (45°18′54.8″ N, 8 02′53.9″ E and 237 m a.s.l), and Grugliasco (45°04′00.5″ N, 7°35′35.3″ E and 293 m a.s.l.) (Figure 1). At Cigliano, the study was carried out in a private farm with a long history of cereal cultivation, while in Grugliasco the study was conducted at the experimental fields of the University of Turin. Cigliano site was characterised by a sandy-loam soil (sand 50.7%, silt 38.9%, clay 10.4%), Typic Hapludalfs (USDA classification), with sub-acidic reaction (pH 6.2), a very low cation exchange capacity (0.92 meq 100 g−1) and a C/N rate of 10.7. The Grugliasco soil is classified as Typic Hapludalf, silty-loam (sand 41.0%, silt 48.1%, clay 10.9%), sub-acid (pH 6.1), mesic soil, with a low cation exchange capacity (8.9 meq 100 g−1) and a C/N rate of 9.0. At Cigliano the study was carried out in the seasons 2012–13, 2013–14, and 2015–16, while at Grugliasco it was carried out in the seasons 2013–14, 2014–15, and 2015–16.
2.2. Experimental Layout
Two wheat cultivars were compared: the conventional “Illico” (Syngenta Italia S.p.A.) and the hybrid “Hystar” (Venturoli Sementi s.r.l, Italy). In all seasons, “Illico” was sown at a rate of 220 kg ha−1, while “Hystar” at a rate of 75 kg ha−1. In both years and locations, fields were sown at 15 cm row spacing using a conventional seeder, in a north–south orientation. Both cultivars were sown on November 7, October 22 and October 21, in 2012, 2013, and 2015, respectively, at Cigliano site, and October 22, November 2 and October 21 in 2013, 2014, and 2015, at Grugliasco. Fields were managed according to the local agricultural practices. Seed-bed preparation consisted of an autumn ploughing at 30 cm, followed by a disk-harrowing. A total of 120 kg N ha−1 was applied as a granular ammonium nitrate fertilizer, split into 60 kg N ha−1 at tillering (growth stage 23 on the BBCH scale of Lancashire et al. [24] and 60 kg N ha−1 at stem elongation (BBCH 32). Phosphorus and potassium were applied in each site according to the ordinary management of the farms. All the plots were sprayed at the flowering stage with prothioconazole and tebuconazole [Prosaro®, Bayer, emulsifiable concentrate formulation (EC), applied at 0.125 kg of active ingredient (AI) ha−1] to control fungal disease. Plots were characterized by homogenous weed infestations. Fields were routinely treated only in post-emergence to control weeds by means of a mixture of different post-emergence herbicides. As pre-emergence application of herbicide is an uncommon practice in the region, no pre-emergence treatments were done on the field. At Cigliano, weed control was undertaken by applying the herbicide Granstar Trio® at 50 g ha−1 [florasulam (5.25 g ha−1) + metsulfuron-methyl (4.15 g ha−1) + tribenuron (4.15 g ha−1); DuPont de Nemours Italiana s.r.l.]. At Grugliasco weed control was done applying a mixture of Manta® Gold at 2.5 L ha−1 [fluroxypyr (150 g ha −1) + clopyralid (58.25 g ha−1) + MCPA (665 g ha−1); Dow AgroSciences Italia s.r.l.] and Axial® at 0.4 L ha −1 [(pinoxaden (40 g ha−1) + cloquintocet-mexyl (5 g ha−1); Syngenta Italia s.p.a.].
The experimental plots were located within contiguous fields cultivated respectively with the conventional and hybrid wheat cultivar. In each location, the compared treatments were represented by the following: absence of weed control (NOT-WEEDED treatment) and presence of weed control (WEEDED treatment). In the NOT-WEEDED treatment, plots were covered with a plastic film during herbicide spraying in order to avoid any drift from the adjacent treated plots. The experimental fields were previously managed under a continuous two-year rotation maize–wheat system (Cigliano) or maintained as meadow for 5 years (Grugliasco). The study was conducted every year on the same location but in different fields. At each location, experimental plots of 12 m−2 each were arranged in a complete randomized design with four replications for each cultivar and treatment.
2.3. Weed Assessments
Weed assessments were carried out by counting weed density (number of plants of each weed species per m2) and visually evaluating weed cover on the ground (%). Weed density was assessed by counting the number of individuals of each species present within a metal quadrat frame of known area (0.625 m2). Weed cover was evaluated by estimating the percentage of the area included in the metal frame covered by the weeds. At each assessment date, weed density and cover were assessed on three quadrat locations in each plot selected by randomly launching the metal frame. A total of 12 measurements were taken at each assessment (3 times per plot, 4 plots per field).
Two weed assessments were carried out, the first when the wheat crop was at early stem elongation, and the second between the start of heading and the late milk stage (Table 1). In Cigliano, the most abundant weed species were Stellaria media (L.) Vill., Veronica persica Poiret, Matricaria chamomilla L., Panicum dichotomiflorum (L.) Michaux and Viola arvensis Murray, while at Grugliasco the most detected weed species were Poa spp., Stellaria media (L.) Vill., Veronica persica Poiret and Ranunculus repens L.
2.4. Crop Assessments
2.4.1. Yield, Test Weight, and Moisture
Grain yield was measured by harvesting the whole plot using a plot combine (Wintersteiger Seedmech Ried im Innkreis, Austria). A sample taken from the bulk production harvested in each plot was used to determine the grain moisture and test weight (TW) (4 plots per treatment, 4 replicates). The TW was measured using a GAC® 2000 Grain Analyzer (Dickey-John Auburn, IL, USA) using the supplied program and after a validation with reference materials. The grain yield results were adjusted to a 13% moisture content.
2.4.2. Spike Density
At the end of flowering, the crop density was recorded by counting the number of spikes in a sampling surface of 0.04 m2 per plot. The crop density was expressed as number of spikes per m2. In each plot the number of spikes was counted twice and the mean value was used as the average number of spikes of the plot (4 plots per treatment, 4 replicates).
2.4.3. Crop Vigour after Winter Dormancy
A hand-held optical sensing device, GreenSeeker™ (Trimble, Sunnyvale, California, USA), was used to measure every 7 days the relative photosynthetically active biomass from the spring tillering stage after winter dormancy to the heading stage. In each plot the Normalized Difference Vegetation Index (NDVI) data acquisition was repeated twice and the mean value was used as the value of the whole plot (4 plot per treatment, 4 replicates). The measurement of NDVI helps to quantify the development of the crop canopy across the season. This device has its own consistent light emission source, photodiode detectors, and interference filters for red [Red] and near infrared [NIR] wavelengths at the 671 ± 6 nm and 780 ± 6 nm spectral bands, respectively; it provides the NDVI, which is calculated as follows [24]:
where RNIR is the NIR radiation reflectance and RRed is the visible red radiation reflectance. The instrument was held approximately 80 cm above the canopy and its effective spatial resolution was 2 m2. The NDVI values are proportional to the crop biomass and the greenness.
2.4.4. Statistical Analysis
Weed density, yield and the main yield-related parameters were compared by performing t-tests on differences between cultivars within the same treatment (WEEDED/NOT-WEEDED) and between cultivars in different treatments (WEEDED vs NOT-WEEDED). SPSS, version 25.00, (SPSS, IBM Corporation, 2008), was used for the statistical analysis.
2.5. Weather Conditions
The meteorological trend observed in the period 2012–2016 at the two locations under study is reported in Table 2 and Table 3. The Grugliasco site showed the highest total rainfall as well as the greatest values of growing degree days (GDD). From November to March, the growing season 2015–2016 was the one with lowest rainfall, with less than 195 mm of rain fallen in Cigliano and 232 mm in Grugliasco. In terms of GDD, relevant variations were observed between years at Cigliano, while they were less pronounced at Grugliasco.
3. Results
3.1. Weed Density and Weed Cover
During the 2012–2013 growing season the study was carried out only at the Cigliano site. Weed density and weed cover data are reported in Table 4 and Table 5. At the first assessment, conducted almost at the beginning of the spring season (April 10), the average weed density was 109 plants m−2 in “Hystar” plots (hybrid variety) and 102 plants m−2 in “Illico” plots (conventional variety), without significant differences between the two cultivars. In both cultivars the most abundant weeds were Stellaria media, Matricaria chamomilla and Polygonum aviculare. The highest average weed cover was around 10%. At the second assessment a noticeable increase in weed density was observed in both cultivars, particularly on “Hystar” plots (198 plants m−2). Weed flora was more diversified than the previous assessment as other annual summer weeds appeared (Echinochloa crus-galli, Panicum dichotomiflorum).
In 2013–2014 the study was carried out both at Cigliano and Grugliasco. At Cigliano, at the time of the first assessment (March 12), weed density was not significantly higher in hybrid variety (“Hystar”) plots (50.7 plants m−2) than in the conventional (“Illico”) plots (51 plants m−2). Less than 20% of the soil was covered by weeds. At the second assessment, weed infestation did not change greatly (Table 4), and Stellaria media was the most abundant species in both cases. At Grugliasco the most abundant weeds were Veronica persica, Polygonum aviculare, Papaver rhoeas, Ranunculus repens and Poa spp. On average, at the first assessment (March 14), weed infestation was significantly highest in “Illico” plots (414.7 plants m−2). Despite the high weed density values, weed cover did not exceed 15%. Infestation was mainly composed by Poa annua, Veronica persica and Ranunculus repens. On the second assessment (April 17), weed infestation was on lower values compared to the previous assessment; a significantly high weed pressure was recorded in “Hystar” plots (242.9 plants m−2) while an important decrease in weed density was observed on “Illico” plots (Table 4).
In 2014–2015 the study was carried out only on the Grugliasco site. At the first assessment (April 8) a high weed pressure was observed in “Illico” plots and it was mostly represented by Poa spp. and Veronica persica. During the last season under investigation (2015–2016), the study was carried out at both sites. In Cigliano at the assessment carried out in March, weed density showed low values at both sites (less than 14 plants/m−2). In Grugliasco weed infestation was relevant: on the first assessment (March 24), weed density was 142.7 plants m−2 on “Hystar” plots and 126.5 plants m− 2 on “Illico” plots, without significant differences between cultivars.
3.2. Crop Assessments
3.2.1. Grain Yield
In all the seasons, in general no significant differences were observed in terms of grain yields between the two cultivars. The hybrid cultivar achieved the same yield performances of the conventional cultivar. The only exception was observed on WEEDED plots at Cigliano site in 2015–2016 (Table 6) when the yield observed in Hystar plots (8.4 t/ha) was significantly highest compared to the yield recorded on the conventional cultivar (7.2 t/ha). Even in NOT-WEEDED plots no significant differences were detected in both sites during the seasons under study. The presence of weeds seemed not to have a great influence on the yield performances of the two cultivars as the comparison of the yields achieved in presence or absence of weed pressure generally did not show significant yield differences. At Cigliano, in 2012–2013 “Hystar” showed a significantly higher yield in NOT WEEDED plots, while in the last season (2015–2016) despite the scarcity of rainfall during the winter time, high yields were reached by the two varieties in WEEDED plots. The highest yield monitored in “Hystar” plots may be related to the minor weed infestation observed, particularly at the first assessment. At Grugliasco, the analysis did not show any statistical differences between the yields measured in WEEDED and NOT-WEEDED plots, regardless of the cultivar. In this location, the highest grain yields were reached in Illico cultivar (≥ 9.6 t/ha) in 2013–2014 (Table 6), while the lowest was measured in 2015–2016 season in Illico plots. The reduced yields recorded in the 2015–2016 growing season at Grugliasco are likely attributable to the negative impact of the winter drought on crop growth.
3.2.2. Test Weight and Grain Moisture
The statistical analysis showed a significant effect of the cultivar on these parameters. Overall, the highest test weight values were measured on “Illico” cultivar, both in WEEDED and NOT- WEEDED plots. The lowest test weights values were generally found in NOT-WEEDED plots, regardless of the cultivar (Table 7). Only at Cigliano site, in 2013–2014 on NOT-WEEDED plots, and in 2015–2016 on WEEDED plots, were no statistical differences observed between the two cultivars. At harvest time, grains of “Hystar” cultivar often reported the highest moisture values, in particular on weeded plots. At both sites, regardless of the presence or not of weeds, the highest grain moisture was measured during the 2013–2014 growing season that was characterized by high rainfall. On NOT-WEEDED plots, only in 2013–2014 were the grain moisture values statistically different between the two cultivars, in all the other years grain showed similar humidity (Table 8).
3.2.3. Spike Density
Spike density was not significantly affected by cultivar and weed competition. In particular, at the Grugliasco site, the statistical analysis did not show differences in the number of spikes between the two cultivars. Only in Cigliano had the “Illico” cultivar a higher number of spikes m−2 than the hybrid cultivar, in 2013–2014 on WEEDED plots and in 2015–2016 on NOT-WEEDED plots. In both sites, the highest spike density values were recorded during the 2015–2016 growing season, while the lowest values were recorded in 2012–2013 at Cigliano site (Table 9).
3.2.4. Crop Vigour
The crop vigour was determined taking NDVI measurements on the fields at different moments of the crop cycle (Table 10 and Table 11). Overall, only limited differences were observed between the cultivars over the years, regardless of the presence of weeds. These differences, when statistically relevant, occurred in particular in the period ranging from the end of the winter season to the beginning of spring time (March and April). In Cigliano, in the first two seasons the differences are likely attributable mainly to the presence of weeds within the plots, while in 2015/2016 season they could be also associated with the higher plant density measured on “Illico” plots (Table 9). During the 2013/2014 growing season the NDVI values observed in NOT-WEEDED plots resulted in being significantly higher than those observed in WEEDED plots, in particular on plots cultivated with the hybrid cultivar. On these plots a weed coverage of about 50% was measured at the time of second assessment.
At the Grugliasco site, observing the data presented in Table 11, it is possible to note differences in NDVI values measured in March over the years both in WEEDED and NOT-WEEDED plots. In the first season (2013/2014) on March 12 NDVI values ranged from 0.66 to 0.77. At a similar period of time for the two following seasons, the NDVI values ranged instead from 0.23 to 0.43. The reasons forf these relevant differences are attributable primarily to the late sowing period and secondarily to low rainfall. Wheat was sowed on October 22/21 in 2013/2014 and 2015/2016, while only on November 2, in 2014/2015. The lowest NDVI values recorded in the last two seasons reflected an initial scarce growth of both cultivars, due, in 2014/2015, to the retarded sowing, while in 2015/2016 because of the scarcity of rainfall over the first three months after sowing. In 2014/2015, on NOT- WEEDED plots, at March and April assessments, the “Illico” cultivar showed significantly higher NDVI values compared to those observed in “Hystar”. As the two cultivars had a similar spike density, this difference was likely due to the higher weed density on “Illico” plots (> 350 plants m−2) compared to “Hystar” plots (172 plants m−2) (Table 4). In the following season, at the first NDVI assessments carried out in February and March, on WEEDED plots the “Illico” cultivar showed higher NDVI values than those observed in the “Hystar” cultivar.
4. Discussion
Wheat hybrid cultivars have become of great interest in the last decade. The global food cereal demand for both human and animal consumption is constantly increasing as world population rises and it will reach 3 billion tonnes in 2050 [21,26]. Unlike other cereals, such as rice and maize, where the spread of hybrids is already affirmed, research activities and large-scale adoption in wheat are still relatively limited [20]. The main advantage attributable to hybrid cultivars is their high productivity compared to the conventional cultivars despite a considerable reduced seeding rate. A lower seeding rate, which in our experiment was 33% of the conventional variety, leaves more soil free from crop coverage, particularly during the initial part of the season. This could represent an opportunity for weeds, which have more space free for growing. Considering that in Northern Italy most of the wheat farmers apply post-emergence herbicides, from October to March, weeds are free to develop. In hybrid cultivars we might expect a more evident development of weeds during this period, with potential yield losses, competition, and greater weed seed burden for the following seasons.
Previous studies conducted on different wheat genotypes reported that with doubling the seeding rate, yield losses were significantly reduced due to the suppression of weeds [27].
In this study, weed infestation at the two sites was mainly characterized by the presence of weeds with early growth pattern, such as Stellaria media, Veronica persica, Matricharia chamomilla, Viola arvensis, and Ranunculus repens. These species have a lower competitive ability than other more troublesome wheat weed species (eg. Galium aparine L., Avena sterilis L., Lolium multiflorum Lamark, Papaver rhoeas (L.) [28]. Overall, weed infestation at Grugliasco was much higher than that observed at Cigliano and some weeds were not typical cereal weeds (eg. Ranunculus repens, Rumex spp.). This difference is plausibly related to the agronomic history of the fields while over the last few years, these fields, until 2012/2013, were covered by a permanent grassland. It is well known how the agricultural management system may affect the weed seed bank density as well as its composition [29]. If inserted within a rotation, meadows have generally a cleansing effect on the seed bank [30]; however, in annual crops that follow a meadow, some weeds that are not typical of the weed communities infesting these crops may spread and become abundant in the first seasons. Grass in the rotation can potentially increase some weed species such as Poa spp. and Matricaria spp. [31]. Similarly, the repeated application of herbicides for weed control in conventional systems may lead to a shift of weed composition, in terms of seed numbers and weed species [32]. When herbicides are the major agricultural tool, a reduction in species composition is also expected [29].
Weed crop competition generally causes a significant reduction in crop yield [33,34]. At both sites, the limited weed infestation did not lead to statistically significant yield reduction in either cultivar. The reduced seeding rate adopted in the hybrid cultivar left more bared soil, however this free space was not occupied by weeds as winter cereals show a certain ability to compete with weeds, but the magnitude of this ability depends on the cultivar [12,13,34]. The new modern cultivars are more productive, shorter, and with a higher harvest index than the older ones, but their yield potential is only expressed when effective chemical weed control programs are adopted [27]. A high crop density can generally hamper the growth of some weed species with the exception of those able to overhang the crop canopy [28]. Weiner et al., [35] suggested that a more crowded and uniform distribution of the crop may represent an effective strategy of weed control. Moreover, competition may affect wheat yield especially when it occurs late in the cycle [33,35]. However, if weeds are not highly competitive or have an early period of growth, they have scarce effect on crop yield [28]. Our results showed that despite the initial reduced seeding rate, at the early dough stage, no differences in spike density were observed between hybrid and conventional cultivar. In our experimental conditions, the hybrid cultivar fully recovered the initial gap exploiting its high tillering ability. Overall, the two cultivars had generally not dissimilar yields within the same year and only showed variations across the years due to the differences in the meteorological conditions. Even in the absence of chemical control, the wheat did not face severe weed competition, regardless of the cultivar.
Over the years, at both sites, “Illico” cultivar showed the highest test weight values. Occasionally, the test weight was significantly higher in weeded plots than plots not weeded. In these cases, the highest weed density or a more relevant weed cover was observed. Considering the observed lack of differences between varieties in terms of yield, the impact of weeds appears to be more qualitative than quantitative. The differences observed in this yield parameter are related to the specific characteristics of each cultivar and may be influenced by grain moisture [36,37,38,39]. The presence of weeds is generally associated with an increase in the humidity rate of the grain [40]. This is because at the time of harvest the crop has already ended its cycle while weeds may be still in active photosynthetic activity [40]. Without the presence of weed infestation, “Illico” had the driest grain compared to the hybrid cultivar. On the contrary, on infested plots the presence of weeds probably increased the humidity rate of the conventional cultivar, bringing it close to the moisture values detected on the hybrid variety, without statistical differences. The presence of weeds may affect the moisture level of the crop microclimate favouring the development of fungal disease, even considering that many weeds are recognized as reservoirs or inoculum of many fungal species [41]. Even a more humid grain at harvest may boost the development of mycotoxigenic fungi [42], making a good weed control, essential.
NDVI is one of the most used spectral reflectance indices. It is commonly used to estimate biomass, LAI (Leaf Area Index), photosynthesis and yield in many cereals, including wheat [43,44]. In our study, NDVI differences between cultivars were generally encountered at the assessments carried out during spring time, from February to April. In these assessments, “Hystar” always had the lower values compared to the conventional cultivar. Differences of NDVI values within each cultivar attributable to the presence (or not) of weeds were observed in both sites only during the 2013–2014 growing season. The NDVI measurements pointed out that even in the case of delayed sowing or a dry period in the first part of the growing seasons, the hybrid cultivar was able to recover the initial density gap when the climatic conditions returned to be favourable to the growth. We may also consider that dryness condition at the early growth stages may give cereals an advantage against some weeds [45], while germination of weed seeds is reduced in the case of low soil moisture [46]. When weed flora is composed of early emerging and less competitive weeds, we might not expect yield contractions even with a high infestation density. The pedoclimatic conditions are also an important factor to be taken into account. In our experimental conditions, despite the initial reduced sowing rate, hybrids were able to achieve the same crop density as the conventional cultivar even in the case of delayed sowing time or the driest meteorological conditions. From the agronomic point of view, in order to minimize the initial risk of less homogeneous soil cover during the first stages of growth of hybrid wheat, it is important, particularly in the cooler environments, to anticipate the sowing time and management of nitrogen fertilization at sowing or at vegetative restart, in order to enhance a proper and quick crop tillering.
In conclusion, on fields characterized by a reduced weed pressure and in the case of weed infestation mostly represented by early emerging weeds, hybrids cultivar may not be significantly affected by yield losses. As the magnitude of weed infestation and its competitiveness are affected by crop rotation history and weed flora composition, the initial hypothesis, postulating that a hybrid variety would be more affected by weed infestation than a comparable conventional variety, was not supported.
Author Contributions
Conceptualization, M.M. and M.B.; data curation, M.M. and S.F.; formal analysis, M.M.; funding acquisition, F.V. and M.B., investigation, M.M. and S.F.; methodology, M.M. and F.V.; supervision, F.V. and M.B.; writing—original draft preparation, M.M.; writing—review and editing, M.M, F.V., M.B. and S.F. All authors have read and agreed to the published version of the manuscript.
Funding
This research received no external funding.
Acknowledgments
The authors thank all the lab. and field technicians who made a valuable contribution during the study. A further acknowledgment needs to be addressed to all farmers who hosted the experimental studies on their fields and collaborated strictly with the present research team through all the study.
Conflicts of Interest
The authors declare no conflict of interest.
References
- Gianessi, L.P. The increasing importance of herbicides in worldwide crop production. Pest Manag. Sci. 2013, 69, 1099–1105. [Google Scholar] [CrossRef] [PubMed]
- Kraehmer, H.; Laber, B.; Rosinger, C.; Schulz, A. Herbicides as Weed Control Agents: State of the Art: I. Weed Control Research and Safener Technology: The Path to Modern Agriculture. Plant Physiol. 2014, 166, 1119. [Google Scholar] [CrossRef] [PubMed] [Green Version]
- MacDonald, J.F. Herbicide Resistance in Plants. In Biotechnology and Sustainable Agriculture—Policy Alternatives; NABC: Ithaca, NY, USA, 1989. [Google Scholar]
- Heap, I. The International Survey of Herbicide Resistant Weeds. In Proceedings of the Brighton Crop Protection Conference, Brighton, UK, 19–20 November 2019; BCPC: Brighton, UK, 2019. [Google Scholar]
- Heap, I. Global perspective of herbicide-resistant weeds. Pest Manag. Sci. 2014, 70, 1306–1315. [Google Scholar] [CrossRef] [PubMed]
- Upadhyaya, M.K.; Blackshaw, R.E. Non-Chemical Weed Management: Principles, Concepts and Technology; CABI: Wallingford, Oxfordshire, UK, 2007; ISBN 1-84593-290-0. [Google Scholar]
- Van der Meulen, A.; Chauhan, B.S. A review of weed management in wheat using crop competition. Crop Prot. 2017, 95, 38–44. [Google Scholar] [CrossRef]
- Jannink, J.-L.; Orf, J.H.; Jordan, N.R.; Shaw, R.G. Index Selection for Weed Suppressive Ability in Soybean Contribution No. 00-13-0146 of the Minnesota Agric. Exp. Stn., Univ. of Minnesota, St. Paul, MN. 1 Mention of any product is for scientific purposes only and does not imply endorsement by the Minnesota Agricultural Experiment Station. Crop Sci. 2000, 40, 1087–1094. [Google Scholar]
- Zhao, D.L. Weed Competitiveness and Yielding Ability of Aerobic Rice Genotypes. Ph.D. Thesis, Wageningen University, Wageningen, The Netherlands, 2006. [Google Scholar]
- Jordan, N. Prospects for weed control through crop interference. Ecol. Appl. 1993, 3, 84–91. [Google Scholar] [CrossRef]
- Ni, H.; Moody, K.; Robles, R.; Paller, E.; Lales, J. Oryza sativa plant traits conferring competitive ability against weeds. Weed Sci. 2000, 48, 200–204. [Google Scholar] [CrossRef]
- Mason, H.E.; Spaner, D. Competitive ability of wheat in conventional and organic management systems: A review of the literature. Can. J. Plant Sci. 2006, 86, 333–343. [Google Scholar] [CrossRef]
- Mason, H.E.; Navabi, A.; Frick, B.L.; O’Donovan, J.T.; Spaner, D.M. The Weed-Competitive Ability of Canada Western Red Spring Wheat Cultivars Grown under Organic Management. Crop Sci. 2007, 47, 1167–1176. [Google Scholar] [CrossRef]
- Sardana, V.; Mahajan, G.; Jabran, K.; Chauhan, B.S. Role of competition in managing weeds: An introduction to the special issue. Crop Prot. 2017, 95, 1–7. [Google Scholar] [CrossRef]
- Davies, D.; Welsh, J. Weed Control in Organic Cereals and Pulses; Chalcombe Publications: Bedfordshire, UK, 2002; pp. 77–114. [Google Scholar]
- Holt, J.S. Plant responses to light: A potential tool for weed management. Weed Sci. 1995, 43, 474–482. [Google Scholar] [CrossRef]
- Singh, B.; Dhaka, A.; Pannu, R.; Kumar, S. Integrated weed management-a strategy for sustainable wheat production-a review. Agric. Rev. 2013, 34, 243–255. [Google Scholar] [CrossRef]
- Borger, C.P.D.; Hashem, A.; Pathan, S. Manipulating crop orientation to suppress weeds and increase crop yield. Weed Sci. 2010, 58, 174–178. [Google Scholar] [CrossRef]
- Alexandratos, N.; Bruinsma, J. World Agriculture towards 2030/2050: The 2012 Revision 2012; FAO: Roma, Italy, 2012. [Google Scholar]
- Whitford, R.; Fleury, D.; Reif, J.C.; Garcia, M.; Okada, T.; Korzun, V.; Langridge, P. Hybrid breeding in wheat: Technologies to improve hybrid wheat seed production. J. Exp. Bot. 2013, 64, 5411–5428. [Google Scholar] [CrossRef] [Green Version]
- FAO. The Future of Food and Agriculture Trends and Challenges; FAO: Roma, Italy, 2017. [Google Scholar]
- Informatore Agrario. Frumento Ibrido: Cos’è e Quali Benefici Apporta; Informatore Agrario-Supplemento, Edizioni l’informatore agrario: Verona, Italy, 2015; pp. 4–5. [Google Scholar]
- Tartarini, E. Superfici a Frumento Ibrido in Europa ed in Italia (Total Area Cultivated with Hybrids Wheat in Europe and Italy); RV Venturoli srl: Pianoro (BO), Italy, 2019. [Google Scholar]
- Govaerts, B.; Verhulst, N. The Normalized Difference Vegetation Index (NDVI) Greenseeker (TM) Handheld Sensor: Toward the Integrated Evaluation of Crop Management Part A: Concepts and Case Studies; International Maize and Wheat Improvement Center: Mexico City, Mexico, 2010. [Google Scholar]
- Lancashire, P.D.; Bleiholder, H.; Boom, T.V.D.; Langelüddeke, P.; Stauss, R.; Weber, E.; Witzenberger, A. A uniform decimal code for growth stages of crops and weeds. Ann. Appl. Biol. 1991, 119, 561–601. [Google Scholar] [CrossRef]
- FAO. Global Agriculture towards 2050; FAO: Roma, Italy, 2009. [Google Scholar]
- Lemerle, D.; Verbeek, B.; Cousens, R.; Coombes, N. The potential for selecting wheat varieties strongly competitive against weeds. Weed Res. 1996, 36, 505–513. [Google Scholar] [CrossRef]
- Wilson, B.; Wright, K.J. Predicting the growth and competitive effects of annual weeds in wheat. Weed Res. 1990, 30, 201–211. [Google Scholar] [CrossRef]
- Menalled, F.D.; Gross, K.L.; Hammond, M. Weed aboveground and seedbank community responses to agricultural management systems. Ecol. Appl. 2001, 11, 1586–1601. [Google Scholar] [CrossRef]
- Tomasoni, C.; Borrelli, L.; Pecetti, L. Influence of fodder crop rotations on the potential weed flora in the irrigated lowlands of Lombardy, Italy. Eur. J. Agron. 2003, 19, 439–451. [Google Scholar] [CrossRef]
- Davies, D. Changes in weed populations in the conversion of two arable farms to organic farming. In Proceedings of the Brighton Crop Protection Conference: Weeds, Brighton, UK, 17–20 November 1997; pp. 973–978. [Google Scholar]
- Ball, D.A. Weed Seedbank Response to Tillage, Herbicides, and Crop Rotation Sequence. Weed Sci. 1992, 40, 654–659. [Google Scholar] [CrossRef]
- Das, T.; Yaduraju, N. Effect of weed competition on growth, nutrient uptake and yield of wheat as affected by irrigation and fertilizers. J. Agric. Sci. 1999, 133, 45–51. [Google Scholar] [CrossRef] [Green Version]
- Siddiqui, I.; Bajwa, R.; Huma, Z.-E.; Javaid, A. Effect of six problematic weeds on growth and yield of wheat. Pak. J. Bot. 2010, 4, 2461–2471. [Google Scholar]
- Weiner, J.; Griepentrog, H.-W.; Kristensen, L. Suppression of weeds by spring wheat Triticum aestivum increases with crop density and spatial uniformity. J. Appl. Ecol. 2001, 38, 784–790. [Google Scholar] [CrossRef]
- Pushman, F.M. The effects of alteration of grain moisture content by wetting or drying on the test weight of four winter wheats. J. Agric. Sci. 1975, 84, 187–190. [Google Scholar] [CrossRef]
- Tkachuk, R.; Kuzina, F. Wheat: Relations between some physical and chemical properties. Can. J. Plant Sci. 1979, 59, 15–20. [Google Scholar] [CrossRef]
- Troccoli, A.; Borrelli, G.M.; De Vita, P.; Fares, C.; Di Fonzo, N. Mini Review: Durum Wheat Quality: A Multidisciplinary Concept. J. Cereal Sci. 2000, 32, 99–113. [Google Scholar] [CrossRef]
- Fogliatto, S.; Milan, M.; De Palo, F.; Ferrero, A.; Vidotto, F. Effectiveness of mechanical weed control on Italian flint varieties of maize. Renew. Agric. Food Syst. 2018, 34, 447–459. [Google Scholar] [CrossRef] [Green Version]
- Burnside, O.; Wicks, G. The effect of weed removal treatments on sorghum growth. Weeds 1967, 15, 204–207. [Google Scholar] [CrossRef]
- Dastjerdi, R. High Fumonisin Content in Maize: Search for Source of Infection and Biological Function. Ph.D. Thesis, Niedersächsische Staats-und Universitätsbibliothek Göttingen, Göttingen, Germany, 2014. [Google Scholar]
- Ono, E.; Sasaki, E.; Hashimoto, E.; Hara, L.; Correa, B.; Itano, E.; Sugiura, T.; Ueno, Y.; Hirooka, E. Post-harvest storage of corn: Effect of beginning moisture content on mycoflora and fumonisin contamination. Food Addit. Contam. 2002, 19, 1081–1090. [Google Scholar] [CrossRef]
- Aparicio, N.; Villegas, D.; Casadesus, J.; Araus, J.L.; Royo, C. Spectral Vegetation Indices as Nondestructive Tools for Determining Durum Wheat Yield. Agron. J. 2000, 92, 83–91. [Google Scholar] [CrossRef]
- Royo, C.; Aparicio, N.; Villegas, D.; Casadesus, J.; Monneveux, P.; Araus, J.L. Usefulness of spectral reflectance indices as durum wheat yield predictors under contrasting Mediterranean conditions. Int. J. Remote Sens. 2003, 24, 4403–4419. [Google Scholar] [CrossRef]
- Pavlychenko, T.K.; Harrington, J.B. Competitive efficiency of weeds and cereal crops. Can. J. Res. 1934, 10, 77–94. [Google Scholar] [CrossRef]
- Locke, M.A.; Reddy, K.N.; Zablotowicz, R.M. Weed management in conservation crop production systems. Weed Biol. Manag. 2002, 2, 123–132. [Google Scholar] [CrossRef]
Figure 1.
Geographical localization of the study area. The two red icons on the left image identify the two experimental locations.
Figure 1.
Geographical localization of the study area. The two red icons on the left image identify the two experimental locations.


Table 1.
Wheat growth stage according to the BBCH scale [25] at the time of weed assessments carried out in the period 2012–2016 at the two locations.
Table 1.
Wheat growth stage according to the BBCH scale [25] at the time of weed assessments carried out in the period 2012–2016 at the two locations.
| Location | Season | First Assessment | Second Assessment | ||
|---|---|---|---|---|---|
| Crop BBCH Stage | Crop BBCH Stage | ||||
| “Hystar” | “Illico” | “Hystar” | “Illico” | ||
| Cigliano | 2012–2013 | 31/32 | 31/32 | 50/51 | 50/51 |
| 2013–2014 | 32/33 | 32/33 | 62/63 | 64/65 | |
| 2015–2016 | 30/31 | 30/31 | 64/65 | 64/65 | |
| Grugliasco | 2013–2014 | 30/31 | 30/31 | 39/40 | 39/40 |
| 2014–2015 | 32/33 | 32/33 | 80/81 | 80/81 | |
| 2015–2016 | 30/31 | 30/31 | 77/78 | 77/78 | |
Table 2.
Monthly rainfall and growing degree days (GDD) observed at Cigliano from sowing to the end of ripening in the period 2012–2016 ¥.
Table 2.
Monthly rainfall and growing degree days (GDD) observed at Cigliano from sowing to the end of ripening in the period 2012–2016 ¥.
| 2012–2013 | 2013–2014 | 2015–2016 | ||||
|---|---|---|---|---|---|---|
| Month | Rainfall (mm) | GDD (°C-Day) | Rainfall (mm) | GDD (°C-Day) | Rainfall (mm) | GDD (°C-Day) |
| November | 182.4 | 272.4 | 67.6 | 251.3 | 4.6 | 270.2 |
| December | 10.6 | 112.7 | 139.2 | 168.7 | 3.8 | 163.5 |
| January | 16.8 | 142.2 | 117.2 | 148.6 | 13.6 | 119.4 |
| February | 40.4 | 110.1 | 128.8 | 178.7 | 120.2 | 157.5 |
| March | 118.0 | 208.2 | 71.0 | 335.1 | 52.4 | 251.9 |
| April | 164.8 | 398.0 | 137.6 | 428.0 | 36.6 | 404.8 |
| May | 160.8 | 479.6 | 84.4 | 514.6 | 171.4 | 489.6 |
| June | 16.4 | 619.8 | 143.8 | 636.8 | 83.4 | 624.0 |
| Nov.-June | 710.2 | 2342.9 | 889.6 | 2661.7 | 486.0 | 2480.7 |
| Nov.-Mar | 368.2 | 845.5 | 523.8 | 1082.3 | 194.6 | 962.4 |
| April-June | 342.0 | 1497.4 | 365.8 | 1579.4 | 291.4 | 1518.3 |
¥ Data from agrometeorological service of Regione Piemonte. GDD: Accumulated growing degree days for each month using a 0 °C base.
Table 3.
Monthly rainfall and growing degree days (GDD) observed at Grugliasco from sowing to the end of ripening in the period 2013–2016 ¥.
Table 3.
Monthly rainfall and growing degree days (GDD) observed at Grugliasco from sowing to the end of ripening in the period 2013–2016 ¥.
| 2013–2014 | 2014–2015 | 2015–2016 | ||||
|---|---|---|---|---|---|---|
| Month | Rainfall (mm) | GDD (°C-Day) | Rainfall (mm) | GDD (°C-Day) | Rainfall (mm) | GDD (°C-Day) |
| November | 118.8 | 272.25 | 255.2 | 308.1 | 2.6 | 301.8 |
| December | 82.4 | 168.5 | 61.4 | 200.7 | 2.8 | 189.55 |
| January | 83.4 | 166.4 | 21 | 166.95 | 9 | 163.25 |
| February | 119.8 | 188.3 | 103.4 | 144.05 | 136.2 | 193.7 |
| March | 89.2 | 346.9 | 119.6 | 320.75 | 80.8 | 303.4 |
| April | 79.2 | 450.05 | 81 | 435.55 | 66.4 | 441.55 |
| May | 59.4 | 533.8 | 46.8 | 584.2 | 119.2 | 518.45 |
| June | 102.4 | 648.85 | 141.6 | 674.3 | 41.2 | 644.55 |
| Nov.-June | 734.6 | 2755.0 | 830 | 2834.5 | 458.2 | 2756.2 |
| Nov.-Mar | 493.6 | 1142.3 | 560.6 | 1140.5 | 231.4 | 1151.7 |
| April-June | 241.0 | 1632.7 | 269.4 | 1694.0 | 226.8 | 1604.5 |
¥ Data from agrometeorological service of Regione Piemonte. GDD: Accumulated growing degree days for each month using a 0 °C base.
Table 4.
Weed density measured at the two locations in the period 2012–2016 on WEEDED plots.
| Location | Weed Density (Plants m−2) | ||||
|---|---|---|---|---|---|
| First Assessment | Second Assessment | ||||
| “Hystar” | “Illico” | “Hystar” | “Illico” | ||
| Cigliano | 2012/2013 | 109.0 ψ | 102.0 | 198.0 * ψ | 128.0 * |
| 2013/2014 | 50.7 | 51.0 | 56.0 | 60.8 | |
| 2015/2016 | 9.3 ψ | 13.3 ψ | 46.7 ψ | 38.7 ψ | |
| Grugliasco | 2013/2014 | 312.0 | 414.7 ψ | 242.9 * | 161.3 * ψ |
| 2014/2015 | 172.0 * ψ | 350.7 * ψ | 248.3 ψ | 190.7 ψ | |
| 2015/2016 | 142.7 | 126.5 | 128.0 | 149.3 | |
Notes: * Statistical differences between cultivars within the same assessment (“Hystar” vs “Illico”); ψ Statistical differences between assessment within each cultivar (I° assessment vs II° assessment). “Histar” (hybrid); “Illico” (conventional).
Table 5.
Weed cover (percent of ground cover) measured at the two locations in the period 2012–2016 on WEEDED plots.
Table 5.
Weed cover (percent of ground cover) measured at the two locations in the period 2012–2016 on WEEDED plots.
| Location | Weed Cover (%) | ||||
|---|---|---|---|---|---|
| First Assessment | Second Assessment | ||||
| “Hystar” | “Illico” | “Hystar” | “Illico” | ||
| Cigliano | 2012/2013 | 10.1 ψ | 8.1 ψ | 37.5 * ψ | 16.7 * ψ |
| 2013/2014 | 13.6 ψ | 19.9 ψ | 55.0 ψ | 48.0 ψ | |
| 2015/2016 | 3.6 | 3.8 | 4.4 | 4.9 | |
| Grugliasco | 2013/2014 | 11.5 ψ | 14.7 ψ | 52.9 * ψ | 36.7 * ψ |
| 2014/2015 | 15.0 ψ | 16.7 ψ | 37.9 * ψ | 25.5 * ψ | |
| 2015/2016 | 16.2 * ψ | 10.8 ψ | 47.5 * ψ | 27.9 * ψ | |
Notes: * Statistical differences between cultivars within the same assessment (“Hystar” vs “Illico”); ψ Statistical differences between assessment within each cultivar (I° assessment vs II° assessment). “Histar” (hybrid); “Illico” (conventional).
Table 6.
Grain yields recorded at the two locations in the studied period.
| Location | Year | Grain Yield (t ha−1) | |||
|---|---|---|---|---|---|
| WEEDED | NOT-WEEDED | ||||
| “Hystar” | “Illico” | “Hystar” | “Illico” | ||
| Cigliano | 2012–2013 | 6.12 ψ | 6.33 | 7.48 ψ | 7.21 |
| 2013–2014 | 8.41 | 8.03 | 8.18 | 8.08 | |
| 2015–2016 | 8.37 * | 7.23 * | 8.23 | 7.61 | |
| Grugliasco | 2013–2014 | 8.74 | 9.49 | 8.20 | 9.59 |
| 2014–2015 | 7.10 | 7.44 | 7.00 | 7.60 | |
| 2015–2016 | 6.96 | 7.52 | 6.03 | 6.80 | |
Notes: * Statistical differences between cultivars within the same treatment (WEEDED/NOT WEEDED); ψ Statistical differences between treatments within each cultivar (WEEDED vs NOT WEEDED).
Table 7.
Test weight measured at the harvest in the two locations.
| Location | Year | Test Weight (kg hl−1) | |||
|---|---|---|---|---|---|
| WEEDED | NOT-WEEDED | ||||
| “Hystar” | “Illico” | “Hystar” | “Illico” | ||
| Cigliano | 2012–2013 | 77.66 * | 81.84 * | 78.05 * | 80.94 * |
| 2013–2014 | 73.85 * | 76.01 * | 73.61 | 75.42 | |
| 2015–2016 | 77.09 ψ | 80.76 | 77.76 ψ | 81.04 | |
| Grugliasco | 2013–2014 | 72.02 * ψ | 75.17 * ψ | 69.79 * ψ | 73.74 * ψ |
| 2014–2015 | 73.89 * | 78.89 * | 72.37 * | 78.89 * | |
| 2015–2016 | 77.15 * | 81.15* ψ | 75.95 * | 78.97 * ψ | |
Notes: * Statistical differences between cultivars within the same treatment (WEEDED/NOT WEEDED); ψ Statistical differences between treatments within each cultivar (WEEDED vs NOT- WEEDED).
Table 8.
Grain moisture measured at the harvest in the two locations.
| Location | Year | Grain Moisture (%) | |||
|---|---|---|---|---|---|
| WEEDED | NOT-WEEDED | ||||
| “Hystar” | “Illico” | “Hystar” | “Illico” | ||
| Cigliano | 2012–2013 | 12.31* ψ | 12.14* ψ | 13.56 ψ | 13.14 ψ |
| 2013–2014 | 15.34 * | 14.92 * | 15.04 | 15.04 | |
| 2015–2016 | 13.91 ψ | 13.82 ψ | 13.36 ψ | 13.77 ψ | |
| Grugliasco | 2013–2014 | 15.51* ψ | 14.84* ψ | 17.50* ψ | 15.61* ψ |
| 2014–2015 | 12.90 * | 13.49 * | 13.89 | 13.41 | |
| 2015–2016 | 12.66* ψ | 12.61* ψ | 13.79 ψ | 14.01 ψ | |
Notes: * Statistical differences between cultivars within the same treatment (WEEDED/NOT WEEDED); ψ Statistical differences between treatments within each cultivar (WEEDED vs NOT- WEEDED).
Table 9.
Spikes density recorded at the two locations in the studied period.
| Location | Year | Spikes Density (Spikes m−2) | |||
|---|---|---|---|---|---|
| WEEDED | NOT-WEEDED | ||||
| “Hystar” | “Illico” | “Hystar” | “Illico” | ||
| Cigliano | 2012–2013 | 353.12 | 407.81 | 343.75 | 416.87 |
| 2013–2014 | 463.90 * | 591.85 * ψ | 508.66 | 477.14 ψ | |
| 2015–2016 | 686.61 | 723.21 | 601.82 * | 723.21 * | |
| Grugliasco | 2013–2014 | 467.16 | 448.57 | 485.45 | 565.25 |
| 2014–2015 | 428.26 | 448.57 | 375.72 | 448.21 | |
| 2015–2016 | 500.41 | 500.00 | 503.74 | 514.29 | |
Notes: * Statistical differences between cultivars within the same treatment (WEEDED/NOT WEEDED); ψ Statistical differences between treatments within each cultivar (WEEDED vs NOT- WEEDED).
Table 10.
Normalized Difference Vegetation Index (NDVI) values recorded at Cigliano in the period 2012–2013, 2013–2014 and 2015–2016.
Table 10.
Normalized Difference Vegetation Index (NDVI) values recorded at Cigliano in the period 2012–2013, 2013–2014 and 2015–2016.
| NDVI | |||||
|---|---|---|---|---|---|
| WEEDED | NOT-WEEDED | ||||
| Date | “Hystar” | “Illico” | “Hystar” | “Illico” | |
| 2012/2013 | Apr 2 | 0.63 * | 0.73 * | 0.68 | 0.73 |
| Apr 15 | 0.71 | 0.78 | 0.77 | 0.79 | |
| May 6 | 0.82 | 0.87 | 0.82 | 0.85 | |
| May 20 | 0.81 | 0.81 | 0.83 | 0.83 | |
| May 28 | 0.78 | 0.81 | 0.81 | 0.82 | |
| 2013/2014 | Mar 7 | 0.66 | 0.60 | 0.67 | 0.72 |
| Mar 20 | 0.68 * | 0.72 * | 0.74 * | 0.86 * | |
| Mar 31 | 0.69 *ψ | 0.75 *ψ | 0.81 ψ | 0.83 ψ | |
| Apr 8 | 0.69 ψ | 0.77 ψ | 0.82 ψ | 0.83 ψ | |
| Apr 16 | 0.67 ψ | 0.75 | 0.80 ψ | 0.78 | |
| Apr 23 | 0.72 ψ | 0.79 | 0.82 ψ | 0.81 | |
| May 5 | 0.74 | 0.78 | 0.80 | 0.77 | |
| May 13 | 0.68 | 0.66 | 0.68 | 0.68 | |
| 2015/2016 | Feb 23 | 0.62 | 0.57 | 0.63 | 0.58 |
| Mar 4 | 0.66 * | 0.58 * | 0.68 | 0.60 | |
| Mar 15 | 0.73 | 0.66 | 0.73 | 0.67 | |
| Mar 24 | 0.73 | 0.71 | 0.75 | 0.72 | |
| Apr 6 | 0.73 | 0.73 | 0.75 | 0.75 | |
| Apr 15 | 0.81 | 0.80 | 0.81 | 0.83 | |
| May 3 | 0.87 | 0.88 | 0.86 | 0.86 | |
| May 13 | 0.85 | 0.86 | 0.86 | 0.86 | |
Notes: * Statistical differences between cultivars within the same treatment (WEEDED/NOT- WEEDED); ψ Statistical differences between treatments within each cultivar (WEEDED vs NOT- WEEDED).
Table 11.
NDVI values recorded at Grugliasco in the period 2013–2014, 2014–2015 and 2015–2016.
| NDVI | |||||
|---|---|---|---|---|---|
| WEEDED | NOT-WEEDED | ||||
| Date | “Hystar” | “Illico” | “Hystar” | “Illico” | |
| 2013/2014 | Mar 12 | 0.71 | 0.77 | 0.66 | 0.76 |
| Mar 24 | 0.81 | 0.79 | 0.79 | 0.86 | |
| Apr 4 | 0.76 ψ | 0.82 ψ | 0.88 ψ | 0.90 ψ | |
| Apr 11 | 0.70 *ψ | 0.77 * | 0.79 ψ | 0.82 | |
| Apr 22 | 0.77 ψ | 0.79 | 0.84 ψ | 0.83 | |
| May 8 | 0.75 | 0.77 | 0.78 | 0.78 | |
| 2014/2015 | Mar 10 | 0.25 * | 0.37 * | 0.23 * | 0.43 * |
| Mar 23 | 0.44 | 0.58 | 0.41 * | 0.61 * | |
| Apr 1 | 0.52 | 0.67 | 0.48 * | 0.71 * | |
| Apr 14 | 0.59 | 0.69 | 0.62 * | 0.75 * | |
| Apr 24 | 0.75 | 0.76 | 0.77 | 0.81 | |
| May 5 | 0.78 | 0.76 | 0.79 | 0.77 | |
| May 14 | 0.74 | 0.74 | 0.72 | 0.73 | |
| 2015/2016 | Feb 26 | 0.26 * | 0.38 * | 0.28 * | 0.33 * |
| Mar 8 | 0.33 * | 0.50 * | 0.36 | 0.39 | |
| Mar 22 | 0.47 * | 0.68 * | 0.55 | 0.56 | |
| Apr 5 | 0.69 | 0.75 | 0.76 | 0.72 | |
| Apr 14 | 0.76 | 0.76 | 0.81 | 0.74 | |
| May 5 | 0.83 | 0.81 | 0.86 | 0.84 | |
| May 19 | 0.78 | 0.80 | 0.79 | 0.81 | |
Notes: * Statistical differences between cultivars within the same treatment (WEEDED/NOT- WEEDED); ψ Statistical differences between treatments within each cultivar (WEEDED vs NOT-WEEDED).
© 2020 by the authors. Licensee MDPI, Basel, Switzerland. This article is an open access article distributed under the terms and conditions of the Creative Commons Attribution (CC BY) license (http://creativecommons.org/licenses/by/4.0/).
Share and Cite
MDPI and ACS Style
Milan, M.; Fogliatto, S.; Blandino, M.; Vidotto, F. Are Wheat Hybrids More Affected by Weed Competition than Conventional Cultivars? Agronomy 2020, 10, 526. https://doi.org/10.3390/agronomy10040526
AMA Style
Milan M, Fogliatto S, Blandino M, Vidotto F. Are Wheat Hybrids More Affected by Weed Competition than Conventional Cultivars? Agronomy. 2020; 10(4):526. https://doi.org/10.3390/agronomy10040526
Chicago/Turabian StyleMilan, Marco, Silvia Fogliatto, Massimo Blandino, and Francesco Vidotto. 2020. "Are Wheat Hybrids More Affected by Weed Competition than Conventional Cultivars?" Agronomy 10, no. 4: 526. https://doi.org/10.3390/agronomy10040526
Note that from the first issue of 2016, this journal uses article numbers instead of page numbers. See further details here.