Agricultural Systems ( IF 6.6 ) Pub Date : 2023-05-04 , DOI: 10.1016/j.agsy.2023.103667 Anselme K.K. Kouame , Prem S. Bindraban , Isaac N. Kissiedu , Williams K. Atakora , Khalil El Mejahed
|
CONTEXT
Maize is the main cereal crop in Ghana, but its production is adversely affected by various biotic and abiotic factors.
OBJECTIVE
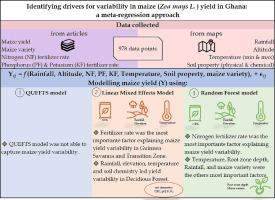
This study aimed to highlight the factors related to maize yield variability. To this end, yields from 978 data points within 3 agro-ecological zones (AEZs) were used in crop-based and statistical modelling.
METHODS
The QUantitative Evaluation of the Fertility of Tropical Soils (QUEFTS) model, the Linear Mixed Effects Model (LMM), and the Random Forest (RF) model were used to evaluate multiple effect sizes.
RESULTS AND CONCLUSIONS
Analyzing an entire set of yield data points with QUEFTS, and LMM explained 19%, and 26% of yield variability, respectively. Considering all data points in the RF model, nitrogen fertilizer (NF) rate, temperature, root zone depth, rainfall, and variety accounted for 27%, 15%, 13%, 10%, and 9% of yield variation, respectively. In Guinea Savanna (GS), Transition Zone (TZ), and Deciduous Forest (DF), QUEFTS explained 30%, 20%, and 4% of yield variability, respectively. LMM, however, explained 47%, 51%, and 79% of yield variability in those AEZs. LMM showed that the phosphorus fertilizer (PF) rate was very important and exceeded the importance of the NF rate in GS. LMM showed also that yield variability was significantly related to maize variety at the AEZ scale. In DF, soil chemistry (marginal R2 = R2m = 0.48) and environmental variables (R2m = 0.43) contributed more to explaining yield variability, whereas in GS and TZ, fertilizer rates (R2m = 0.35 in GS and 0.26 in TZ) and variety (R2m = 0.04 in GS and 0.20 in TZ) played a much larger role. In GS, TZ, and DF, the RF model explained 74%, 79%, and 84% of the variance in yield, respectively. These findings suggest low impact of fertilization on yield on the inherently fertile soils in the DF, while fertilization drives yield increase in the less fertile TZ and GS AEZs. We may conclude that QUEFTS was unable to capture yield variability and, according to RF and LMM analysis, the NF rate was the most important factor in explaining yield variability in the data. It can also be concluded that the factors responsible for yield variability are AEZ dependent.
SIGNIFICANCE
We discuss the implications of these findings to uncover factors driving maize yield variability. It also provides information to guide and prioritize actions to be taken based on the importance of these factors in contributing to yield variability.
中文翻译:
确定加纳玉米 (Zea mays L.) 产量变异性的驱动因素:元回归方法
语境
玉米是加纳的主要谷类作物,但其产量受到各种生物和非生物因素的不利影响。
客观的
本研究旨在强调与玉米产量变异性相关的因素。为此,来自 3 个农业生态区 (AEZ) 内 978 个数据点的产量被用于基于作物的统计建模。
方法
热带土壤肥力的定量评估 (QUEFTS) 模型、线性混合效应模型 (LMM) 和随机森林 (RF) 模型用于评估多个效应大小。
结果和结论
使用 QUEFTS 和 LMM 分析一整套产量数据点,分别解释了 19% 和 26% 的产量变异性。考虑到 RF 模型中的所有数据点,氮肥 (NF) 施用量、温度、根区深度、降雨量和品种分别占产量变化的 27%、15%、13%、10% 和 9%。在几内亚稀树草原 (GS)、过渡带 (TZ) 和落叶林 (DF),QUEFTS 分别解释了 30%、20% 和 4% 的产量变异性。然而,LMM 解释了这些 AEZ 中 47%、51% 和 79% 的产量变异性。LMM 表明磷肥 (PF) 率在 GS 中非常重要,超过了 NF 率的重要性。LMM 还表明,在 AEZ 范围内,产量变异性与玉米品种显着相关。在 DF 中,土壤化学(边际 R 2 = R2 m = 0.48) 和环境变量 (R 2 m = 0.43) 对解释产量变异的贡献更大,而在 GS 和 TZ 中,施肥率(GS 中 R 2 m = 0.35,TZ 中为 0.26)和品种(R 2 m = GS 中的 0.04 和 TZ 中的 0.20)发挥了更大的作用。在 GS、TZ 和 DF 中,RF 模型分别解释了 74%、79% 和 84% 的产量差异。这些发现表明施肥对 DF 中固有肥沃土壤的产量影响较小,而施肥会推动不太肥沃的 TZ 和 GS AEZ 的产量增加。我们可以得出结论,QUEFTS 无法捕获产量变异性,并且根据 RF 和 LMM 分析,NF 率是解释数据中产量变异性的最重要因素。还可以得出结论,导致产量变异的因素是 AEZ 依赖性的。
意义
我们讨论了这些发现的意义,以揭示导致玉米产量变异的因素。它还提供信息,以根据这些因素对产量可变性的贡献的重要性来指导和优先采取行动。


 京公网安备 11010802027423号