Agricultural Systems ( IF 6.6 ) Pub Date : 2023-05-04 , DOI: 10.1016/j.agsy.2023.103666 Simone Bregaglio, Fabrizio Ginaldi, Elisabetta Raparelli, Gianni Fila, Sofia Bajocco
|
CONTEXT
The assimilation of Remote Sensing (RS) data into crop models improves the accuracy of yield predictions by considering crop growth dynamics and their spatial heterogeneity due to the different management practices and environmental conditions.
OBJECTIVE
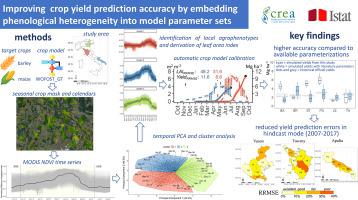
This study proposes a new method for performing sub-regional yield predictions (Nomenclature of territorial units for statistics, NUTS-3 level) using RS time series data and crop models. The primary objective was to release a procedure whereby the heterogeneity of the agricultural landscape (i.e. the agrophenotypes) observed from RS is used to drive crop model calibration.
METHODS
Fine-resolution barley and maize distribution maps (100 m) and related crop calendars have been used to derive the “where” and “when” of the 8-day MODIS NDVI time series data, located in Apulia, Tuscany, and Veneto in 2018–2019. Principal Component Analysis and Hierarchical Clustering have been applied to NDVI seasonal profiles to identify the agrophenotypes, which have been used to derive crop growth and leaf area index dynamics. These data served as the reference to optimize the most relevant parameters of the WOFOST_GT model, using gridded weather data as input (0.25° resolution, Copernicus ERA5). Parameter distributions from multiple automatic calibrations have been sampled to characterize the agricultural heterogeneity within 22 NUTS-3 administrative units. Yield statistics from the Italian National Institute of Statistics have been used as reference data to test the accuracy of the yield simulation by the crop model WOFOST_GT.
RESULTS AND CONCLUSIONS
The agrophenotypes reflected the wide north-south latitudinal gradient experienced in Italy by the two crops, leading to a gap of 15–30 days in barley and maize flowering and harvest dates across the study area. Average Nast-Sutcliffe modelling efficiency in reproducing LAI dynamics from RS (0.6) and Relative Root Mean Square Error (RRMSE) in predicting yield data (12.1% for barley, 3.7% for maize) in hindcast simulations demonstrated the effectiveness of our approach. The average RRMSE was reduced by 32.7% (barley) and 8.5% (maize) compared to baseline, decreasing by 0.7–1 Mg ha−1 absolute yield errors on both crops.
SIGNIFICANCE
The inclusion of local agrophenotypes in the yield prediction workflow reduced errors in yield prediction compared to unsupervised simulations at NUTS-3 level. The script for agrophenotypes extraction and the model parameter sets are released to the scientific community, to foster improvements and further applications to other crops, ecoclimatic regions, satellite sensors and spatial scales.
中文翻译:
通过将物候异质性嵌入模型参数集来提高作物产量预测准确性
语境
将遥感 (RS) 数据同化到作物模型中,通过考虑作物生长动态及其由于不同的管理实践和环境条件而产生的空间异质性,提高了产量预测的准确性。
客观的
本研究提出了一种使用 RS 时间序列数据和作物模型进行次区域产量预测(统计领土单位命名法,NUTS-3 级别)的新方法。主要目标是发布一个程序,利用从 RS 观察到的农业景观的异质性(即农业表型)来驱动作物模型校准。
方法
高分辨率大麦和玉米分布图(100 米)和相关作物日历已用于推导 2018 年位于普利亚、托斯卡纳和威尼托的 8 天 MODIS NDVI 时间序列数据的“位置”和“时间” –2019。主成分分析和层次聚类已应用于 NDVI 季节剖面以识别农业表型,这些表型已用于推导作物生长和叶面积指数动态。这些数据用作优化 WOFOST_GT 模型最相关参数的参考,使用网格天气数据作为输入(0.25° 分辨率,Copernicus ERA5)。对来自多个自动校准的参数分布进行了采样,以表征 22 个 NUTS-3 行政单位内的农业异质性。
结果和结论
农业表型反映了这两种作物在意大利经历的广泛的南北纬度梯度,导致整个研究区域的大麦和玉米开花和收获日期有 15-30 天的差距。从 RS (0.6) 再现 LAI 动力学的平均 Nast-Sutcliffe 建模效率和预测产量数据(大麦 12.1%,玉米 3.7%)的相对均方根误差 (RRMSE) 在后报模拟中证明了我们方法的有效性。与基线相比,平均 RRMSE 降低了 32.7%(大麦)和 8.5%(玉米),两种作物的绝对产量误差降低了 0.7–1 Mg ha −1 。
意义
与 NUTS-3 级别的无监督模拟相比,在产量预测工作流程中包含局部农业表型减少了产量预测的错误。农业表型提取脚本和模型参数集已发布给科学界,以促进对其他作物、生态气候区域、卫星传感器和空间尺度的改进和进一步应用。


 京公网安备 11010802027423号