Nature ( IF 64.8 ) Pub Date : 2022-11-30 , DOI: 10.1038/s41586-022-05355-z Anthony D Campbell 1, 2, 3 , Lola Fatoyinbo 1 , Liza Goldberg 1, 4 , David Lagomasino 5
|
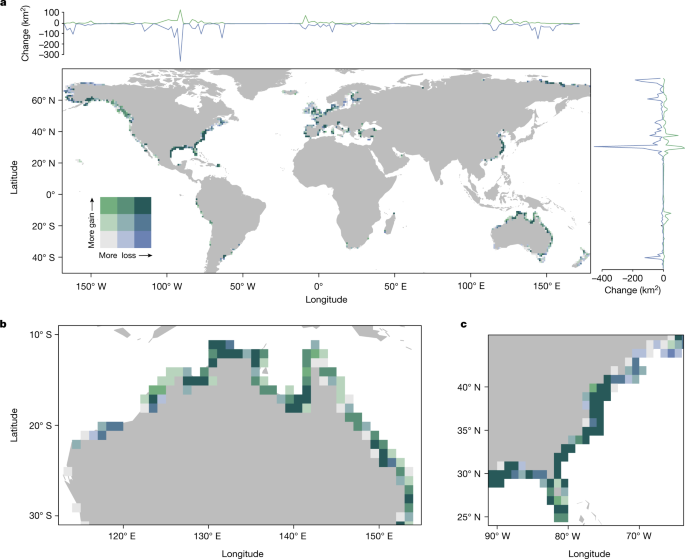
Salt marshes provide ecosystem services such as carbon sequestration1, coastal protection2, sea-level-rise (SLR) adaptation3 and recreation4. SLR5, storm events6, drainage7 and mangrove encroachment8 are known drivers of salt marsh loss. However, the global magnitude and location of changes in salt marsh extent remains uncertain. Here we conduct a global and systematic change analysis of Landsat satellite imagery from the years 2000–2019 to quantify the loss, gain and recovery of salt marsh ecosystems and then estimate the impact of these changes on blue carbon stocks. We show a net salt marsh loss globally, equivalent to an area double the size of Singapore (719 km2), with a loss rate of 0.28% year−1 from 2000 to 2019. Net global losses resulted in 16.3 (0.4–33.2, 90% confidence interval) Tg CO2e year−1 emissions from 2000 to 2019 and a 0.045 (−0.14–0.115) Tg CO2e year−1 reduction of carbon burial. Russia and the USA accounted for 64% of salt marsh losses, driven by hurricanes and coastal erosion. Our findings highlight the vulnerability of salt marsh systems to climatic changes such as SLR and intensification of storms and cyclones.
中文翻译:
全球盐沼变化和碳排放热点
盐沼提供生态系统服务,如碳固存1、海岸保护2、海平面上升 (SLR) 适应3和娱乐4。SLR 5、风暴事件6、排水7和红树林侵占8是盐沼损失的已知驱动因素。然而,全球盐沼范围变化的幅度和位置仍不确定。在这里,我们对 2000 年至 2019 年的 Landsat 卫星图像进行了全球系统的变化分析,以量化盐沼生态系统的损失、增益和恢复,然后估计这些变化对蓝碳储量的影响。我们显示全球盐沼净损失,相当于新加坡面积的两倍(719 km 2 ), 2000 年至 2019 年损失率为 0.28% -1年。全球净损失导致 16.3(0.4-33.2, 90%置信区间)2000年至2019年Tg CO 2 e年−1排放量和碳埋藏量减少0.045(−0.14–0.115)Tg CO 2 e年−1 。由于飓风和海岸侵蚀,俄罗斯和美国造成的盐沼损失占 64%。我们的研究结果强调了盐沼系统对气候变化的脆弱性,例如单反以及风暴和旋风的加剧。


 京公网安备 11010802027423号