MAPAN ( IF 1 ) Pub Date : 2022-07-08 , DOI: 10.1007/s12647-022-00575-0 Shobhna Shankar , Ranu Gadi , S. K. Sharma , T. K. Mandal
|
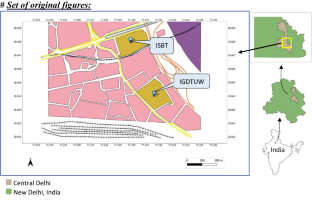
In this study, PM2.5 samples from a traffic-influenced site in old Delhi were collected from January 2021 to June 2021 (January–March, 2021: months with regular activities; April–June, 2021: partially restricted months due to second wave of pandemic) and analysed to assess noteworthy effect on their infrared (IR) spectral features and carbonaceous content viz., organic carbon (OC) and elemental carbon (EC) and their sub-fractions with their link to major sources in the vicinity of the sampling site of Delhi. Absorbance peaks for the structural and functional groups for previously identified compounds associated with vehicular/combustion/biogenic emissions at the site were notable. Intensive peaks for C=C, C–H, O–H and NH4NO3 were observed on certain days pointing towards enhanced emission of the related compounds. Lower spectral peaks were observed for March and first half of April probably due to transitioning meteorological variables and imposed restrictions. Monthly variation in ratios, such as OC/EC, EC/TC and OM/OC, revealed about the probable emission sources. Comparatively higher peaks/values were observed during January, February and June. The overall results followed a general pattern of variation for regular days.
中文翻译:
印度老德里地区 PM2.5 气溶胶的碳质物种鉴定和 FTIR 分析用于源估计
在这项研究中,从 2021 年 1 月至 2021 年 6 月(2021 年 1 月至 3 月:有常规活动的月份;2021 年 4 月至 6 月:由于第二波疫情,部分限制月份),从旧德里一个受交通影响的地点收集了PM 2.5样本。大流行)并进行分析以评估对其红外 (IR) 光谱特征和碳质含量的显着影响,即有机碳 (OC) 和元素碳 (EC) 及其与采样附近主要来源的联系的亚组分德里的网站。先前确定的与现场车辆/燃烧/生物排放相关的化合物的结构和官能团的吸收峰值得注意。C=C、C-H、O-H 和 NH 4 NO 3的强峰在某些日子观察到表明相关化合物的排放增强。3 月和 4 月上半月观察到较低的光谱峰值可能是由于气象变量的转变和施加的限制。OC/EC、EC/TC 和 OM/OC 等比率的月度变化揭示了可能的排放源。在 1 月、2 月和 6 月观察到相对较高的峰值/值。总体结果遵循常规日子的一般变化模式。


 京公网安备 11010802027423号