Science of the Total Environment ( IF 9.8 ) Pub Date : 2021-09-15 , DOI: 10.1016/j.scitotenv.2021.150338 Bin Chen 1 , Zhihao Song 1 , Feng Pan 1 , Yue Huang 1
|
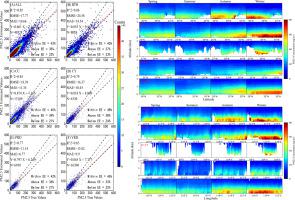
Aerosol optical depth (AOD) has been widely used to estimate the near-surface PM2.5 (fine particulate matter with particle size less than 2.5 μm). However, the total-column AOD obtained by passive remote sensing instruments can neither distinguish the contribution of AOD in various altitude layers nor obtain the vertical PM2.5 concentration. In this study, we compared several AOD-PM2.5 models including Extra Trees (ET), Random Forest (RF), Deep Neural Network (DNN), and Gradient Boosting Regression Tree (GBRT), and analyzed the corresponding results using AOD of different altitudes and auxiliary data from the Cloud-Aerosol Lidar with Orthogonal Polarization (CALIOP). The results indicate that the ET model performs best in terms of the model effectiveness and feature interpretation on the training dataset. We conclude that the feature importance of the bottom layer AOD is higher than that of the upper and total column AOD. The results showed that regional differences existed in the optimal height of the AOD-PM2.5 correlation in study area. The results of cross-validation indicate that ET manages the most appealing overall performance with an R2 (RMSE) of 0.85 (17.77 μg/m3). Regarding the 729 sites involved in this study, 73% had R2 > 0.7, and the region or season with higher AOD feature importance achieves better model performance. The results of the AOD-PM2.5 model in each layer were corrected using the AOD weight, to obtained the PM2.5 vertical concentrations from 2015 to 2019. The results highlight that the high PM2.5 concentration area is primarily near the ground and decreases with height. Additionally, the PM2.5 vertical concentration in Beijing-Tianjin-Hebei (−1.80 μg/m3, P < 0.001), Central China (−1.62 μg/m3, P < 0.001), and Pearl River Delta (−0.66 μg/m3, P < 0.001) show an apparent downward trend. We believe that the vertical distribution analysis of PM2.5 can provide meaningful information for studying air pollution.


 京公网安备 11010802027423号