Ecological Indicators ( IF 6.9 ) Pub Date : 2021-09-08 , DOI: 10.1016/j.ecolind.2021.108188 Baoan Hu 1 , Fengfeng Kang 1 , Hairong Han 1 , Xiaoqin Cheng 1 , Zuzheng Li 1
|
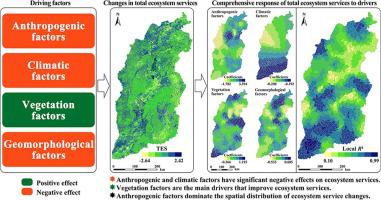
In the past few decades, dominating human development patterns have negatively affected ecosystem services (ESs). To sustainably supply multiple ESs and enhance human well-being, researchers should analyze ESs responses to antagonistic effects. This study uses the InVEST model to evaluate the key ESs of the Shanxi Province in 2000 and 2020. The geographical detector model was used to analyze the dominant factors of the spatial differentiation characteristics of ESs changes. We used the Multi-Scale Geographically Weighted Regression (MGWR) to identify the main drivers of ESs changes and capture the differences in spatial variation. The results were as follows: (1) From 2000 to 2020, soil conservation (SC), carbon storage (CS), grain productivity (GP), and total ecosystem services (TES) increased by 44.48%, 1.03%, 57.84, and 1.67% respectively. Water yield (WY) and habitat quality (HQ) decreased by 1.36% and 0.64%, respectively. (2) The interaction of anthropogenic, climate, vegetation, and geomorphological factors has a significantly greater impact for the spatial differentiation of ESs changes than any single factor, though anthropogenic factors dominate the spatial distribution of regional ESs changes. (3) There is obvious spatial heterogeneity in the properties and intensity of the correlations between driving factors and changes in ESs. Anthropogenic factors have significant negative effects on CS, WY, and HQ changes. Vegetation factors were the main driving force for the improvement of GP and TES, while the climatic factor was the main driving factor for SC changes. (4) The MGWR model achieved the optimal performance, and the four selected driving factors explain 61.9%, 81.3%, 97.1%, 56.7%, 81.6%, and 79.2% of the changes in CS, WY, SC, HQ, GP, and TES, respectively. Based on the results, we suggest that future ecosystem management, planning and decision making, should focus on maintaining the balance between anthropogenic activities and vegetation restoration. This study provides a convenient method to capture the relationship between ESs and drivers in geographic space, and provides a reference for the sustainable supply of ESs in the region and the world.


 京公网安备 11010802027423号