Diabetologia ( IF 8.2 ) Pub Date : 2021-07-26 , DOI: 10.1007/s00125-021-05503-6 An Tran-Duy 1 , Josh Knight 1 , Philip M Clarke 1, 2 , Ann-Marie Svensson 3, 4 , Björn Eliasson 3 , Andrew J Palmer 1, 5
|
Aims/hypothesis
Tables reporting life expectancies by common risk factors are available for individuals with type 2 diabetes; however, there is currently no published equivalent for individuals with type 1 diabetes. We aimed to develop a life expectancy table using a recently published simulation model for individuals with type 1 diabetes.
Methods
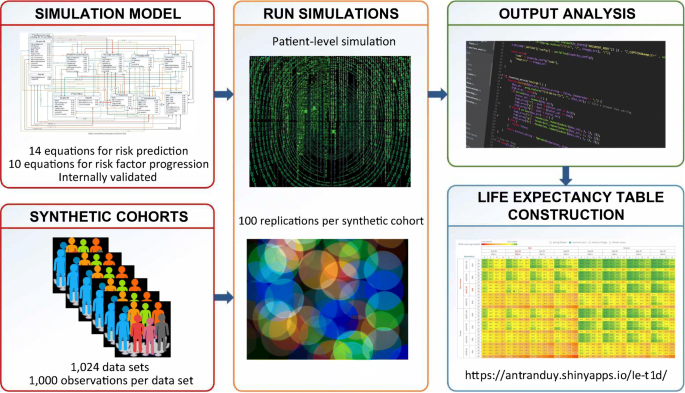
The simulation model was developed using data from a real-world population of patients with type 1 diabetes selected from the Swedish National Diabetes Register. The following six important risk factors were included in the life table: sex; age; current smoking status; BMI; eGFR; and HbA1c. For each of 1024 cells in the life expectancy table, a synthetic cohort containing 1000 individuals was created, with other risk factors assigned values representative of the real-world population. The simulations were executed for all synthetic cohorts and life expectancy for each cell was calculated as mean survival time of the individuals in the respective cohort.
Results
There was a substantial variation in life expectancy across patients with different risk factor levels. Life expectancy of 20-year-old men varied from 29.3 years to 50.6 years, constituting a gap of 21.3 years between those with worst and best risk factor levels. In 20-year-old women, this gap was 18.9 years (life expectancy range 35.0–53.9 years). The variation in life expectancy was a function of the combination of risk factor values, with HbA1c and eGFR consistently showing a negative and positive correlation, respectively, with life expectancy at any level combination of other risk factors. Individuals with the lowest level (20 kg/m2) and highest level of BMI (35 kg/m2) had a lower life expectancy compared with those with a BMI of 25 kg/m2. Non-smokers and women had a higher life expectancy than smokers and men, respectively, with the difference in life expectancy ranging from 0.4 years to 2.7 years between non-smokers and smokers, and from 1.9 years to 5.9 years between women and men, depending on levels of other risk factors.
Conclusions/interpretation
The life expectancy table generated in this study shows a substantial variation in life expectancy across individuals with different modifiable risk factors. The table allows for rapid communications of risk in an easily understood format between healthcare professionals, health economists, researchers, policy makers and patients. Particularly, it supports clinicians in their discussion with patients about the benefits of improving risk factors.
Graphical abstract
中文翻译:
为 1 型糖尿病患者制定预期寿命表
目标/假设
2 型糖尿病患者可使用按常见风险因素报告预期寿命的表格;然而,目前还没有针对 1 型糖尿病患者的等效出版物。我们的目标是使用最近发布的 1 型糖尿病患者模拟模型开发预期寿命表。
方法
该模拟模型是使用从瑞典国家糖尿病登记处选出的真实世界 1 型糖尿病患者群体的数据开发的。生命表中包括以下六个重要危险因素:性别;年龄; 目前的吸烟状况;体重指数;eGFR;和 HbA 1c。对于预期寿命表中的 1024 个单元格中的每一个,创建了一个包含 1000 人的合成队列,并为其他风险因素分配了代表现实世界人口的值。对所有合成群组执行模拟,每个细胞的预期寿命计算为各个群组中个体的平均存活时间。
结果
具有不同风险因素水平的患者的预期寿命存在显着差异。20 岁男性的预期寿命从 29.3 岁到 50.6 岁不等,风险因素水平最差和最高的人群之间的差距为 21.3 岁。在 20 岁女性中,这一差距为 18.9 岁(预期寿命范围为 35.0-53.9 岁)。预期寿命的变化是风险因素值组合的函数,HbA 1c和 eGFR 始终分别显示负相关和正相关,与其他风险因素组合的任何水平的预期寿命。与BMI为25 kg/m 2的人相比,BMI最低(20 kg/m 2)和BMI最高(35 kg/m 2)的人的预期寿命较短. 不吸烟者和女性的预期寿命分别高于吸烟者和男性,不吸烟者和吸烟者的预期寿命差异为 0.4 年至 2.7 年,女性和男性之间的预期寿命差异为 1.9 年至 5.9 年,具体取决于关于其他风险因素的水平。
结论/解释
本研究中生成的预期寿命表显示,具有不同可修改风险因素的个体的预期寿命存在显着差异。该表允许在医疗保健专业人员、健康经济学家、研究人员、政策制定者和患者之间以易于理解的格式快速沟通风险。特别是,它支持临床医生与患者讨论改善风险因素的益处。


 京公网安备 11010802027423号