当前位置:
X-MOL 学术
›
Earth Surf.Process. Land.
›
论文详情
Our official English website, www.x-mol.net, welcomes your feedback! (Note: you will need to create a separate account there.)
Exploring new methods to analyse spatial impact distributions on debris-flow fans using data from south-western British Columbia
Earth Surface Processes and Landforms ( IF 3.3 ) Pub Date : 2021-07-02 , DOI: 10.1002/esp.5184 Sophia Zubrycky 1, 2 , Andrew Mitchell 1 , Scott McDougall 1 , Alex Strouth 1 , John J. Clague 3 , Brian Menounos 4
Earth Surface Processes and Landforms ( IF 3.3 ) Pub Date : 2021-07-02 , DOI: 10.1002/esp.5184 Sophia Zubrycky 1, 2 , Andrew Mitchell 1 , Scott McDougall 1 , Alex Strouth 1 , John J. Clague 3 , Brian Menounos 4
Affiliation
|
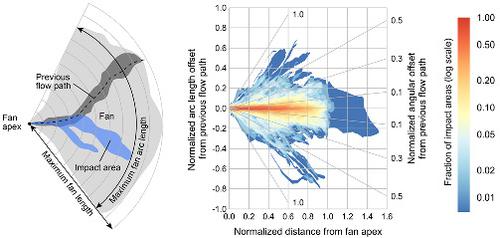
Predicting the spatial impact of debris flows on fans is challenging due to complex runout behaviour. Debris flow mobility is highly variable and flows can sporadically avulse the channel. For hazard and risk assessments, practitioners typically base the probability of spatial impact or avulsion on their experience and expert judgement. To support decision-making with empirical observations, we studied spatial impact distributions on 30 active debris-flow fans in south-western British Columbia, Canada. We mapped 146 debris-flow impact areas over an average observation period of 74 years using orthorectified airphotos, satellite imagery, topographic base maps, LiDAR data, orthophotos, and field observations. We devised a graphical method to convert our geospatial mapping into spatial impact heat maps normalized by fan boundaries, enabling comparison of runout distributions across different fans. About 90% of the mapped debris flows reached beyond the mid-points of fans, while less than 10% avulsed more than half-way across the fan relative to the previous flow path. Most avulsions initiated at distances of 20% to 40% of the maximum fan length from the fan apex and upstream of the fan intersection point. Large volume events tend to be more mobile in the down-fan direction, but the relation between volume and cross-fan runout (e.g., avulsions) is more complex. Differences in spatial impact distributions can be explained, in part, by the degree of fan incision and whether a fan is truncated at its toe by a river or lake. There were no significant differences in spatial impact distributions based on the geology of the source area, sediment supply condition, or hydrogeomorphic process classification.
中文翻译:

利用不列颠哥伦比亚省西南部的数据探索分析泥石流扇空间影响分布的新方法
由于复杂的跳动行为,预测泥石流对风扇的空间影响具有挑战性。碎片流的流动性是高度可变的,流动可以偶尔撕开通道。对于危害和风险评估,从业者通常根据他们的经验和专家判断来确定空间影响或撕脱的可能性。为了通过经验观察支持决策制定,我们研究了加拿大不列颠哥伦比亚省西南部 30 个活跃泥石流风扇的空间影响分布。我们使用正射校正航空照片、卫星图像、地形底图、激光雷达数据、正射影像和现场观测,在平均 74 年的观测期内绘制了 146 个泥石流影响区域的地图。我们设计了一种图形方法将我们的地理空间映射转换为由风扇边界标准化的空间影响热图,能够比较不同风扇的跳动分布。大约 90% 的映射泥石流超过了风扇的中点,而相对于之前的流动路径,不到 10% 的碎片流在风扇的一半以上被撕毁。大多数撕脱是在距扇形顶点和扇形交点上游的最大扇形长度的 20% 到 40% 的距离处开始的。大体积事件在向下扇形方向上更易移动,但体积与交叉扇形跳动(例如撕脱)之间的关系更为复杂。空间影响分布的差异部分可以通过扇形切口的程度以及扇形的脚趾是否被河流或湖泊截断来解释。基于源区地质、沉积物供应条件、
更新日期:2021-07-02
中文翻译:
利用不列颠哥伦比亚省西南部的数据探索分析泥石流扇空间影响分布的新方法
由于复杂的跳动行为,预测泥石流对风扇的空间影响具有挑战性。碎片流的流动性是高度可变的,流动可以偶尔撕开通道。对于危害和风险评估,从业者通常根据他们的经验和专家判断来确定空间影响或撕脱的可能性。为了通过经验观察支持决策制定,我们研究了加拿大不列颠哥伦比亚省西南部 30 个活跃泥石流风扇的空间影响分布。我们使用正射校正航空照片、卫星图像、地形底图、激光雷达数据、正射影像和现场观测,在平均 74 年的观测期内绘制了 146 个泥石流影响区域的地图。我们设计了一种图形方法将我们的地理空间映射转换为由风扇边界标准化的空间影响热图,能够比较不同风扇的跳动分布。大约 90% 的映射泥石流超过了风扇的中点,而相对于之前的流动路径,不到 10% 的碎片流在风扇的一半以上被撕毁。大多数撕脱是在距扇形顶点和扇形交点上游的最大扇形长度的 20% 到 40% 的距离处开始的。大体积事件在向下扇形方向上更易移动,但体积与交叉扇形跳动(例如撕脱)之间的关系更为复杂。空间影响分布的差异部分可以通过扇形切口的程度以及扇形的脚趾是否被河流或湖泊截断来解释。基于源区地质、沉积物供应条件、


 京公网安备 11010802027423号