Journal of Retailing ( IF 10.0 ) Pub Date : 2021-04-28 , DOI: 10.1016/j.jretai.2021.04.002 Martin Hirche , Paul W. Farris , Luke Greenacre , Yiran Quan , Susan Wei
|
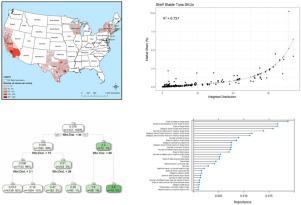
This research presents a retail analytics application which uses machine learning (ML) to identify and predict under- and overperforming consumer packaged goods (CPGs) using retail scanner data. Essential to measuring market performance at the SKU level is the relationship between distribution and market share (the velocity curve). We validate that ML can reproduce the velocity curve, and ML is further used to predict underperforming, in-line performing, and overperforming SKUs relative to the velocity curve, based on a range of variables (SKU features) at a point in time. Our ML approach can correctly predict 83% of SKUs as under-, in-line-, or overperforming based on their characteristics. The research analyzes 9,321 SKUs of 2,565 brands across seven product categories of CPGs which were sold in 8,117 stores from 49 different retail chains of five different retail channels located in the US states of California, New York, Texas, and Wisconsin. The retail stores comprise convenience stores, drug stores, food stores, liquor stores, and mass merchandise retail stores. The data is Nielsen retail store scanner data for the calendar year 2014. The relationship between distribution and market share is a market-wide proxy for the ratio of relative sales in a category to, for example, aggregate shelf space, a key retail productivity metric. We further find indications that the distribution of SKUs across different store sizes, the stores’ category specialization, the line length of the brands, the overall performance of the parent brand, and sales consistency are the most important characteristics for the prediction of market share performance beyond the velocity curve. The methods and results presented will help CPG marketers (suppliers and retailers) understand which SKUs are under-, in-line-, or overperforming and the potential factors contributing to that performance. Optimizing assortments and portfolios is essential to decrease failure rates of individual SKUs. ML approaches can evolve to complementary support tools for such management problems.
中文翻译:
预测分销市场份额关系中表现不佳和表现优异的 SKU
本研究提出了一种零售分析应用程序,该应用程序使用机器学习 (ML) 来识别和预测使用零售扫描仪数据表现不佳和表现不佳的消费品 (CPG)。在 SKU 级别衡量市场绩效的关键是分销和市场份额(速度曲线)之间的关系。我们验证了 ML 可以重现速度曲线,并且 ML 进一步用于根据某个时间点的一系列变量(SKU 特征)预测与速度曲线相关的表现不佳、在线表现和表现优异的 SKU。我们的 ML 方法可以根据其特征正确预测 83% 的 SKU 为表现不佳、在线或超额表现。该研究分析了 7 个 CPG 产品类别的 2,565 个品牌的 9,321 个 SKU,这些产品在 8 个、来自位于美国加利福尼亚州、纽约州、德克萨斯州和威斯康星州的 5 个不同零售渠道的 49 个不同零售连锁店的 117 家商店。零售店包括便利店、药店、食品店、酒类店和大众商品零售店。该数据是 2014 日历年的 Nielsen 零售店扫描仪数据。 分销和市场份额之间的关系是一个市场范围内的相对销售额比率的代理,例如,总货架空间,一个关键的零售生产力指标. 我们进一步发现,SKU 在不同店铺规模的分布、店铺的品类专业化、品牌的线长、母品牌的整体表现、和销售一致性是预测速度曲线之外的市场份额表现的最重要特征。所提供的方法和结果将帮助 CPG 营销人员(供应商和零售商)了解哪些 SKU 表现不佳、在线或表现出色,以及影响该表现的潜在因素。优化分类和产品组合对于降低单个 SKU 的故障率至关重要。ML 方法可以演变为此类管理问题的补充支持工具。


 京公网安备 11010802027423号