当前位置:
X-MOL 学术
›
Int. J. Climatol.
›
论文详情
Our official English website, www.x-mol.net, welcomes your feedback! (Note: you will need to create a separate account there.)
Homogenization and trends analysis of the Belgian historical precipitation time series
International Journal of Climatology ( IF 3.9 ) Pub Date : 2021-04-16 , DOI: 10.1002/joc.7129 Cedric Bertrand 1 , Romain Ingels 1 , Michel Journée 1
International Journal of Climatology ( IF 3.9 ) Pub Date : 2021-04-16 , DOI: 10.1002/joc.7129 Cedric Bertrand 1 , Romain Ingels 1 , Michel Journée 1
Affiliation
|
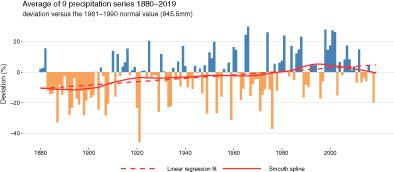
Long series of climate observations are essential to understand past and present climate change. However, the study of climate change from raw instrumental data poses a number of specific problems. Firstly, any observations are likely to contain erroneous values. Secondly, measurement conditions have generally changed over time which may introduce artificial breaks in the data that do not reflect the real variations of the climate. This article presents a new dataset of quality controlled and homogenized monthly precipitation series for Belgium. After in-depth data quality control, monthly precipitation time series have been homogenized with the HOMER software on the basis of available metadata. Homogenization results are provided for 110 series over the period 1951–2019 and for 18 series starting before 1912 including nine covering the full time period 1880–2019. The new dataset of monthly homogenized series allows us to make a robust analysis of the precipitation evolution in Belgium from 1880 to nowadays. The comparison between the average of the last 30 years (1990–2019) with that of the first 30 years (1880–1909) of the considered time period, reveals an average increase in precipitation in the order of 15.5%. However, this average representation of the increase masks important seasonal and regional differences across Belgium.
中文翻译:

比利时历史降水时间序列的均一化和趋势分析
长期的气候观测对于了解过去和现在的气候变化至关重要。然而,从原始仪器数据研究气候变化会带来许多具体问题。首先,任何观察都可能包含错误的值。其次,测量条件通常会随着时间的推移而发生变化,这可能会导致数据中出现人为中断,而这些数据不能反映气候的真实变化。本文介绍了一个新的比利时质量控制和均质月降水系列数据集。经过深入的数据质量控制,在可用元数据的基础上,使用 HOMER 软件对月降水时间序列进行了均质化。为 1951-2019 年期间的 110 个系列和 1912 年之前开始的 18 个系列提供了同质化结果,其中 9 个系列涵盖了 1880-2019 年的整个时间段。每月均质序列的新数据集使我们能够对比利时从 1880 年至今的降水演变进行强有力的分析。将过去 30 年(1990-2019 年)的平均值与所考虑时间段的前 30 年(1880-1909 年)的平均值进行比较,表明降水量平均增加了 15.5%。然而,这种增长的平均表现掩盖了比利时各地的重要季节性和地区差异。将过去 30 年(1990-2019 年)的平均值与所考虑时间段的前 30 年(1880-1909 年)的平均值进行比较,表明降水量平均增加了 15.5%。然而,这种增长的平均表现掩盖了比利时各地的重要季节性和地区差异。将过去 30 年(1990-2019 年)的平均值与所考虑时间段的前 30 年(1880-1909 年)的平均值进行比较,表明降水量平均增加了 15.5%。然而,这种增长的平均表现掩盖了比利时各地的重要季节性和地区差异。
更新日期:2021-04-16
中文翻译:
比利时历史降水时间序列的均一化和趋势分析
长期的气候观测对于了解过去和现在的气候变化至关重要。然而,从原始仪器数据研究气候变化会带来许多具体问题。首先,任何观察都可能包含错误的值。其次,测量条件通常会随着时间的推移而发生变化,这可能会导致数据中出现人为中断,而这些数据不能反映气候的真实变化。本文介绍了一个新的比利时质量控制和均质月降水系列数据集。经过深入的数据质量控制,在可用元数据的基础上,使用 HOMER 软件对月降水时间序列进行了均质化。为 1951-2019 年期间的 110 个系列和 1912 年之前开始的 18 个系列提供了同质化结果,其中 9 个系列涵盖了 1880-2019 年的整个时间段。每月均质序列的新数据集使我们能够对比利时从 1880 年至今的降水演变进行强有力的分析。将过去 30 年(1990-2019 年)的平均值与所考虑时间段的前 30 年(1880-1909 年)的平均值进行比较,表明降水量平均增加了 15.5%。然而,这种增长的平均表现掩盖了比利时各地的重要季节性和地区差异。将过去 30 年(1990-2019 年)的平均值与所考虑时间段的前 30 年(1880-1909 年)的平均值进行比较,表明降水量平均增加了 15.5%。然而,这种增长的平均表现掩盖了比利时各地的重要季节性和地区差异。将过去 30 年(1990-2019 年)的平均值与所考虑时间段的前 30 年(1880-1909 年)的平均值进行比较,表明降水量平均增加了 15.5%。然而,这种增长的平均表现掩盖了比利时各地的重要季节性和地区差异。


 京公网安备 11010802027423号