当前位置:
X-MOL 学术
›
Comput. Graph. Forum
›
论文详情
Our official English website, www.x-mol.net, welcomes your feedback! (Note: you will need to create a separate account there.)
Visualizing and Interacting with Geospatial Networks: A Survey and Design Space
Computer Graphics Forum ( IF 2.5 ) Pub Date : 2021-04-09 , DOI: 10.1111/cgf.14198 Sarah Schöttler 1 , Yalong Yang 2 , Hanspeter Pfister 2 , Benjamin Bach 1
Computer Graphics Forum ( IF 2.5 ) Pub Date : 2021-04-09 , DOI: 10.1111/cgf.14198 Sarah Schöttler 1 , Yalong Yang 2 , Hanspeter Pfister 2 , Benjamin Bach 1
Affiliation
|
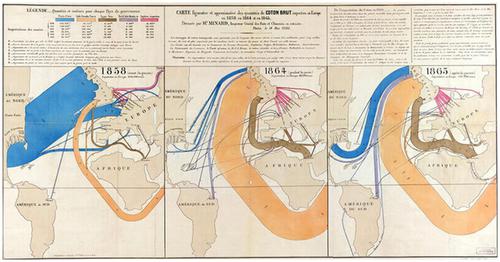
This paper surveys visualization and interaction techniques for geospatial networks from a total of 95 papers. Geospatial networks are graphs where nodes and links can be associated with geographic locations. Examples can include social networks, trade and migration, as well as traffic and transport networks. Visualizing geospatial networks poses numerous challenges around the integration of both network and geographical information as well as additional information such as node and link attributes, time and uncertainty. Our overview analyses existing techniques along four dimensions: (i) the representation of geographical information, (ii) the representation of network information, (iii) the visual integration of both and (iv) the use of interaction. These four dimensions allow us to discuss techniques with respect to the trade-offs they make between showing information across all these dimensions and how they solve the problem of showing as much information as necessary while maintaining readability of the visualization. https://geonetworks.github.io.
中文翻译:

地理空间网络的可视化和交互:调查和设计空间
本文从总共 95 篇论文中调查了地理空间网络的可视化和交互技术。地理空间网络是节点和链接可以与地理位置相关联的图形。示例可以包括社交网络、贸易和移民,以及交通和运输网络。地理空间网络的可视化在网络和地理信息以及附加信息(如节点和链接属性、时间和不确定性)的集成方面提出了许多挑战。我们的概述从四个维度分析了现有技术:(i)地理信息的表示,(ii)网络信息的表示,(iii)两者的视觉整合以及(iv)交互的使用。这四个维度允许我们讨论技术,它们在显示所有这些维度的信息之间进行权衡,以及它们如何解决在保持可视化可读性的同时显示尽可能多的信息的问题。https://geonetworks.github.io。
更新日期:2021-04-09
中文翻译:
地理空间网络的可视化和交互:调查和设计空间
本文从总共 95 篇论文中调查了地理空间网络的可视化和交互技术。地理空间网络是节点和链接可以与地理位置相关联的图形。示例可以包括社交网络、贸易和移民,以及交通和运输网络。地理空间网络的可视化在网络和地理信息以及附加信息(如节点和链接属性、时间和不确定性)的集成方面提出了许多挑战。我们的概述从四个维度分析了现有技术:(i)地理信息的表示,(ii)网络信息的表示,(iii)两者的视觉整合以及(iv)交互的使用。这四个维度允许我们讨论技术,它们在显示所有这些维度的信息之间进行权衡,以及它们如何解决在保持可视化可读性的同时显示尽可能多的信息的问题。https://geonetworks.github.io。


 京公网安备 11010802027423号