Ecological Modelling ( IF 3.1 ) Pub Date : 2021-04-08 , DOI: 10.1016/j.ecolmodel.2021.109501 Marta M. Rufino , Camille Albouy , Anik Brind'Amour
|
Species are spread in space, whereas sampling is sparse. Thus, to describe and map along environmental gradients, it is necessary to interpolate the species abundance. Considering the plethora of valid methods, the researcher gets easily puzzled to choose the most appropriate interpolation approach with reference to the ecological question being asked.
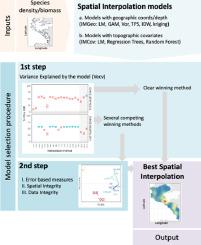
We propose a procedure to select among alternative spatial distribution models and we illustrate it with 175 marine species distributions (35 species * 5 years). In a first step, the distribution of the variance explained by the predictive model (VEcv) given by 10-fold cross validation is estimated for each interpolation method. When the inter-quartile range of the VEcv distribution of the different methods overlap, the selection passes to a second step, using 11 measures belonging to three criteria: 1) error based measures, 2) spatial equivalence measures (center of gravity, inertia, isotropy and index of aggregation) and 3) measures based on the data integrity after interpolation, for example the percentage of area over the maximum sampled data.
We applied our approach to marine species sampled using either stratified random survey (trawl) or systematic survey (acoustic). We found that 87% of all species distributions had overlapping VEcv and thus passed the first selection. In the second selection step, the best method varied with species and year, although general additive model (GAM), Thin Plate Spline (TPS), Universal Kriging (UKr) and Random Forest (Rfor) performed better for the trawl data and TPS, Ordinary Kriging (OKri) and UKr for the acoustic data. Further, the results differed within methods (e.g. kriging neighborhood and type of kriging) and small modifications on the specifications can have a large impact on the surfaces produced.
The proposed approach 1) is accessible and intuitive, and does not require any complex software or sophisticated methodology; 2) shows exactly in what aspects each interpolation model is prevalent over the others and permits to make a decision accordingly to the objectives of the study; 3) takes into account different criteria to evaluate each, properties of an interpolation method; 4) is universal and does not depend on the method used or the data characteristics. A detailed review on the subject is also included.
中文翻译:
我应该使用哪些空间插值器?应用于海洋物种的案例研究
物种散布在空间中,而采样稀疏。因此,要沿着环境梯度进行描述和绘制地图,必须对物种的丰富度进行插值。考虑到过多的有效方法,研究人员很容易困惑,要根据被问到的生态问题选择最合适的插值方法。
我们提出了一种在其他空间分布模型中进行选择的程序,并用175种海洋物种分布(35种* 5年)进行了说明。第一步,为每种插值方法估算由10倍交叉验证给出的预测模型(VEcv)解释的方差分布。当不同方法的VEcv分布的四分位间距重叠时,选择将进入第二步,使用属于三个标准的11个量度:1)基于误差的量度; 2)空间等效量度(重心,惯性,各向同性和聚集指数)和3)基于插值后数据完整性的度量,例如,面积占最大采样数据的百分比。
我们将我们的方法应用于通过分层随机调查(拖网)或系统调查(声学)采样的海洋物种。我们发现所有物种分布中有87%的VEcv重叠,因此通过了第一个选择。在第二个选择步骤中,最佳方法随物种和年份而变化,尽管对于拖网数据和TPS,通用加性模型(GAM),薄板样条(TPS),通用克里格(UKr)和随机森林(Rfor)的效果更好,普通克里格(OKri)和UKr用于声学数据。此外,结果在方法(例如,克里金法邻近度和克里金法类型)内有所不同,对规格的较小修改可能会对所生产的表面产生较大影响。
所提出的方法1)易于访问且直观,并且不需要任何复杂的软件或复杂的方法;2)准确显示每个插值模型在哪些方面比其他插值模型更普遍,并允许根据研究目标做出决定;3)考虑不同的标准来评估每个插值方法的属性;4)是通用的,并不取决于所使用的方法或数据特征。还包括有关该主题的详细评论。


 京公网安备 11010802027423号