Remote Sensing of Environment ( IF 13.5 ) Pub Date : 2021-02-23 , DOI: 10.1016/j.rse.2021.112339 Esra Suel 1, 2 , Samir Bhatt 3, 4 , Michael Brauer 5, 6 , Seth Flaxman 7 , Majid Ezzati 1, 8, 9
|
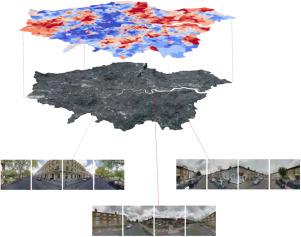
Data collected at large scale and low cost (e.g. satellite and street level imagery) have the potential to substantially improve resolution, spatial coverage, and temporal frequency of measurement of urban inequalities. Multiple types of data from different sources are often available for a given geographic area. Yet, most studies utilize a single type of input data when making measurements due to methodological difficulties in their joint use. We propose two deep learning-based methods for jointly utilizing satellite and street level imagery for measuring urban inequalities. We use London as a case study for three selected outputs, each measured in decile classes: income, overcrowding, and environmental deprivation. We compare the performances of our proposed multimodal models to corresponding unimodal ones using mean absolute error (MAE). First, satellite tiles are appended to street level imagery to enhance predictions at locations where street images are available leading to improvements in accuracy by 20, 10, and 9% in units of decile classes for income, overcrowding, and living environment. The second approach, novel to the best of our knowledge, uses a U-Net architecture to make predictions for all grid cells in a city at high spatial resolution (e.g. for 3 m × 3 m pixels in London in our experiments). It can utilize city wide availability of satellite images as well as more sparse information from street-level images where they are available leading to improvements in accuracy by 6, 10, and 11%. We also show examples of prediction maps from both approaches to visually highlight performance differences.
中文翻译:
利用卫星和街道图像进行多模态深度学习,用于衡量城市地区的收入、过度拥挤和环境剥夺
大规模、低成本收集的数据(例如卫星和街道图像)有可能大幅提高城市不平等测量的分辨率、空间覆盖范围和时间频率。对于给定的地理区域,通常可以使用来自不同来源的多种类型的数据。然而,由于联合使用的方法上的困难,大多数研究在进行测量时都使用单一类型的输入数据。我们提出了两种基于深度学习的方法,联合利用卫星和街道图像来衡量城市不平等。我们使用伦敦作为三个选定产出的案例研究,每个产出都以十分位数来衡量:收入、过度拥挤和环境剥夺。我们使用平均绝对误差(MAE)将我们提出的多模态模型的性能与相应的单模态模型进行比较。首先,将卫星图块附加到街道级图像中,以增强对可获得街道图像的位置的预测,从而将收入、过度拥挤和生活环境的十分位数类别的准确性提高 20%、10% 和 9%。据我们所知,第二种方法是新颖的,它使用 U-Net 架构以高空间分辨率对城市中的所有网格单元进行预测(例如,在我们的实验中,针对伦敦的 3 m × 3 m 像素)。它可以利用全市范围内的卫星图像以及来自街道图像的更稀疏信息,从而将准确性提高 6%、10% 和 11%。我们还展示了两种方法的预测图示例,以直观地突出性能差异。


 京公网安备 11010802027423号