Agricultural and Forest Meteorology ( IF 6.2 ) Pub Date : 2021-02-14 , DOI: 10.1016/j.agrformet.2021.108350 Housen Chu , Xiangzhong Luo , Zutao Ouyang , W. Stephen Chan , Sigrid Dengel , Sébastien C. Biraud , Margaret S. Torn , Stefan Metzger , Jitendra Kumar , M. Altaf Arain , Tim J. Arkebauer , Dennis Baldocchi , Carl Bernacchi , Dave Billesbach , T. Andrew Black , Peter D. Blanken , Gil Bohrer , Rosvel Bracho , Shannon Brown , Nathaniel A. Brunsell , Jiquan Chen , Xingyuan Chen , Kenneth Clark , Ankur R. Desai , Tomer Duman , David Durden , Silvano Fares , Inke Forbrich , John A. Gamon , Christopher M. Gough , Timothy Griffis , Manuel Helbig , David Hollinger , Elyn Humphreys , Hiroki Ikawa , Hiroki Iwata , Yang Ju , John F. Knowles , Sara H. Knox , Hideki Kobayashi , Thomas Kolb , Beverly Law , Xuhui Lee , Marcy Litvak , Heping Liu , J. William Munger , Asko Noormets , Kim Novick , Steven F. Oberbauer , Walter Oechel , Patty Oikawa , Shirley A. Papuga , Elise Pendall , Prajaya Prajapati , John Prueger , William L Quinton , Andrew D. Richardson , Eric S. Russell , Russell L. Scott , Gregory Starr , Ralf Staebler , Paul C. Stoy , Ellen Stuart-Haëntjens , Oliver Sonnentag , Ryan C. Sullivan , Andy Suyker , Masahito Ueyama , Rodrigo Vargas , Jeffrey D. Wood , Donatella Zona
|
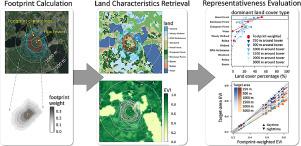
Large datasets of greenhouse gas and energy surface-atmosphere fluxes measured with the eddy-covariance technique (e.g., FLUXNET2015, AmeriFlux BASE) are widely used to benchmark models and remote-sensing products. This study addresses one of the major challenges facing model-data integration: To what spatial extent do flux measurements taken at individual eddy-covariance sites reflect model- or satellite-based grid cells? We evaluate flux footprints—the temporally dynamic source areas that contribute to measured fluxes—and the representativeness of these footprints for target areas (e.g., within 250–3000 m radii around flux towers) that are often used in flux-data synthesis and modeling studies. We examine the land-cover composition and vegetation characteristics, represented here by the Enhanced Vegetation Index (EVI), in the flux footprints and target areas across 214 AmeriFlux sites, and evaluate potential biases as a consequence of the footprint-to-target-area mismatch. Monthly 80% footprint climatologies vary across sites and through time ranging four orders of magnitude from 103 to 107 m2 due to the measurement heights, underlying vegetation- and ground-surface characteristics, wind directions, and turbulent state of the atmosphere. Few eddy-covariance sites are located in a truly homogeneous landscape. Thus, the common model-data integration approaches that use a fixed-extent target area across sites introduce biases on the order of 4%–20% for EVI and 6%–20% for the dominant land cover percentage. These biases are site-specific functions of measurement heights, target area extents, and land-surface characteristics. We advocate that flux datasets need to be used with footprint awareness, especially in research and applications that benchmark against models and data products with explicit spatial information. We propose a simple representativeness index based on our evaluations that can be used as a guide to identify site-periods suitable for specific applications and to provide general guidance for data use.
中文翻译:
涡流协方差通量足迹在AmeriFlux站点周围的代表性
利用涡度协方差技术(例如FLUXNET2015,AmeriFlux BASE)测量的温室气体和能量表面大气通量的大型数据集被广泛用于基准模型和遥感产品。这项研究解决了模型数据集成面临的主要挑战之一:在各个涡度-协方差站点进行的通量测量在多大程度上反映了基于模型或基于卫星的网格?我们评估通量足迹(有助于测量通量的时间动态源区域),以及这些足迹对于目标区域(例如,通量塔周围半径250-3000 m半径内)的代表性,这些目标区域通常用于通量数据综合和建模研究。我们研究了以增强植被指数(EVI)表示的土地覆盖物成分和植被特征,在214个AmeriFlux站点的通量足迹和目标区域中进行评估,并评估由于足迹与目标区域不匹配而导致的潜在偏差。每个站点的每月80%足迹气候变化很大,并且时间从10个变化到四个数量级。3至10 7 m 2由于测量高度,潜在的植被和地表特征,风向以及大气的湍流状态。很少有涡动协方差点位于真正均匀的景观中。因此,使用跨站点使用固定范围目标区域的通用模型数据集成方法对EVI造成的偏差约为4%–20%,对于主要土地覆盖率的偏差约为6%–20%。这些偏差是特定位置的测量高度,目标区域范围和陆地表面特征的函数。我们主张通量数据集必须在具有足迹感知的情况下使用,尤其是在以具有明确空间信息的模型和数据产品为基准的研究和应用中。


 京公网安备 11010802027423号