Environment, Development and Sustainability ( IF 4.9 ) Pub Date : 2021-01-29 , DOI: 10.1007/s10668-021-01238-x Soumita Sengupta 1 , Sk Mohinuddin 1 , Mohammad Arif 2
|
Abstract
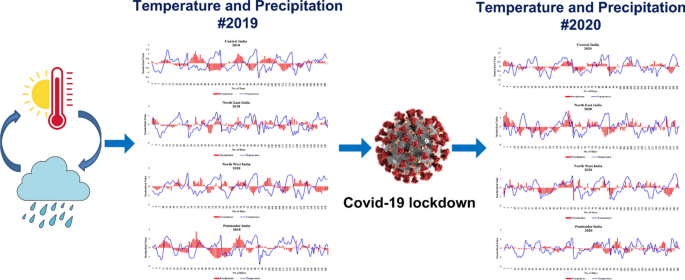
This study exclusively focuses on spatial and temporal change of temperature and precipitation before and after COVID-19 lockdown and also examines the extent of their variation and the spatial relationship between them. Our main objective is to analyze the spatiotemporal changes of two climatic variables in Indian subcontinent for the period of 2015–2020. Monthly precipitation and temperature data are collected from NOAA and NASA for January to May month across the four zones (northeast, northwest, central, and peninsular zone) of India. To conduct a zone-wise statistical analysis, we have adopted statistical process control (SPC) methods like exponentially weighted moving average (EWMA) control charts, individual charts (I- Chart) to detect the shift in temperature and precipitation over the study period and Pearson correlation coefficient applied to measure the spatial association between the two variables. The findings revealed that temperature parameter has experienced a lot of positive and negative trends in the span of 6 years and detected a weak to moderate negative correlation in many parts of the country in April 2020 after 2016. This study also identified a weak negative correlation mainly in NE zone in 2020 after 2017. This research provides vital scientific contribution to the effects of monthly temperature and precipitation before and after COVID-19 pandemic lockdown.
Graphic abstract
中文翻译:
参考 COVID-19 大流行封锁的温度和降水时空动态:来自印度次大陆的观点
摘要
本研究专门关注 COVID-19 锁定前后温度和降水的时空变化,并检查它们的变化程度以及它们之间的空间关系。我们的主要目标是分析 2015-2020 年印度次大陆两个气候变量的时空变化。从 NOAA 和 NASA 收集的 1 月至 5 月印度四个区域(东北、西北、中部和半岛区)的月降水量和温度数据。为了进行区域统计分析,我们采用了统计过程控制 (SPC) 方法,例如指数加权移动平均 (EWMA) 控制图,单独的图表(I-图表)来检测研究期间温度和降水的变化,以及用于测量两个变量之间的空间关联的 Pearson 相关系数。调查结果显示,温度参数在 6 年的时间里经历了多次正负相关趋势,并在 2016 年之后的 2020 年 4 月在全国许多地区检测到弱到中度的负相关。本研究还发现主要是弱负相关在 2017 年之后的 2020 年东北地区。这项研究为 COVID-19 大流行锁定前后的月温度和降水的影响提供了重要的科学贡献。


 京公网安备 11010802027423号