Our official English website, www.x-mol.net, welcomes your feedback! (Note: you will need to create a separate account there.)
Experimental investigation of supersonic turbulent flow over cylinders with various heights
Journal of Visualization ( IF 1.7 ) Pub Date : 2021-01-02 , DOI: 10.1007/s12650-020-00723-1 Dundian Gang , Shihe Yi , Haibo Niu
Journal of Visualization ( IF 1.7 ) Pub Date : 2021-01-02 , DOI: 10.1007/s12650-020-00723-1 Dundian Gang , Shihe Yi , Haibo Niu
|
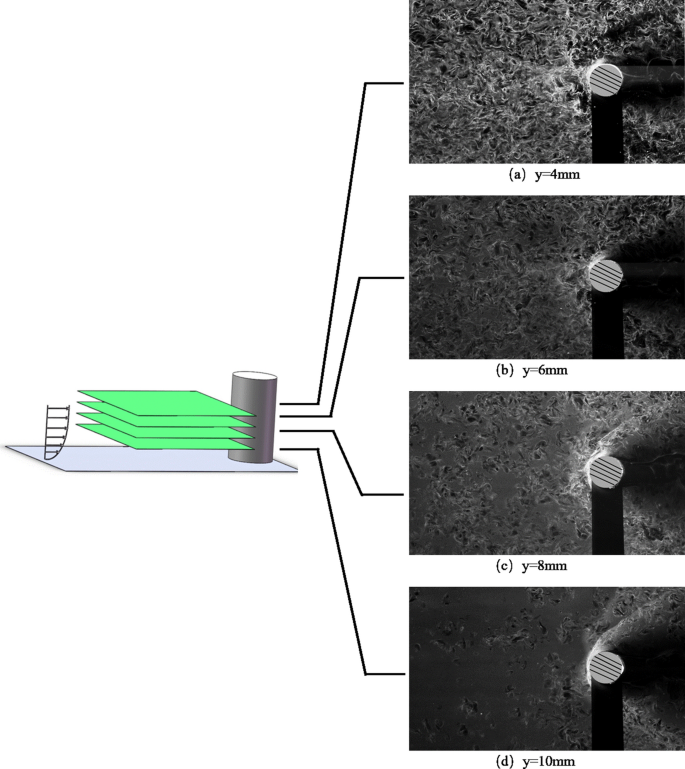
Abstract The unsteady flow structures and pressure fluctuations of the cylinder-induced shock wave/boundary layer interactions (SBLIs) were investigated at Mach 3.4 and 3.8. The cylinders were mounted on the test section floor with a turbulent boundary layer, and six cylinders with various heights have been tested. The nanoparticle-based planar laser scattering (NPLS) flow visualization tests were performed, and the different features of shock systems as well as the "breath" effects of the separation bubble, have been validated by NPLS images. Dynamic pressure transducers were used to characterize the pressure fluctuations, and a remarkable spectra change was noticed around the cylinder foot. With increasing height, the PSD curve of x/D = − 1 ahead of the cylinder shaped from one-peak pattern to two-peaks pattern, while the second frequency peak showed a typical frequency of f ≈32 kHz. It was inferred that the first peak was more influenced by the free end of the cylinder and the detached shock. The second peak pattern of f ≈32 kHz was presumed to be affected by the vortex breakdown near the cylinder foot through analysis of flow visualization. Low frequency around 0 ~ 3 kHz was found to have an obvious rise at x/D = − 2, close to the typical frequency of SBLIs. Graphical abstract
中文翻译:

不同高度圆柱体上超音速湍流的实验研究
摘要 以3.4和3.8马赫的速度研究了圆柱激波/边界层相互作用(SBLI)的非定常流动结构和压力波动。圆柱体安装在带有湍流边界层的测试段地板上,已经测试了六个不同高度的圆柱体。进行了基于纳米粒子的平面激光散射 (NPLS) 流动可视化测试,并且通过 NPLS 图像验证了冲击系统的不同特征以及分离气泡的“呼吸”效应。动态压力传感器被用来表征压力波动,在气缸脚周围注意到一个显着的光谱变化。随着高度的增加,x/D = − 1 的 PSD 曲线在圆柱体从单峰模式到双峰模式之前,而第二个频率峰值显示出典型的 f ≈32 kHz 频率。推断第一个峰值受圆柱自由端和分离激波的影响较大。通过流动可视化分析,推测 f ≈32 kHz 的第二个峰值模式受到圆柱底部附近涡流击穿的影响。发现 0 ~ 3 kHz 附近的低频在 x/D = − 2 处有明显上升,接近 SBLI 的典型频率。图形概要 发现 0 ~ 3 kHz 附近的低频在 x/D = − 2 处有明显上升,接近 SBLI 的典型频率。图形概要 发现 0 ~ 3 kHz 附近的低频在 x/D = − 2 处有明显上升,接近 SBLI 的典型频率。图形概要
更新日期:2021-01-02
中文翻译:
不同高度圆柱体上超音速湍流的实验研究
摘要 以3.4和3.8马赫的速度研究了圆柱激波/边界层相互作用(SBLI)的非定常流动结构和压力波动。圆柱体安装在带有湍流边界层的测试段地板上,已经测试了六个不同高度的圆柱体。进行了基于纳米粒子的平面激光散射 (NPLS) 流动可视化测试,并且通过 NPLS 图像验证了冲击系统的不同特征以及分离气泡的“呼吸”效应。动态压力传感器被用来表征压力波动,在气缸脚周围注意到一个显着的光谱变化。随着高度的增加,x/D = − 1 的 PSD 曲线在圆柱体从单峰模式到双峰模式之前,而第二个频率峰值显示出典型的 f ≈32 kHz 频率。推断第一个峰值受圆柱自由端和分离激波的影响较大。通过流动可视化分析,推测 f ≈32 kHz 的第二个峰值模式受到圆柱底部附近涡流击穿的影响。发现 0 ~ 3 kHz 附近的低频在 x/D = − 2 处有明显上升,接近 SBLI 的典型频率。图形概要 发现 0 ~ 3 kHz 附近的低频在 x/D = − 2 处有明显上升,接近 SBLI 的典型频率。图形概要 发现 0 ~ 3 kHz 附近的低频在 x/D = − 2 处有明显上升,接近 SBLI 的典型频率。图形概要


 京公网安备 11010802027423号