Our official English website, www.x-mol.net, welcomes your feedback! (Note: you will need to create a separate account there.)
EcoLens: visual analysis of ecological regions in urban contexts using traffic data
Journal of Visualization ( IF 1.7 ) Pub Date : 2020-10-16 , DOI: 10.1007/s12650-020-00707-1 Zhuochen Jin , Nan Cao , Yang Shi , Wenchao Wu , Yingcai Wu
Journal of Visualization ( IF 1.7 ) Pub Date : 2020-10-16 , DOI: 10.1007/s12650-020-00707-1 Zhuochen Jin , Nan Cao , Yang Shi , Wenchao Wu , Yingcai Wu
|
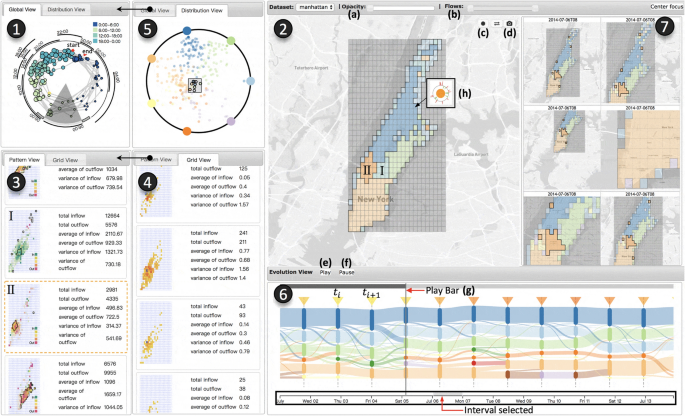
The increasing availability of spatiotemporal data provides unprecedented opportunities for understanding the structure of an urban area in terms of people’s activity pattern and how they form the latent regions over time. However, existing solutions are limited in their capacity of capturing the evolutionary patterns of dynamic latent regions within urban context. In this work, we introduce an interactive visual analysis approach, EcoLens, that allows analysts to progressively explore and analyze the complex dynamic segmentation patterns of a city using traffic data. We propose an extended nonnegative matrix factorization-based algorithm smoothed over both spatial and temporal dimensions to capture the spatiotemporal dynamics of the city. The algorithm also ensures the orthogonality of its result to facilitate the interpretation of different patterns. A suite of visualizations is designed to illustrate the dynamics of city segmentation and the corresponding interactions are added to support the exploration of the segmentation patterns over time. We evaluate the effectiveness of our system via case studies using a real-world dataset and a qualitative interview with the domain expert.
中文翻译:

EcoLens:使用交通数据对城市环境中的生态区域进行可视化分析
越来越多的时空数据为从人们的活动模式以及他们如何随着时间的推移形成潜在区域方面理解城市地区的结构提供了前所未有的机会。然而,现有的解决方案在捕捉城市环境中动态潜在区域的演化模式方面的能力有限。在这项工作中,我们引入了一种交互式视觉分析方法 EcoLens,它允许分析师使用交通数据逐步探索和分析城市的复杂动态分割模式。我们提出了一种扩展的基于非负矩阵分解的算法,在空间和时间维度上进行平滑处理,以捕捉城市的时空动态。该算法还确保其结果的正交性,以方便对不同模式的解释。设计了一套可视化来说明城市分割的动态,并添加了相应的交互以支持随着时间的推移探索分割模式。我们通过案例研究使用真实世界的数据集和领域专家的定性访谈来评估我们系统的有效性。
更新日期:2020-10-16
中文翻译:
EcoLens:使用交通数据对城市环境中的生态区域进行可视化分析
越来越多的时空数据为从人们的活动模式以及他们如何随着时间的推移形成潜在区域方面理解城市地区的结构提供了前所未有的机会。然而,现有的解决方案在捕捉城市环境中动态潜在区域的演化模式方面的能力有限。在这项工作中,我们引入了一种交互式视觉分析方法 EcoLens,它允许分析师使用交通数据逐步探索和分析城市的复杂动态分割模式。我们提出了一种扩展的基于非负矩阵分解的算法,在空间和时间维度上进行平滑处理,以捕捉城市的时空动态。该算法还确保其结果的正交性,以方便对不同模式的解释。设计了一套可视化来说明城市分割的动态,并添加了相应的交互以支持随着时间的推移探索分割模式。我们通过案例研究使用真实世界的数据集和领域专家的定性访谈来评估我们系统的有效性。


 京公网安备 11010802027423号