Our official English website, www.x-mol.net, welcomes your feedback! (Note: you will need to create a separate account there.)
ConfVisExplorer: a literature-based visual analysis system for conference comparison
Journal of Visualization ( IF 1.7 ) Pub Date : 2020-10-13 , DOI: 10.1007/s12650-020-00703-5 Kaixin Chen , Yang Wang , Minzhu Yu , Han-Wei Shen , Xiaomin Yu , Guihua Shan
Journal of Visualization ( IF 1.7 ) Pub Date : 2020-10-13 , DOI: 10.1007/s12650-020-00703-5 Kaixin Chen , Yang Wang , Minzhu Yu , Han-Wei Shen , Xiaomin Yu , Guihua Shan
|
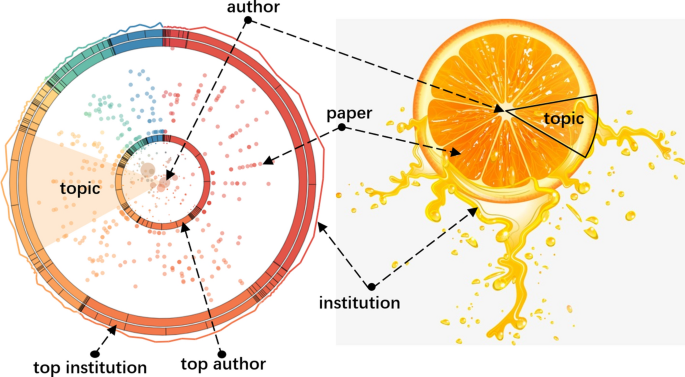
Given a research field, there are usually multiple conferences with different sizes and characteristics, and not all researchers have equal participations in all those conferences. For a conference organizer, knowing the level of involvements by the researchers in the field will allow them to put effort into broadening the participation and enrich the research scope. For researchers, knowing the different strengths and focuses of those conferences also allows them to enhance the effectiveness of their effort and the visibility of their works. In recent years, analyzing scientific literature by visualization has become a popular topic, but most of them focus only on the overall characteristics of publications such as authors, citations, and topics. This study focuses on the analysis and comparisons of academic conferences. In this paper, we present the Conference Orange, a new visual metaphor for analyzing and comparing the characteristics of multiple conferences. First, we propose an assessment framework to describe the maturity of the conferences. Second, we map the metrics in the framework to different diagrams for visual analysis and comparison. Third, we design and implement ConfVisExplorer, a multi-view interactive visual system that combines these diagrams, which helps users to explore the structure of the conferences and the attributes in context, such as authors and institutions. Finally, we conduct case studies to demonstrate the effectiveness of the system.
中文翻译:

ConfVisExplorer:一个基于文献的会议比较可视化分析系统
给定一个研究领域,通常会有多个不同规模和特点的会议,并不是所有的研究人员都平等地参与所有这些会议。对于会议组织者而言,了解该领域研究人员的参与程度将使他们能够努力扩大参与范围并丰富研究范围。对于研究人员来说,了解这些会议的不同优势和重点也使他们能够提高努力的有效性和作品的知名度。近年来,通过可视化分析科学文献已经成为一个热门话题,但大多数只关注作者、引用和主题等出版物的整体特征。本研究侧重于对学术会议的分析和比较。在本文中,我们展示了会议橙色,这是一种新的视觉隐喻,用于分析和比较多个会议的特征。首先,我们提出了一个评估框架来描述会议的成熟度。其次,我们将框架中的指标映射到不同的图表进行可视化分析和比较。第三,我们设计并实现了 ConfVisExplorer,这是一个结合这些图表的多视图交互式可视化系统,帮助用户探索会议的结构和上下文中的属性,例如作者和机构。最后,我们进行案例研究以证明系统的有效性。我们将框架中的指标映射到不同的图表进行可视化分析和比较。第三,我们设计并实现了 ConfVisExplorer,这是一个结合这些图表的多视图交互式可视化系统,帮助用户探索会议的结构和上下文中的属性,例如作者和机构。最后,我们进行案例研究以证明系统的有效性。我们将框架中的指标映射到不同的图表进行可视化分析和比较。第三,我们设计并实现了 ConfVisExplorer,这是一个结合这些图表的多视图交互式可视化系统,帮助用户探索会议的结构和上下文中的属性,例如作者和机构。最后,我们进行案例研究以证明系统的有效性。
更新日期:2020-10-13
中文翻译:
ConfVisExplorer:一个基于文献的会议比较可视化分析系统
给定一个研究领域,通常会有多个不同规模和特点的会议,并不是所有的研究人员都平等地参与所有这些会议。对于会议组织者而言,了解该领域研究人员的参与程度将使他们能够努力扩大参与范围并丰富研究范围。对于研究人员来说,了解这些会议的不同优势和重点也使他们能够提高努力的有效性和作品的知名度。近年来,通过可视化分析科学文献已经成为一个热门话题,但大多数只关注作者、引用和主题等出版物的整体特征。本研究侧重于对学术会议的分析和比较。在本文中,我们展示了会议橙色,这是一种新的视觉隐喻,用于分析和比较多个会议的特征。首先,我们提出了一个评估框架来描述会议的成熟度。其次,我们将框架中的指标映射到不同的图表进行可视化分析和比较。第三,我们设计并实现了 ConfVisExplorer,这是一个结合这些图表的多视图交互式可视化系统,帮助用户探索会议的结构和上下文中的属性,例如作者和机构。最后,我们进行案例研究以证明系统的有效性。我们将框架中的指标映射到不同的图表进行可视化分析和比较。第三,我们设计并实现了 ConfVisExplorer,这是一个结合这些图表的多视图交互式可视化系统,帮助用户探索会议的结构和上下文中的属性,例如作者和机构。最后,我们进行案例研究以证明系统的有效性。我们将框架中的指标映射到不同的图表进行可视化分析和比较。第三,我们设计并实现了 ConfVisExplorer,这是一个结合这些图表的多视图交互式可视化系统,帮助用户探索会议的结构和上下文中的属性,例如作者和机构。最后,我们进行案例研究以证明系统的有效性。


 京公网安备 11010802027423号