当前位置:
X-MOL 学术
›
Earth Planets Space
›
论文详情
Our official English website, www.x-mol.net, welcomes your feedback! (Note: you will need to create a separate account there.)
Precursory ground deformation of the 2018 phreatic eruption on Iwo-Yama volcano, revealed by four-dimensional joint analysis of airborne and spaceborne InSAR
Earth, Planets and Space ( IF 3.362 ) Pub Date : 2020-10-09 , DOI: 10.1186/s40623-020-01280-5 Shohei Narita , Taku Ozawa , Yosuke Aoki , Masanobu Shimada , Masato Furuya , Youichiro Takada , Makoto Murakami
Earth, Planets and Space ( IF 3.362 ) Pub Date : 2020-10-09 , DOI: 10.1186/s40623-020-01280-5 Shohei Narita , Taku Ozawa , Yosuke Aoki , Masanobu Shimada , Masato Furuya , Youichiro Takada , Makoto Murakami
|
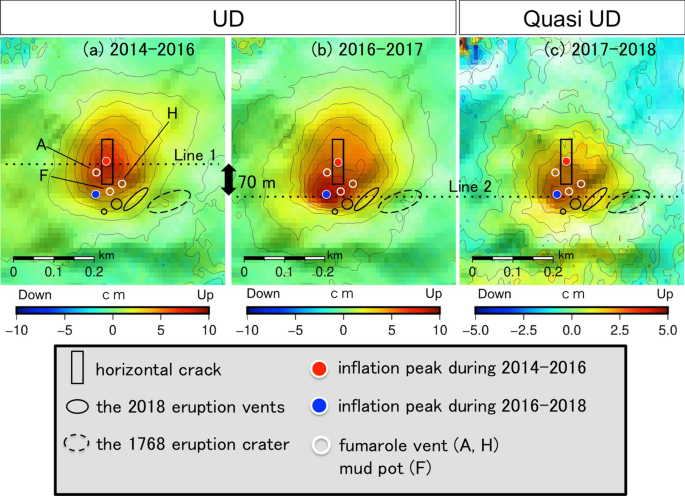
We present detailed maps of local-scale 3D deformation preceding the 2018 phreatic eruption at Iwo-yama volcano (south of Kyushu Island, Japan), using a combination of airborne and spaceborne Interferometric Synthetic Aperture Radar (InSAR) data. The 3D and 2.5D deformation maps obtained at different periods allow us to successfully track their spatiotemporal evolution and to infer the transition of subsurface conditions responsible for the precursory deformation observed from 2014 to 2018. From 2014 to 2016, ground inflation depicted an axisymmetric pattern with the maximum displacement at the center of the deformed area. However, from 2016 to 2018, an inflation peak moved to the southern edge of the area deformed during 2014–2016 and became more localized, which was close to the newly generated vents in the 2018 eruption. Modeling of the inflations suggests that pressurization within a crack at a depth of 150 m beneath the Iwo-yama geothermal area caused the 2014–2016 deformation and had continued until the 2018 eruption. Modeling results highlight the persistence of the local ground inflation pattern just above the southern edge of the crack, which suggests the presence of a shallower inflation source contributing to the local inflation. Consequently, we interpret the sequence of these deformations as follows: from 2014, deeper-rooted fluid started to inject into a fluid-saturated crack at 150-m depth, which caused the 2014–2016 deformation. Then, after 2016, the crack inflation continued because of the continuous fluid injection and formed another pressurized part directly above the southern tip of the crack. Additionally, the results of the time-series analysis of the satellite InSAR data revealed that the local inflation started around April 2017 for which thermal activity including a mud emission became pronounced around the location of the local inflation. As a result of an episodic increase in supply rate of magmatic fluids from a deep magma reservoir from early 2018, a phreatic eruption finally occurred in the vicinity of the most deformed point, providing a clue for predicting future eruption sites, as was also observed in the Hakone 2015 eruption.
中文翻译:

通过机载和星载 InSAR 的四维联合分析揭示了硫磺山火山 2018 年潜水喷发的先兆地面变形
我们使用机载和星载干涉合成孔径雷达 (InSAR) 数据的组合,展示了 2018 年硫磺山火山(日本九州岛南部)潜水喷发前局部尺度 3D 变形的详细地图。在不同时期获得的 3D 和 2.5D 变形图使我们能够成功地跟踪它们的时空演变,并推断出导致 2014 年至 2018 年观测到的前兆变形的地下条件的转变。从 2014 年到 2016 年,地面膨胀描绘了一个轴对称模式变形区域中心的最大位移。然而,从2016年到2018年,通货膨胀峰值移动到2014年到2016年变形区域的南缘,变得更加局部化,接近2018年喷发时新产生的喷口。膨胀模型表明,硫磺山地热区下方 150 m 深的裂缝内的加压导致了 2014-2016 年的变形,并一直持续到 2018 年喷发。建模结果突出了裂缝南边缘上方局部地面膨胀模式的持续存在,这表明存在导致局部膨胀的较浅膨胀源。因此,我们将这些变形的顺序解释如下:从 2014 年开始,更深的流体开始注入 150 米深度的流体饱和裂缝,这导致了 2014-2016 年的变形。然后,2016年后,由于流体不断注入,裂缝膨胀继续进行,并在裂缝南端正上方形成了另一个受压部分。此外,卫星 InSAR 数据的时间序列分析结果显示,局部膨胀开始于 2017 年 4 月左右,其中包括泥浆排放在内的热活动在局部膨胀位置周围变得明显。由于 2018 年初深部岩浆储层的岩浆流体供应率间歇性增加,最终在变形最严重的点附近发生了一次潜水喷发,为预测未来的喷发地点提供了线索,正如在2015 年箱根火山喷发。
更新日期:2020-10-09
中文翻译:
通过机载和星载 InSAR 的四维联合分析揭示了硫磺山火山 2018 年潜水喷发的先兆地面变形
我们使用机载和星载干涉合成孔径雷达 (InSAR) 数据的组合,展示了 2018 年硫磺山火山(日本九州岛南部)潜水喷发前局部尺度 3D 变形的详细地图。在不同时期获得的 3D 和 2.5D 变形图使我们能够成功地跟踪它们的时空演变,并推断出导致 2014 年至 2018 年观测到的前兆变形的地下条件的转变。从 2014 年到 2016 年,地面膨胀描绘了一个轴对称模式变形区域中心的最大位移。然而,从2016年到2018年,通货膨胀峰值移动到2014年到2016年变形区域的南缘,变得更加局部化,接近2018年喷发时新产生的喷口。膨胀模型表明,硫磺山地热区下方 150 m 深的裂缝内的加压导致了 2014-2016 年的变形,并一直持续到 2018 年喷发。建模结果突出了裂缝南边缘上方局部地面膨胀模式的持续存在,这表明存在导致局部膨胀的较浅膨胀源。因此,我们将这些变形的顺序解释如下:从 2014 年开始,更深的流体开始注入 150 米深度的流体饱和裂缝,这导致了 2014-2016 年的变形。然后,2016年后,由于流体不断注入,裂缝膨胀继续进行,并在裂缝南端正上方形成了另一个受压部分。此外,卫星 InSAR 数据的时间序列分析结果显示,局部膨胀开始于 2017 年 4 月左右,其中包括泥浆排放在内的热活动在局部膨胀位置周围变得明显。由于 2018 年初深部岩浆储层的岩浆流体供应率间歇性增加,最终在变形最严重的点附近发生了一次潜水喷发,为预测未来的喷发地点提供了线索,正如在2015 年箱根火山喷发。


 京公网安备 11010802027423号