当前位置:
X-MOL 学术
›
Int. J. Climatol.
›
论文详情
Our official English website, www.x-mol.net, welcomes your feedback! (Note: you will need to create a separate account there.)
Changes in temperature extremes and their relationship with ENSO in Malaysia from 1985 to 2018
International Journal of Climatology ( IF 3.9 ) Pub Date : 2020-10-06 , DOI: 10.1002/joc.6864 Mou Leong Tan 1 , Liew Juneng 2 , Fredolin T. Tangang 2 , Jing Xiang Chung 3, 4 , R. B. Radin Firdaus 5
International Journal of Climatology ( IF 3.9 ) Pub Date : 2020-10-06 , DOI: 10.1002/joc.6864 Mou Leong Tan 1 , Liew Juneng 2 , Fredolin T. Tangang 2 , Jing Xiang Chung 3, 4 , R. B. Radin Firdaus 5
Affiliation
|
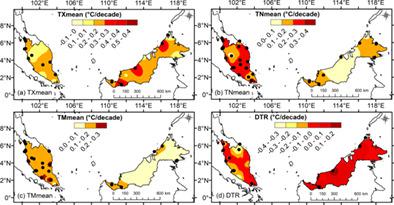
Understanding the changes in temperature extremes is important for managing and coping with the risks associated with regional climate change. However, the climatological characteristics of temperature extremes and their variabilities is still not adequately studies in Malaysia. This study evaluates the spatial and temporal variations of temperature extremes over Malaysia for the period 1985–2018. This study includes four phases: (a) collection, quality control and homogeneity analysis of temperature data; (b) general (TXmean, TNmean, TMmean and DTR), warm (TXx, TNx, TX90p and TN90p) and cool (TXn, TNn, TX10p and TN10p) temperature extreme indices calculations; (c) trend analysis of temperature extremes using the Mann‐Kendall and Sens's slope test; and (d) analyses of correlations between temperature extremes and El Niño‐Southern Oscillation (ENSO). The results indicate a warming of surface temperature across Malaysia, particularly in Peninsular Malaysia. In general, TXmean, TNmean and TMmean increased significantly at 5% significance level by 0.12°C/decade, 0.27°C/decade and 0.17°C/decade, respectively. A significant decreasing trend in DTR by 0.12°C/decade is seen, which is related to the higher increasing rate of TNmean. All of the warm extreme indices, TXx, TNx, TX90p and TN90p presents significant increasing trends by 0.19°C/decade, 0.28°C/decade, 2.86%/decade and 3.08%/decade, respectively. For the cool extreme indices, TX10p and TN10p decreased significantly by 0.95%/decade and 3.18%/decade, respectively, though the trend in TXn by 0.11°C/decade is not statistically significant. The only cool index presenting a significant increasing trend is TNn by 0.44°C/decade, indicating a reduction of cool nights. Besides that, major cities in the northern and western parts of Peninsular Malaysia generally exhibit a higher warming trend compared to rural and highland area. These are possibly related to the intensified urban heat island effect under the rapid urbanization. This study also found that the ENSO affected warm extreme indices much stronger than cool extreme indices in Malaysia.
中文翻译:

1985年至2018年马来西亚极端温度的变化及其与ENSO的关系
了解极端温度的变化对于管理和应对与区域气候变化相关的风险非常重要。然而,马来西亚仍然没有对温度极限及其变化的气候特征进行充分的研究。这项研究评估了1985-2018年间马来西亚极端温度的时空变化。这项研究包括四个阶段:(a)温度数据的收集,质量控制和均质性分析;(b)常规(TXmean,TNmean,TMmean和DTR),温暖(TXx,TNx,TX90p和TN90p)和凉爽(TXn,TNn,TX10p和TN10p)温度极限指数的计算;(c)使用Mann-Kendall和Sens的斜率检验对极端温度进行趋势分析;(d)分析极端温度与厄尔尼诺-南方涛动(ENSO)之间的相关性。结果表明马来西亚各地,特别是马来西亚半岛的地表温度升高。通常,TXmean,TNmean和TMmean以5%的显着性水平分别显着增加0.12°C /十年,0.27°C /十年和0.17°C /十年。观察到DTR显着下降趋势,下降趋势为0.12°C /十年,这与TNmean的较高增长率有关。所有温暖的极端指数TXx,TNx,TX90p和TN90p都呈现出显着的上升趋势,分别上升了0.19°C /十年,0.28°C /十年,2.86%/十年和3.08%/十年。对于凉爽的极端指数,TX10p和TN10p分别显着下降了0.95%/十年和3.18%/十年,尽管TXn下降0.11°C /十年的趋势在统计上并不显着。唯一表现出明显上升趋势的凉爽指数是TNn 0.44°C /十年,这表明凉爽夜晚的减少。除此之外,与农村和高原地区相比,马来西亚半岛北部和西部的主要城市通常表现出更高的变暖趋势。这些可能与快速城市化过程中加剧的城市热岛效应有关。这项研究还发现,在马来西亚,ENSO对温暖极端指数的影响远大于寒冷极端指数。这些可能与快速城市化过程中加剧的城市热岛效应有关。这项研究还发现,在马来西亚,ENSO对温暖极端指数的影响远大于寒冷极端指数。这些可能与快速城市化过程中加剧的城市热岛效应有关。这项研究还发现,在马来西亚,ENSO对温暖极端指数的影响远大于寒冷极端指数。
更新日期:2020-10-06
中文翻译:
1985年至2018年马来西亚极端温度的变化及其与ENSO的关系
了解极端温度的变化对于管理和应对与区域气候变化相关的风险非常重要。然而,马来西亚仍然没有对温度极限及其变化的气候特征进行充分的研究。这项研究评估了1985-2018年间马来西亚极端温度的时空变化。这项研究包括四个阶段:(a)温度数据的收集,质量控制和均质性分析;(b)常规(TXmean,TNmean,TMmean和DTR),温暖(TXx,TNx,TX90p和TN90p)和凉爽(TXn,TNn,TX10p和TN10p)温度极限指数的计算;(c)使用Mann-Kendall和Sens的斜率检验对极端温度进行趋势分析;(d)分析极端温度与厄尔尼诺-南方涛动(ENSO)之间的相关性。结果表明马来西亚各地,特别是马来西亚半岛的地表温度升高。通常,TXmean,TNmean和TMmean以5%的显着性水平分别显着增加0.12°C /十年,0.27°C /十年和0.17°C /十年。观察到DTR显着下降趋势,下降趋势为0.12°C /十年,这与TNmean的较高增长率有关。所有温暖的极端指数TXx,TNx,TX90p和TN90p都呈现出显着的上升趋势,分别上升了0.19°C /十年,0.28°C /十年,2.86%/十年和3.08%/十年。对于凉爽的极端指数,TX10p和TN10p分别显着下降了0.95%/十年和3.18%/十年,尽管TXn下降0.11°C /十年的趋势在统计上并不显着。唯一表现出明显上升趋势的凉爽指数是TNn 0.44°C /十年,这表明凉爽夜晚的减少。除此之外,与农村和高原地区相比,马来西亚半岛北部和西部的主要城市通常表现出更高的变暖趋势。这些可能与快速城市化过程中加剧的城市热岛效应有关。这项研究还发现,在马来西亚,ENSO对温暖极端指数的影响远大于寒冷极端指数。这些可能与快速城市化过程中加剧的城市热岛效应有关。这项研究还发现,在马来西亚,ENSO对温暖极端指数的影响远大于寒冷极端指数。这些可能与快速城市化过程中加剧的城市热岛效应有关。这项研究还发现,在马来西亚,ENSO对温暖极端指数的影响远大于寒冷极端指数。


 京公网安备 11010802027423号