当前位置:
X-MOL 学术
›
Comput. Graph. Forum
›
论文详情
Our official English website, www.x-mol.net, welcomes your feedback! (Note: you will need to create a separate account there.)
Physics‐based Pathline Clustering and Exploration
Computer Graphics Forum ( IF 2.5 ) Pub Date : 2020-10-05 , DOI: 10.1111/cgf.14093 Duong B. Nguyen 1 , Lei Zhang 1 , Robert S. Laramee 2 , David Thompson 3 , Rodolfo Ostilla Monico 1 , Guoning Chen 1
Computer Graphics Forum ( IF 2.5 ) Pub Date : 2020-10-05 , DOI: 10.1111/cgf.14093 Duong B. Nguyen 1 , Lei Zhang 1 , Robert S. Laramee 2 , David Thompson 3 , Rodolfo Ostilla Monico 1 , Guoning Chen 1
Affiliation
|
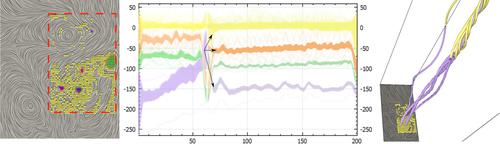
Most existing unsteady flow visualization techniques concentrate on the depiction of geometric patterns in flow, assuming the geometry information provides sufficient representation of the underlying physical characteristics, which is not always the case. To address this challenge, this work proposes to analyze the time-dependent characteristics of the physical attributes measured along pathlines which can be represented as a series of time activity curves (TAC). We demonstrate that the temporal trends of these TACs can convey the relation between pathlines and certain well-known flow features (e.g., vortices and shearing layers), which enables us to select pathlines that can effectively represent the physical characteristics of interest and their temporal behavior in the unsteady flow. Inspired by this observation, a new TAC-based unsteady flow visualization and analysis framework is proposed. The center of this framework is a new similarity measure that compares the similarity of two TACs, from which a new spatio-temporal, hierarchical clustering that classifies pathlines based on their physical attributes, and a TACbased pathline exploration and selection strategy are proposed. A visual analytic system incorporating the TAC-based pathline clustering and exploration is developed, which also provides new visualizations to support the user exploration of unsteady flow using TACs. This visual analytic system is applied to a number of unsteady flow in 2D and 3D to demonstrate its utility. The new system successfully reveals the detailed structure of vortices, the relation between shear layer and vortex formation, and vortex breakdown, which are difficult to convey with conventional methods.
中文翻译:

基于物理的路径聚类与探索
大多数现有的非定常流动可视化技术专注于流动中几何图案的描绘,假设几何信息提供了潜在物理特性的充分表示,但情况并非总是如此。为了应对这一挑战,这项工作建议分析沿路径测量的物理属性的时间相关特性,这些特性可以表示为一系列时间活动曲线 (TAC)。我们证明这些 TAC 的时间趋势可以传达路径与某些众所周知的流动特征(例如,涡流和剪切层)之间的关系,这使我们能够选择能够有效表示感兴趣的物理特征及其时间行为的路径在不稳定的流动中。受此观察启发,提出了一种新的基于 TAC 的非稳态流动可视化和分析框架。该框架的中心是一个新的相似性度量,用于比较两个 TAC 的相似性,从中提出了一种新的时空层次聚类,根据路径的物理属性对路径进行分类,并提出了基于 TAC 的路径探索和选择策略。开发了一种结合了基于 TAC 的路径聚类和探索的视觉分析系统,它还提供了新的可视化,以支持用户使用 TAC 探索不稳定流。这个视觉分析系统被应用于2D和3D中的许多非定常流动以证明其实用性。新系统成功揭示了涡流的详细结构、剪切层与涡流形成的关系以及涡流击穿,
更新日期:2020-10-05
中文翻译:
基于物理的路径聚类与探索
大多数现有的非定常流动可视化技术专注于流动中几何图案的描绘,假设几何信息提供了潜在物理特性的充分表示,但情况并非总是如此。为了应对这一挑战,这项工作建议分析沿路径测量的物理属性的时间相关特性,这些特性可以表示为一系列时间活动曲线 (TAC)。我们证明这些 TAC 的时间趋势可以传达路径与某些众所周知的流动特征(例如,涡流和剪切层)之间的关系,这使我们能够选择能够有效表示感兴趣的物理特征及其时间行为的路径在不稳定的流动中。受此观察启发,提出了一种新的基于 TAC 的非稳态流动可视化和分析框架。该框架的中心是一个新的相似性度量,用于比较两个 TAC 的相似性,从中提出了一种新的时空层次聚类,根据路径的物理属性对路径进行分类,并提出了基于 TAC 的路径探索和选择策略。开发了一种结合了基于 TAC 的路径聚类和探索的视觉分析系统,它还提供了新的可视化,以支持用户使用 TAC 探索不稳定流。这个视觉分析系统被应用于2D和3D中的许多非定常流动以证明其实用性。新系统成功揭示了涡流的详细结构、剪切层与涡流形成的关系以及涡流击穿,


 京公网安备 11010802027423号