Environmental Modelling & Software ( IF 4.9 ) Pub Date : 2020-08-25 , DOI: 10.1016/j.envsoft.2020.104832 Brandon Feenstra , Ashley Collier-Oxandale , Vasileios Papapostolou , David Cocker , Andrea Polidori
|
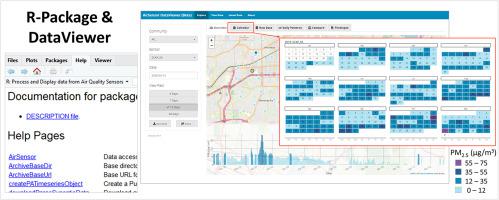
While large-scale low-cost sensor networks are now recording air pollutant concentrations at finer spatial and temporal scales than previously measured, the large environmental data sets generated by these sensor networks can become overwhelming when considering the scientific skills required to analyze the data and generate interpretable results. This paper summarizes the development of an open-source R package (AirSensor) and interactive web application (DataViewer) designed to address the environmental data science challenges of visualizing and understanding local air quality conditions with community networks of low-cost air quality sensors. AirSensor allows users to access historical data, add spatial metadata, and create maps and plots for viewing community monitoring data. The DataViewer application was developed to incorporate the functionality and plotting functions of the R package into a user-friendly web experience that would serve as the primary source for data communication for community-based organizations and citizen scientists.
中文翻译:
AirSensor开源R-package和DataViewer Web应用程序,用于解释由低成本传感器网络收集的社区数据
虽然大型低成本传感器网络现在正在以比以前测量的更精细的空间和时间尺度记录空气污染物浓度,但是考虑到分析数据和生成数据所需的科学技能,这些传感器网络生成的大型环境数据集可能变得不堪重负。可解释的结果。本文总结了开源R包(AirSensor)和交互式Web应用程序(DataViewer)的开发,旨在解决通过低成本空气质量传感器社区网络可视化和理解本地空气质量状况的环境数据科学挑战。空气传感器允许用户访问历史数据,添加空间元数据,以及创建地图和地块以查看社区监视数据。在DataViewer的应用程序的开发是为了整合将R包的功能和绘图功能整合到一个用户友好的网络体验,将作为为社区组织和公民科学家数据通信的主要来源。


 京公网安备 11010802027423号