Our official English website, www.x-mol.net, welcomes your feedback! (Note: you will need to create a separate account there.)
VIStory: interactive storyboard for exploring visual information in scientific publications
Journal of Visualization ( IF 1.7 ) Pub Date : 2020-08-16 , DOI: 10.1007/s12650-020-00688-1 Wei Zeng 1 , Ao Dong 1, 2 , Xi Chen 1, 2 , Zhang-Lin Cheng 1
Journal of Visualization ( IF 1.7 ) Pub Date : 2020-08-16 , DOI: 10.1007/s12650-020-00688-1 Wei Zeng 1 , Ao Dong 1, 2 , Xi Chen 1, 2 , Zhang-Lin Cheng 1
Affiliation
|
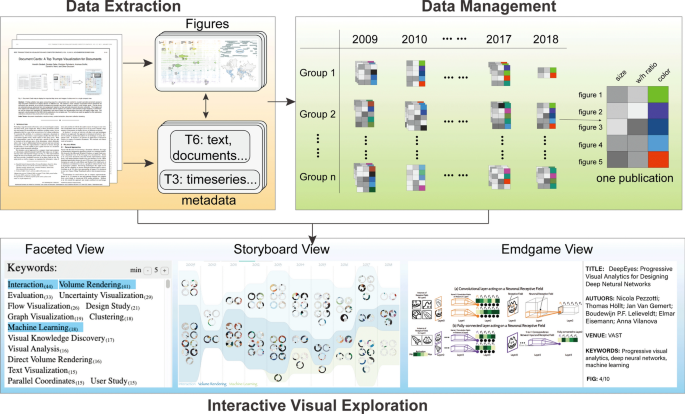
Abstract Many visual analytics have been developed for examining scientific publications comprising wealthy data such as authors and citations. The studies provide unprecedented insights on a variety of applications, e.g., literature review and collaboration analysis. However, visual information (e.g., figures) that is widely employed for storytelling and methods description are often neglected. We present VIStory, an interactive storyboard for exploring visual information in scientific publications. We harvest a new dataset of a large corpora of figures, using an automatic figure extraction method. Each figure contains various attributes such as dominant color and width/height ratio, together with faceted metadata of the publication including venues, authors, and keywords. To depict these information, we develop an intuitive interface consisting of three components: (1) Faceted View enables efficient query by publication metadata, benefiting from a nested table structure, (2) Storyboard View arranges paper rings—a well-designed glyph for depicting figure attributes, in a themeriver layout to reveal temporal trends, and (3) Endgame View presents a highlighted figure together with the publication metadata. We illustrate the applicability of VIStory with case studies on two datasets, i.e., 10-year IEEE VIS publications, and publications by a research team at CVPR, ICCV, and ECCV conferences. Quantitative and qualitative results from a formal user study demonstrate the efficiency of VIStory in exploring visual information in scientific publications. Graphical abstract Electronic supplementary material The online version of this article (10.1007/s12650-020-00688-1) contains supplementary material, which is available to authorized users.
中文翻译:

VIStory:用于探索科学出版物中的视觉信息的交互式故事板
摘要已经开发了许多可视化分析来检查包含丰富数据(如作者和引文)的科学出版物。这些研究为各种应用提供了前所未有的见解,例如文献综述和合作分析。然而,广泛用于讲故事和方法描述的视觉信息(例如,图形)经常被忽视。我们展示了 VIStory,这是一个交互式故事板,用于探索科学出版物中的视觉信息。我们使用自动图形提取方法收集大量图形的新数据集。每个图都包含各种属性,例如主色和宽度/高度比,以及出版物的多面元数据,包括地点、作者和关键字。为了描述这些信息,我们开发了一个由三个组件组成的直观界面:(1)Faceted View 可以通过出版物元数据进行高效查询,这得益于嵌套的表格结构,(2)Storyboard View 排列纸环——一个精心设计的用于描绘图形属性的字形,在主题河布局以揭示时间趋势,以及 (3) Endgame View 与出版物元数据一起显示突出显示的图形。我们通过两个数据集的案例研究来说明 VIStory 的适用性,即 10 年 IEEE VIS 出版物,以及研究团队在 CVPR、ICCV 和 ECCV 会议上的出版物。来自正式用户研究的定量和定性结果证明了 VIStory 在探索科学出版物中的视觉信息方面的效率。图文摘要电子补充材料本文网络版(10.
更新日期:2020-08-16
中文翻译:
VIStory:用于探索科学出版物中的视觉信息的交互式故事板
摘要已经开发了许多可视化分析来检查包含丰富数据(如作者和引文)的科学出版物。这些研究为各种应用提供了前所未有的见解,例如文献综述和合作分析。然而,广泛用于讲故事和方法描述的视觉信息(例如,图形)经常被忽视。我们展示了 VIStory,这是一个交互式故事板,用于探索科学出版物中的视觉信息。我们使用自动图形提取方法收集大量图形的新数据集。每个图都包含各种属性,例如主色和宽度/高度比,以及出版物的多面元数据,包括地点、作者和关键字。为了描述这些信息,我们开发了一个由三个组件组成的直观界面:(1)Faceted View 可以通过出版物元数据进行高效查询,这得益于嵌套的表格结构,(2)Storyboard View 排列纸环——一个精心设计的用于描绘图形属性的字形,在主题河布局以揭示时间趋势,以及 (3) Endgame View 与出版物元数据一起显示突出显示的图形。我们通过两个数据集的案例研究来说明 VIStory 的适用性,即 10 年 IEEE VIS 出版物,以及研究团队在 CVPR、ICCV 和 ECCV 会议上的出版物。来自正式用户研究的定量和定性结果证明了 VIStory 在探索科学出版物中的视觉信息方面的效率。图文摘要电子补充材料本文网络版(10.


 京公网安备 11010802027423号